|
|
市場調査レポート
商品コード
1609617
勃起不全薬の市場規模、シェア、動向分析レポート:製品別、投与形態別、地域別、セグメント予測、2025年~2030年Erectile Dysfunction Drugs Market Size, Share & Trends Analysis Report By Product (Viagra, Cialis, Levitra/Staxyn), By Mode of Administration (Oral, Injectable), By Region, And Segment Forecasts, 2025 - 2030 |
||||||
|
|||||||
カスタマイズ可能
|
|||||||

| 勃起不全薬の市場規模、シェア、動向分析レポート:製品別、投与形態別、地域別、セグメント予測、2025年~2030年 |
|
出版日: 2024年11月06日
発行: Grand View Research
ページ情報: 英文 120 Pages
納期: 2~10営業日
|

全表示
- 概要
- 図表
- 目次
勃起不全薬市場の成長と動向:
Grand View Research, Inc.の最新レポートによると、世界の勃起不全薬の市場規模は2025年から2030年にかけてCAGR 9.13%で拡大し、2030年には49億米ドルに達する見込みです。
勃起不全の有病率の増加が市場成長に寄与すると期待されています。欧州泌尿器科学会によると、2020年の40~70歳の欧州男性人口におけるEDの全体的な有病率は約52%であることが判明しました。また、ボストン大学医学部によると、40歳代男性人口の約22.0%、70歳代男性人口の約49.0%が勃起不全に罹患しています。このように、老年人口の増加は予測期間中にEDの有病率を増加させると予想され、市場に有利な成長機会を生み出すと期待されています。
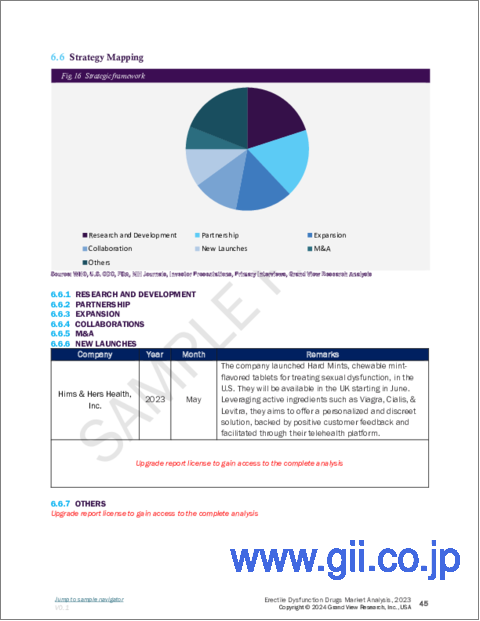
イーライリリー・アンド・カンパニーは、リリー患者支援プログラム(LPSP)を通じて低価格で医薬品を提供し、ED患者を支援しています。このプログラムは、カナダ国内の適格なED保険未加入患者に経済的支援を提供するもので、このプログラムには登録が必要な場合があります。このように、シアリスのブランドバージョンにこのような支援プログラムが存在することで、低所得層の患者が購入しやすくなり、収益の増加にもつながる可能性があります。さらに、企業は海外市場における製品の製造・商業化のために、提携やパートナーシップなどのイニシアチブをとっています。例えば、2022年1月、ペトロス・ファーマシューティカルズ・インクは、アバナフィル錠剤の商業生産のために世界の製造受託機関(CDMO)と提携しました。この提携は、既存のビバス社との契約に代わり、製品供給を継続することを目的としています。
さらに、国立医学図書館(2021年)によると、中国本土のED患者を対象にステンドラの安全性と有効性を評価する第3相臨床試験が四川海斯古製薬有限公司によって実施されました。臨床試験の結果、ステンドラ100mgと200mgの2回投与により、中国のED患者に改善がみられました。このような臨床的有効性の証明により、Strenda(Avanafil)の市場での地位は強化されるかもしれないです。しかし、勃起不全に対する認識不足、治療に対する羞恥心、偽陽性説、病気に関する社会的烙印、慎重さの欠如などが、市場の成長を抑制する可能性があります。欧州泌尿器科学会(EAU)が実施した調査によると、スペイン人のうちED治療について聞いたことがあるのはわずか18%であるのに対し、68.0%の人が治療効果を信じています。
勃起不全薬市場レポートハイライト
- 製品別では、バイアグラが世界中で入手可能であることと、ED患者の間で同製品に対する認知度が高まっていることから、バイアグラ部門が2024年に最大の市場シェアを占めました。
- 北米が勃起不全薬市場を独占し、2024年に50.54%の売上シェアを占めました。これは、同地域における疾病負担の高さ、強力な医療インフラ、治療用新製品の迅速な承認によるものです。
- 2024年の市場シェアは、経口投与が84.03%で最大でした。経口投与は、その利便性、非侵襲性、患者の嗜好の広さによって、市場の支配的なセグメントとなっています。
目次
第1章 調査手法と範囲
第2章 エグゼクティブサマリー
第3章 勃起不全薬市場の変数、動向、範囲
- 市場系統の見通し
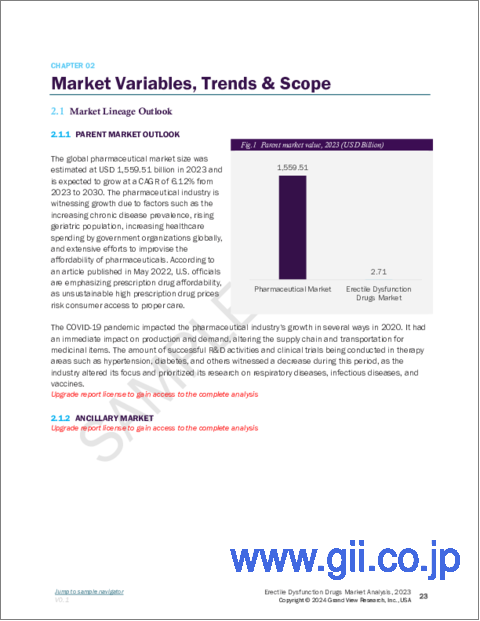
- 親市場の見通し
- 関連/付随市場の見通し
- 市場力学
- 市場促進要因分析
- 市場抑制要因分析
- 勃起不全薬市場分析ツール
- 業界分析- ポーターのファイブフォース分析
- PESTEL分析
第4章 勃起不全薬市場:製品推定・動向分析
- セグメントダッシュボード
- 勃起不全薬市場:製品変動分析
- 勃起不全薬市場:製品別展望
- 2018年から2030年までの市場規模と予測および動向分析
- バイアグラ(シルデナフィルクエン酸塩)
- シアリス(タダラフィル)
- ステンドラ/スペドラ(アバナフィル)
- ジデナ(ウデナフィル)
- その他の薬物
第5章 勃起不全薬市場:投与方法の推定・動向分析
- セグメントダッシュボード
- 勃起不全薬市場:投与方法の変動分析
- 勃起不全薬市場:投与方法別展望
- 2018年から2030年までの市場規模と予測および動向分析
- 経口投与法
- 注射による投与方法
- その他の投与方法
第6章 勃起不全薬市場:地域推定・動向分析
- 地域ダッシュボード
- 市場規模、予測動向分析、2018年から2030年:
- 北米
- 米国
- カナダ
- メキシコ
- 欧州
- 英国
- ドイツ
- フランス
- イタリア
- スペイン
- ノルウェー
- スウェーデン
- デンマーク
- アジア太平洋
- 日本
- 中国
- インド
- オーストラリア
- 韓国
- タイ
- ラテンアメリカ
- ブラジル
- アルゼンチン
- 中東・アフリカ
- 南アフリカ
- サウジアラビア
- アラブ首長国連邦
- クウェート
第7章 競合情勢
- 市場参入企業の分類
- 主要市場参入企業による最近の動向と影響分析
- 企業市場シェア分析、2024年
- 主要企業プロファイル
- Bayer AG
- Lilly
- GlaxoSmithKline PLC
- Petros Pharmaceuticals, Inc.
- Pfizer Inc.
- Teva Pharmaceutical Industries Ltd
- Lupin Limited
- Futura Medical
- Cure Pharmaceutical
- 23andMe
- Hims &Hers Health, Inc.
- RO
- BlueChew
- GoodRx, Inc.
List of Tables
- Table 1. List of Secondary Sources
- Table 2. List of Abbreviations
- Table 3. Global Erectile Dysfunction Drugs market, by Product, 2018 - 2030 (USD Million)
- Table 4. Global Erectile Dysfunction Drugs market, by Mode of Administration, 2018 - 2030 (USD Million)
- Table 5. North America Erectile Dysfunction Drugs market, by Product, 2018 - 2030 (USD Million)
- Table 6. North America Erectile Dysfunction Drugs market, by Mode of Administration, 2018 - 2030 (USD Million)
- Table 7. U.S. Erectile Dysfunction Drugs market, by Product, 2018 - 2030 (USD Million)
- Table 8. U.S. Erectile Dysfunction Drugs market, by Mode of Administration, 2018 - 2030 (USD Million)
- Table 9. Canada Erectile Dysfunction Drugs market, by Product, 2018 - 2030 (USD Million)
- Table 10. Canada Erectile Dysfunction Drugs market, by Mode of Administration, 2018 - 2030 (USD Million)
- Table 11. Mexico Erectile Dysfunction Drugs market, by Product, 2018 - 2030 (USD Million)
- Table 12. Mexico Erectile Dysfunction Drugs market, by Mode of Administration, 2018 - 2030 (USD Million)
- Table 13. Europe Erectile Dysfunction Drugs market, by Product, 2018 - 2030 (USD Million)
- Table 14. Europe Erectile Dysfunction Drugs market, by Mode of Administration, 2018 - 2030 (USD Million)
- Table 15. UK Erectile Dysfunction Drugs market, by Product, 2018 - 2030 (USD Million)
- Table 16. UK Erectile Dysfunction Drugs market, by Mode of Administration, 2018 - 2030 (USD Million)
- Table 17. Germany Erectile Dysfunction Drugs market, by Product, 2018 - 2030 (USD Million)
- Table 18. Germany Erectile Dysfunction Drugs market, by Mode of Administration, 2018 - 2030 (USD Million)
- Table 19. France Erectile Dysfunction Drugs market, by Product, 2018 - 2030 (USD Million)
- Table 20. France Erectile Dysfunction Drugs market, by Mode of Administration, 2018 - 2030 (USD Million)
- Table 21. Italy Erectile Dysfunction Drugs market, by Product, 2018 - 2030 (USD Million)
- Table 22. Italy Erectile Dysfunction Drugs market, by Mode of Administration, 2018 - 2030 (USD Million)
- Table 23. Spain Erectile Dysfunction Drugs market, by Product, 2018 - 2030 (USD Million)
- Table 24. Spain Erectile Dysfunction Drugs market, by Mode of Administration, 2018 - 2030 (USD Million)
- Table 25. Denmark Erectile Dysfunction Drugs market, by Product, 2018 - 2030 (USD Million)
- Table 26. Denmark Erectile Dysfunction Drugs market, by Mode of Administration, 2018 - 2030 (USD Million)
- Table 27. Sweden Erectile Dysfunction Drugs market, by Product, 2018 - 2030 (USD Million)
- Table 28. Sweden Erectile Dysfunction Drugs market, by Mode of Administration, 2018 - 2030 (USD Million)
- Table 29. Norway Erectile Dysfunction Drugs market, by Product, 2018 - 2030 (USD Million)
- Table 30. Norway Erectile Dysfunction Drugs market, by Mode of Administration, 2018 - 2030 (USD Million)
- Table 31. Asia Pacific Erectile Dysfunction Drugs market, by Product, 2018 - 2030 (USD Million)
- Table 32. Asia Pacific Erectile Dysfunction Drugs market, by Mode of Administration, 2018 - 2030 (USD Million)
- Table 33. Japan Erectile Dysfunction Drugs market, by Product, 2018 - 2030 (USD Million)
- Table 34. Japan Erectile Dysfunction Drugs market, by Mode of Administration, 2018 - 2030 (USD Million)
- Table 35. China Erectile Dysfunction Drugs market, by Product, 2018 - 2030 (USD Million)
- Table 36. China Erectile Dysfunction Drugs market, by Mode of Administration, 2018 - 2030 (USD Million)
- Table 37. India Erectile Dysfunction Drugs market, by Product, 2018 - 2030 (USD Million)
- Table 38. India Erectile Dysfunction Drugs market, by Mode of Administration, 2018 - 2030 (USD Million)
- Table 39. Australia Erectile Dysfunction Drugs market, by Product, 2018 - 2030 (USD Million)
- Table 40. Australia Erectile Dysfunction Drugs market, by Mode of Administration, 2018 - 2030 (USD Million)
- Table 41. South Korea Erectile Dysfunction Drugs market, by Product, 2018 - 2030 (USD Million)
- Table 42. South Korea Erectile Dysfunction Drugs market, by Mode of Administration, 2018 - 2030 (USD Million)
- Table 43. Thailand Erectile Dysfunction Drugs market, by Product, 2018 - 2030 (USD Million)
- Table 44. Thailand Erectile Dysfunction Drugs market, by Mode of Administration, 2018 - 2030 (USD Million)
- Table 45. Latin America Erectile Dysfunction Drugs market, by Product, 2018 - 2030 (USD Million)
- Table 46. Latin America Erectile Dysfunction Drugs market, by Mode of Administration, 2018 - 2030 (USD Million)
- Table 47. Brazil Erectile Dysfunction Drugs market, by Product, 2018 - 2030 (USD Million)
- Table 48. Brazil Erectile Dysfunction Drugs market, by Mode of Administration, 2018 - 2030 (USD Million)
- Table 49. Argentina Erectile Dysfunction Drugs market, by Product, 2018 - 2030 (USD Million)
- Table 50. Argentina Erectile Dysfunction Drugs market, by Mode of Administration, 2018 - 2030 (USD Million)
- Table 51. Middle East & Africa Erectile Dysfunction Drugs market, by Product, 2018 - 2030 (USD Million)
- Table 52. Middle East & Africa Erectile Dysfunction Drugs market, by Mode of Administration, 2018 - 2030 (USD Million)
- Table 53. South Africa Erectile Dysfunction Drugs market, by Product, 2018 - 2030 (USD Million)
- Table 54. South Africa Erectile Dysfunction Drugs market, by Mode of Administration, 2018 - 2030 (USD Million)
- Table 55. Saudi Arabia Erectile Dysfunction Drugs market, by Product, 2018 - 2030 (USD Million)
- Table 56. Saudi Arabia Erectile Dysfunction Drugs market, by Mode of Administration, 2018 - 2030 (USD Million)
- Table 57. UAE Erectile Dysfunction Drugs market, by Product, 2018 - 2030 (USD Million)
- Table 58. UAE Erectile Dysfunction Drugs market, by Mode of Administration, 2018 - 2030 (USD Million)
- Table 59. Kuwait Erectile Dysfunction Drugs market, by Product, 2018 - 2030 (USD Million)
- Table 60. Kuwait Erectile Dysfunction Drugs market, by Mode of Administration, 2018 - 2030 (USD Million)
List of Figures
- Fig. 1 Information procurement
- Fig. 2 Primary research pattern
- Fig. 3 Market research approaches
- Fig. 4 Value chain-based sizing & forecasting
- Fig. 5 Market formulation & validation
- Fig. 6 Erectile Dysfunction Drugs market segmentation
- Fig. 7 Market driver analysis (current & future impact)
- Fig. 8 Market restraint analysis (current & future impact)
- Fig. 9 SWOT analysis, by factor (political & legal, economic and technological)
- Fig. 10 Porter's five forces analysis
- Fig. 11 Erectile Dysfunction Drugs market, Product outlook key takeaways 2024 & 2030 (USD Million)
- Fig. 12 Viagra (sildenafil citrate) market revenue estimates and forecasts, 2018 - 2030 (USD Million)
- Fig. 13 Cialis (tadalafil) market revenue estimates and forecasts, 2018 - 2030 (USD Million)
- Fig. 14 Levitra/Staxyn (vardenafil) market revenue estimates and forecasts, 2018 - 2030 (USD Million)
- Fig. 15 Stendra/Spedra (avanafil) market revenue estimates and forecasts, 2018 - 2030 (USD Million)
- Fig. 16 Zydena (udenafil) market revenue estimates and forecasts, 2018 - 2030 (USD Million)
- Fig. 17 Other drugs market revenue estimates and forecasts, 2018 - 2030 (USD Million)
- Fig. 18 Erectile Dysfunction Drugs market, Mode of Administration outlook key takeaways 2024 & 2030 (USD Million)
- Fig. 19 Oral mode of administration market revenue estimates and forecasts, 2018 - 2030 (USD Million
- Fig. 20 Injectable mode of administration market revenue estimates and forecasts, 2018 - 2030 (USD Million
- Fig. 21 Other modes of administration market revenue estimates and forecasts, 2018 - 2030 (USD Million)
- Fig. 22 North America erectile dysfunction drugs market estimates and forecasts, 2018 - 2030 (USD Million)
- Fig. 23 U.S. erectile dysfunction drugs market estimates and forecasts, 2018 - 2030 (USD Million)
- Fig. 24 Canada erectile dysfunction drugs market estimates and forecasts, 2018 - 2030 (USD Million)
- Fig. 25 Mexico erectile dysfunction drugs market estimates and forecasts, 2018 - 2030 (USD Million)
- Fig. 26 Europe erectile dysfunction drugs market estimates and forecasts, 2018 - 2030 (USD Million)
- Fig. 27 UK erectile dysfunction drugs market estimates and forecasts, 2018 - 2030 (USD Million)
- Fig. 28 Germany erectile dysfunction drugs market estimates and forecasts, 2018 - 2030 (USD Million)
- Fig. 29 France erectile dysfunction drugs market estimates and forecasts, 2018 - 2030 (USD Million)
- Fig. 30 Spain erectile dysfunction drugs market estimates and forecasts, 2018 - 2030 (USD Million)
- Fig. 31 Italy erectile dysfunction drugs market estimates and forecasts, 2018 - 2030 (USD Million)
- Fig. 32 Norway erectile dysfunction drugs market estimates and forecasts, 2018 - 2030 (USD Million)
- Fig. 33 Denmark erectile dysfunction drugs market estimates and forecasts, 2018 - 2030 (USD Million)
- Fig. 34 Sweden erectile dysfunction drugs market estimates and forecasts, 2018 - 2030 (USD Million)
- Fig. 35 Asia Pacific erectile dysfunction drugs market estimates and forecasts, 2018 - 2030 (USD Million)
- Fig. 36 China erectile dysfunction drugs market estimates and forecasts, 2018 - 2030 (USD Million)
- Fig. 37 Japan erectile dysfunction drugs market estimates and forecasts, 2018 - 2030 (USD Million)
- Fig. 38 India erectile dysfunction drugs market estimates and forecasts, 2018 - 2030 (USD Million)
- Fig. 39 South Korea erectile dysfunction drugs market estimates and forecasts, 2018 - 2030 (USD Million)
- Fig. 40 Australia erectile dysfunction drugs market estimates and forecasts, 2018 - 2030 (USD Million)
- Fig. 41 Thailand erectile dysfunction drugs market estimates and forecasts, 2018 - 2030 (USD Million)
- Fig. 42 Latin America erectile dysfunction drugs market estimates and forecasts, 2018 - 2030 (USD Million)
- Fig. 43 Brazil erectile dysfunction drugs market estimates and forecasts, 2018 - 2030 (USD Million)
- Fig. 44 Argentina erectile dysfunction drugs market estimates and forecasts, 2018 - 2030 (USD Million)
- Fig. 45 Middle East and Africa erectile dysfunction drugs market estimates and forecasts, 2018 - 2030 (USD Million)
- Fig. 46 South Africa erectile dysfunction drugs market estimates and forecasts, 2018 - 2030 (USD Million)
- Fig. 47 Saudi Arabia erectile dysfunction drugs market estimates and forecasts, 2018 - 2030 (USD Million)
- Fig. 48 UAE erectile dysfunction drugs market estimates and forecasts, 2018 - 2030 (USD Million)
- Fig. 49 Kuwait erectile dysfunction drugs market estimates and forecasts, 2018 - 2030 (USD Million)
Erectile Dysfunction Drugs Market Growth & Trends:
The global erectile dysfunction drugs market size is expected to reach USD 4.90 billion by 2030, expanding at a CAGR of 9.13% from 2025 to 2030, according to a new report by Grand View Research, Inc. The increasing prevalence of erectile dysfunction is expected to contribute to market growth. According to the European Association of Urology, the overall prevalence of ED was found to be around 52% in the European male population aged 40-70 years in 2020. In addition, according to the Boston University School of Medicine, approximately 22.0% of 40 years aged male population and 49.0% by age of 70 years are affected by erectile dysfunction. Thus, the increasing geriatric population is anticipated to increase the prevalence of ED over the forecast period and is expected to create lucrative growth opportunities in the market.
Eli Lilly and Company is supporting ED patients by offering medicine at low cost through Lilly Patient Support Program (LPSP). This program provides financial assistance to eligible ED uninsured patients in Canada who may require registration for this program. Thus, the presence of such supportive programs for a branded version of Cialis may increase the affordability of the lower-income patient population and also aid in generating increased revenue. Moreover, companies have undertaken initiatives such as collaboration and partnership for the manufacturing and commercialization of products in the overseas market. For instance, in January 2022, Petros Pharmaceuticals Inc. partnered with a global Contract Manufacturing Organization (CDMO) for the commercial production of Avanafil tablets. This partnership was formed with an aim to replace the existing agreement with Vivus Inc. and continue product supply.
Furthermore, according to the National Library of Medicine (2021), a phase 3 clinical trial was conducted by Sichuan Haisco Pharmaceutical Co., Ltd. to evaluate the safety and efficacy of Stendra in patients with ED in mainland China. The results of the clinical trial showed improvement in Chinese ED patients after administration of two doses of Stendra 100 mg & 200 mg. Such proven clinical effectiveness may strengthen Strenda's (Avanafil) position in the market. However, lack of awareness about erectile dysfunction, shame about treatment, false-positive beliefs, social stigma pertaining to the disease, and lack of discretion may restrain the market growth. As per the survey conducted by the European Association of Urology (EAU), only 18% of the Spanish population heard about ED treatment, whereas 68.0% of the population believes the treatment benefits.
Erectile Dysfunction Drugs Market Report Highlights:
- By product, the viagra segment held the largest market share in 2024 due to the worldwide availability of Viagra and increased awareness about the product among ED patients
- North America dominated the erectile dysfunction drugs market and accounted for a revenue share of 50.54% in 2024, due to the high burden of disease, strong healthcare infrastructure, and rapid approval of new products for treatment in the region.
- The oral mode segment accounted for the largest market share of 84.03% in 2024. The oral mode of administration is a dominant segment in the market, driven by its convenience, non-invasive nature, and widespread patient preference
Table of Contents
Chapter 1. Methodology and Scope
- 1.1. Market Segmentation and Scope
- 1.2. Segment Definitions
- 1.2.1. Product
- 1.2.2. Mode of Administration
- 1.2.3. Regional Scope
- 1.2.4. Estimates and forecasts timeline
- 1.3. Research Methodology
- 1.4. Information Procurement
- 1.4.1. Purchased database
- 1.4.2. GVR's internal database
- 1.4.3. Secondary sources
- 1.4.4. Primary research
- 1.4.5. Details of primary research
- 1.5. Information or Data Analysis
- 1.5.1. Data analysis models
- 1.6. Market Formulation & Validation
- 1.7. Model Details
- 1.7.1. Commodity flow analysis (Model 1)
- 1.7.2. Approach 1: Commodity flow approach
- 1.7.3. Volume price analysis (Model 2)
- 1.7.4. Approach 2: Volume price analysis
- 1.8. List of Secondary Sources
- 1.9. List of Primary Sources
- 1.10. Objectives
Chapter 2. Executive Summary
- 2.1. Market Outlook
- 2.2. Segment Outlook
- 2.3. Regional outlook
- 2.4. Competitive Insights
Chapter 3. Erectile Dysfunction Drugs Market Variables, Trends & Scope
- 3.1. Market Lineage Outlook
- 3.1.1. Parent Market Outlook
- 3.1.2. Related/ancillary market outlook
- 3.2. Market Dynamics
- 3.2.1. Market Driver Analysis
- 3.2.1.1. Increasing prevalence of erectile dysfunction
- 3.2.1.2. Rising geriatric population
- 3.2.1.3. Increasing research & development (R&D)
- 3.2.2. Market Restraint Analysis
- 3.2.2.1. Lack of healthcare infrastructure and manufacturing errors
- 3.2.2.2. Lack of awareness about erectile dysfunction
- 3.2.1. Market Driver Analysis
- 3.3. Erectile Dysfunction Drugs Market Analysis Tools
- 3.3.1. Industry Analysis - Porter's
- 3.3.1.1. Bargaining power of suppliers
- 3.3.1.2. Bargaining power of buyers
- 3.3.1.3. Threat of substitutes
- 3.3.1.4. Threat of new entrants
- 3.3.1.5. Competitive rivalry
- 3.3.2. PESTEL Analysis
- 3.3.2.1. Political landscape
- 3.3.2.2. Economic landscape
- 3.3.2.3. Social landscape
- 3.3.2.4. Technological landscape
- 3.3.2.5. Environmental landscape
- 3.3.2.6. Legal landscape
- 3.3.1. Industry Analysis - Porter's
Chapter 4. Erectile Dysfunction Drugs Market: Product Estimates & Trend Analysis
- 4.1. Segment Dashboard
- 4.2. Erectile Dysfunction Drugs Market: Product Movement Analysis
- 4.3. Erectile Dysfunction Drugs Market by Product Outlook (USD Million)
- 4.4. Market Size & Forecasts and Trend Analyses, 2018 to 2030 for the following
- 4.5. Viagra (sildenafil citrate)
- 4.5.1. Viagra (sildenafil citrate) Market Revenue Estimates and Forecasts, 2018 - 2030 (USD Million)
- 4.6. Cialis (Tadalafil)
- 4.6.1. Cialis (Tadalafil) Market Revenue Estimates and Forecasts, 2018 - 2030 (USD Million)
- 4.7. Stendra/Spedra (avanafil)
- 4.7.1. Stendra/Spedra (avanafil) Market Revenue Estimates and Forecasts, 2018 - 2030 (USD Million)
- 4.8. Zydena (udenafil)
- 4.8.1. Zydena (udenafil) Market Revenue Estimates and Forecasts, 2018 - 2030 (USD Million)
- 4.9. Other Drugs
- 4.9.1. Other Drugs Market Revenue Estimates and Forecasts, 2018 - 2030 (USD Million)
Chapter 5. Erectile Dysfunction Drugs Market: Mode of Administration Estimates & Trend Analysis
- 5.1. Segment Dashboard
- 5.2. Erectile Dysfunction Drugs Market: Mode of Administration Movement Analysis
- 5.3. Erectile Dysfunction Drugs Market by Mode of Administration Outlook (USD Million)
- 5.4. Market Size & Forecasts and Trend Analyses, 2018 to 2030 for the following
- 5.5. Oral Mode of Administration
- 5.5.1. Oral Mode of Administration Market Revenue Estimates and Forecasts, 2018 - 2030 (USD Million)
- 5.6. Injectable Mode of Administration
- 5.6.1. Injectable Mode of Administration Market Revenue Estimates and Forecasts, 2018 - 2030 (USD Million)
- 5.7. Other Modes of Administration
- 5.7.1. Other Modes of Administration Market Revenue Estimates and Forecasts, 2018 - 2030 (USD Million)
Chapter 6. Erectile Dysfunction Drugs Market: Regional Estimates & Trend Analysis
- 6.1. Regional Dashboard
- 6.2. Market Size, & Forecasts Trend Analysis, 2018 to 2030:
- 6.3. North America
- 6.3.1. U.S.
- 6.3.1.1. Key country dynamics
- 6.3.1.2. Regulatory framework/ reimbursement structure
- 6.3.1.3. Competitive scenario
- 6.3.1.4. U.S. market estimates and forecasts 2018 to 2030 (USD Million)
- 6.3.2. Canada
- 6.3.2.1. Key country dynamics
- 6.3.2.2. Regulatory framework/ reimbursement structure
- 6.3.2.3. Competitive scenario
- 6.3.2.4. Canada market estimates and forecasts 2018 to 2030 (USD Million)
- 6.3.3. Mexico
- 6.3.3.1. Key country dynamics
- 6.3.3.2. Regulatory framework/ reimbursement structure
- 6.3.3.3. Competitive scenario
- 6.3.3.4. Mexico market estimates and forecasts 2018 to 2030 (USD Million)
- 6.3.1. U.S.
- 6.4. Europe
- 6.4.1. UK
- 6.4.1.1. Key country dynamics
- 6.4.1.2. Regulatory framework/ reimbursement structure
- 6.4.1.3. Competitive scenario
- 6.4.1.4. UK market estimates and forecasts 2018 to 2030 (USD Million)
- 6.4.2. Germany
- 6.4.2.1. Key country dynamics
- 6.4.2.2. Regulatory framework/ reimbursement structure
- 6.4.2.3. Competitive scenario
- 6.4.2.4. Germany market estimates and forecasts 2018 to 2030 (USD Million)
- 6.4.3. France
- 6.4.3.1. Key country dynamics
- 6.4.3.2. Regulatory framework/ reimbursement structure
- 6.4.3.3. Competitive scenario
- 6.4.3.4. France market estimates and forecasts 2018 to 2030 (USD Million)
- 6.4.4. Italy
- 6.4.4.1. Key country dynamics
- 6.4.4.2. Regulatory framework/ reimbursement structure
- 6.4.4.3. Competitive scenario
- 6.4.4.4. Italy market estimates and forecasts 2018 to 2030 (USD Million)
- 6.4.5. Spain
- 6.4.5.1. Key country dynamics
- 6.4.5.2. Regulatory framework/ reimbursement structure
- 6.4.5.3. Competitive scenario
- 6.4.5.4. Spain market estimates and forecasts 2018 to 2030 (USD Million)
- 6.4.6. Norway
- 6.4.6.1. Key country dynamics
- 6.4.6.2. Regulatory framework/ reimbursement structure
- 6.4.6.3. Competitive scenario
- 6.4.6.4. Norway market estimates and forecasts 2018 to 2030 (USD Million)
- 6.4.7. Sweden
- 6.4.7.1. Key country dynamics
- 6.4.7.2. Regulatory framework/ reimbursement structure
- 6.4.7.3. Competitive scenario
- 6.4.7.4. Sweden market estimates and forecasts 2018 to 2030 (USD Million)
- 6.4.8. Denmark
- 6.4.8.1. Key country dynamics
- 6.4.8.2. Regulatory framework/ reimbursement structure
- 6.4.8.3. Competitive scenario
- 6.4.8.4. Denmark market estimates and forecasts 2018 to 2030 (USD Million)
- 6.4.1. UK
- 6.5. Asia Pacific
- 6.5.1. Japan
- 6.5.1.1. Key country dynamics
- 6.5.1.2. Regulatory framework/ reimbursement structure
- 6.5.1.3. Competitive scenario
- 6.5.1.4. Japan market estimates and forecasts 2018 to 2030 (USD Million)
- 6.5.2. China
- 6.5.2.1. Key country dynamics
- 6.5.2.2. Regulatory framework/ reimbursement structure
- 6.5.2.3. Competitive scenario
- 6.5.2.4. China market estimates and forecasts 2018 to 2030 (USD Million)
- 6.5.3. India
- 6.5.3.1. Key country dynamics
- 6.5.3.2. Regulatory framework/ reimbursement structure
- 6.5.3.3. Competitive scenario
- 6.5.3.4. India market estimates and forecasts 2018 to 2030 (USD Million)
- 6.5.4. Australia
- 6.5.4.1. Key country dynamics
- 6.5.4.2. Regulatory framework/ reimbursement structure
- 6.5.4.3. Competitive scenario
- 6.5.4.4. Australia market estimates and forecasts 2018 to 2030 (USD Million)
- 6.5.5. South Korea
- 6.5.5.1. Key country dynamics
- 6.5.5.2. Regulatory framework/ reimbursement structure
- 6.5.5.3. Competitive scenario
- 6.5.5.4. South Korea market estimates and forecasts 2018 to 2030 (USD Million)
- 6.5.6. Thailand
- 6.5.6.1. Key country dynamics
- 6.5.6.2. Regulatory framework/ reimbursement structure
- 6.5.6.3. Competitive scenario
- 6.5.6.4. Thailand market estimates and forecasts 2018 to 2030 (USD Million)
- 6.5.1. Japan
- 6.6. Latin America
- 6.6.1. Brazil
- 6.6.1.1. Key country dynamics
- 6.6.1.2. Regulatory framework/ reimbursement structure
- 6.6.1.3. Competitive scenario
- 6.6.1.4. Brazil market estimates and forecasts 2018 to 2030 (USD Million)
- 6.6.2. Argentina
- 6.6.2.1. Key country dynamics
- 6.6.2.2. Regulatory framework/ reimbursement structure
- 6.6.2.3. Competitive scenario
- 6.6.2.4. Argentina market estimates and forecasts 2018 to 2030 (USD Million)
- 6.6.1. Brazil
- 6.7. MEA
- 6.7.1. South Africa
- 6.7.1.1. Key country dynamics
- 6.7.1.2. Regulatory framework/ reimbursement structure
- 6.7.1.3. Competitive scenario
- 6.7.1.4. South Africa market estimates and forecasts 2018 to 2030 (USD Million)
- 6.7.2. Saudi Arabia
- 6.7.2.1. Key country dynamics
- 6.7.2.2. Regulatory framework/ reimbursement structure
- 6.7.2.3. Competitive scenario
- 6.7.2.4. Saudi Arabia market estimates and forecasts 2018 to 2030 (USD Million)
- 6.7.3. UAE
- 6.7.3.1. Key country dynamics
- 6.7.3.2. Regulatory framework/ reimbursement structure
- 6.7.3.3. Competitive scenario
- 6.7.3.4. UAE market estimates and forecasts 2018 to 2030 (USD Million)
- 6.7.4. Kuwait
- 6.7.4.1. Key country dynamics
- 6.7.4.2. Regulatory framework/ reimbursement structure
- 6.7.4.3. Competitive scenario
- 6.7.4.4. Kuwait market estimates and forecasts 2018 to 2030 (USD Million)
- 6.7.1. South Africa
Chapter 7. Competitive Landscape
- 7.1. Market Participant Categorization
- 7.2. Recent Developments & Impact Analysis by Key Market Participants
- 7.3. Company Market Share Analysis, 2024
- 7.4. Key Company Profiles
- 7.4.1. Bayer AG
- 7.4.1.1. Company overview
- 7.4.1.2. Financial performance
- 7.4.1.3. Product benchmarking
- 7.4.1.4. Strategic initiatives
- 7.4.2. Lilly
- 7.4.2.1. Company overview
- 7.4.2.2. Financial performance
- 7.4.2.3. Product benchmarking
- 7.4.2.4. Strategic initiatives
- 7.4.3. GlaxoSmithKline PLC
- 7.4.3.1. Company overview
- 7.4.3.2. Financial performance
- 7.4.3.3. Product benchmarking
- 7.4.3.4. Strategic initiatives
- 7.4.4. Petros Pharmaceuticals, Inc.
- 7.4.4.1. Company overview
- 7.4.4.2. Financial performance
- 7.4.4.3. Product benchmarking
- 7.4.4.4. Strategic initiatives
- 7.4.5. Pfizer Inc.
- 7.4.5.1. Company overview
- 7.4.5.2. Financial performance
- 7.4.5.3. Product benchmarking
- 7.4.5.4. Strategic initiatives
- 7.4.6. Teva Pharmaceutical Industries Ltd
- 7.4.6.1. Company overview
- 7.4.6.2. Financial performance
- 7.4.6.3. Product benchmarking
- 7.4.6.4. Strategic initiatives
- 7.4.7. Lupin Limited
- 7.4.7.1. Company overview
- 7.4.7.2. Financial performance
- 7.4.7.3. Product benchmarking
- 7.4.7.4. Strategic initiatives
- 7.4.8. Futura Medical
- 7.4.8.1. Company overview
- 7.4.8.2. Financial performance
- 7.4.8.3. Product benchmarking
- 7.4.8.4. Strategic initiatives
- 7.4.9. Cure Pharmaceutical
- 7.4.9.1. Company overview
- 7.4.9.2. Financial performance
- 7.4.9.3. Product benchmarking
- 7.4.9.4. Strategic initiatives
- 7.4.10. 23andMe
- 7.4.10.1. Company overview
- 7.4.10.2. Financial performance
- 7.4.10.3. Product benchmarking
- 7.4.10.4. Strategic initiatives
- 7.4.11. Hims & Hers Health, Inc.
- 7.4.11.1. Company overview
- 7.4.11.2. Financial performance
- 7.4.11.3. Product benchmarking
- 7.4.11.4. Strategic initiatives
- 7.4.12. RO
- 7.4.12.1. Company overview
- 7.4.12.2. Financial performance
- 7.4.12.3. Product benchmarking
- 7.4.12.4. Strategic initiatives
- 7.4.13. BlueChew
- 7.4.13.1. Company overview
- 7.4.13.2. Financial performance
- 7.4.13.3. Product benchmarking
- 7.4.13.4. Strategic initiatives
- 7.4.14. GoodRx, Inc.
- 7.4.14.1. Company overview
- 7.4.14.2. Financial performance
- 7.4.14.3. Product benchmarking
- 7.4.14.4. Strategic initiatives
- 7.4.1. Bayer AG

