|
|
市場調査レポート
商品コード
1654170
仮想発電所の市場規模、シェア、動向分析レポート:技術別、最終用途別、地域別、セグメント予測、2025年~2030年Virtual Power Plant Market Size, Share & Trends Analysis Report By Technology (Distributed Energy, Resource, Demand Response, Mixed Asset), By End Use (Industrial, Commercial, Residential), By Region, And Segment Forecasts, 2025 - 2030 |
||||||
|
|||||||
カスタマイズ可能
|
|||||||

| 仮想発電所の市場規模、シェア、動向分析レポート:技術別、最終用途別、地域別、セグメント予測、2025年~2030年 |
|
出版日: 2025年01月13日
発行: Grand View Research
ページ情報: 英文 130 Pages
納期: 2~10営業日
|

全表示
- 概要
- 図表
- 目次
仮想発電所市場の成長と動向
Grand View Research, Inc.の最新レポートによると、世界の仮想発電所市場規模は2030年までに166億5,000万米ドルに達すると予測され、2025~2030年のCAGRは22.3%で拡大すると予測されています。
仮想発電所(VPP)は、エネルギーセグメントにおける二酸化炭素排出量の削減に大きな役割を果たすことができます。仮想発電所は、クリーンなエネルギー源の使用を優先し、炭素集約的な発電源の使用を可能な限り最小化するようにプログラムすることができ、その結果、電力生産に関連する全体的な排出量を削減することができます。先進的制御アルゴリズムとリアルタイムのモニタリングにより、仮想発電所はエネルギー生産と消費を最適化し、エネルギーの浪費と関連する排出を削減することができます。
仮想発電所は、エネルギー消費とコスト削減をよりコントロールできるようにすることで、住宅と商業の両方の顧客にいくつかの利点を記載しています。顧客は、仮想発電所プログラムに参加することで、エネルギー料金を削減することができます。仮想発電所は、顧客が使用時間帯価格と需要応答の機会を利用することを可能にし、より低コストの時間帯にエネルギー消費をシフトし、ピーク需要料金を回避することを可能にします。仮想発電所には、顧客がリアルタイムでエネルギー使用量をモニタリング・制御できる先進的エネルギー管理ツールやアプリケーションが付属していることが多いです。
厳しい政府規制は、仮想発電所の使用を促進する上で重要な役割を果たすことができます。温室効果ガスの排出削減を目的とした規制は、クリーンエネルギー技術の採用を奨励することが多いです。仮想発電所は、再生可能エネルギーと需要応答の統合を可能にすることで、エネルギー部門の二酸化炭素排出削減に貢献し、政府の排出削減目標に合致します。政府は、送電網の全体的な効率とインテリジェンスを向上させるために、送電網の近代化の取り組みに投資することが多いです。
仮想発電所市場のレポートハイライト
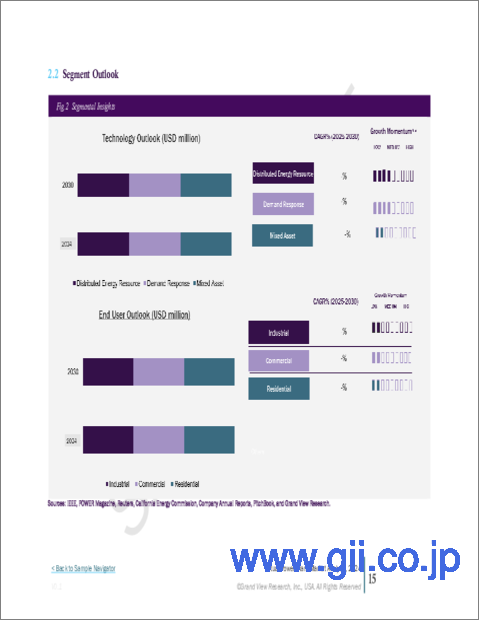
- 技術面では、需要応答セグメントが2024年の市場を独占しました。デマンドレスポンスセグメントは、より広範な持続可能性目標に合致しており、世界がより環境に優しく、より応答性の高いエネルギーシステムへの移行を進める中で、VPP市場成長の重要な原動力となっています。
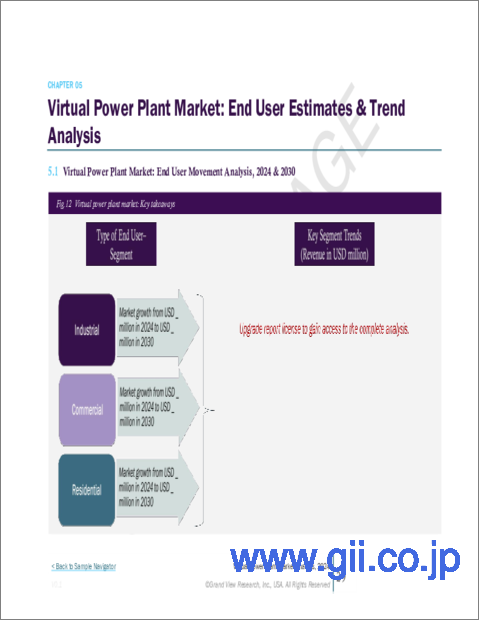
- 最終用途別では、産業セグメントが2024年の市場を独占しました。このセグメントの成長は、その大きなエネルギー需要、複雑なエネルギー管理ニーズ、VPP採用による大幅なコスト削減とカーボンフットプリント削減の可能性に起因しています。
- 2024年の地域別市場は北米が支配的です。再生可能エネルギーの利点に対する意識の高まりが、北米における風力、太陽光、水力発電などの再生可能エネルギー需要の増加につながっています。さらに、同地域では政府の支援策が再生可能エネルギー源の市場開拓を促進しており、これが仮想発電所の需要を促進し、同地域市場の成長を牽引すると期待されています。
- 2023年6月、スマートエネルギー技術のリーダーであるSolarEdge Technologies, Inc.は、英国のNational Grid ESO Demand Flexibility Service(DFS)を通じてグリッドサポートを提供する初のバッテリー仮想発電所を発表しました。このサービスは、英国全土で対象となるスマートメーターを備えたSolarEdgeホーム・バッテリーの所有者が利用でき、DFSの需要イベント時に蓄電したバッテリーエネルギーを利用するための金銭的インセンティブを記載しています。
目次
第1章 調査手法と範囲
第2章 エグゼクティブサマリー
第3章 仮想発電所市場の変数、動向、範囲
- 市場イントロダクション/系統展望
- 産業バリューチェーン分析
- 市場力学
- 市場促進要因分析
- 市場抑制要因分析
- 産業の課題
- 仮想発電所市場分析ツール
- ポーターの分析
- PESTEL分析
第4章 仮想発電所市場:技術別、推定・動向分析
- セグメントダッシュボード
- 仮想発電所市場:技術変動分析、2024年と2030年
- 分散型エネルギー資源
- 分散型エネルギー資源の収益推定と予測、2018~2030年
- 需要応答
- 混合資産
第5章 仮想発電所市場:最終用途別、推定・動向分析
- セグメントダッシュボード
- 仮想発電所市場:最終用途変動分析、2024年と2030年
- 産業
- 業務用
- 家庭用
第6章 仮想発電所市場:地域別、推定・動向分析
- 仮想発電所の市場シェア、地域別、2024年と2030年
- 北米
- 米国
- カナダ
- メキシコ
- 欧州
- 英国
- ドイツ
- フランス
- アジア太平洋
- 中国
- インド
- 日本
- 韓国
- オーストラリア
- ラテンアメリカ
- ブラジル
- 中東・アフリカ
- サウジアラビア王国(KSA)
- アラブ首長国連邦
- 南アフリカ
第7章 競合情勢
- 主要市場参入企業による最近の動向と影響分析
- 企業分類
- 企業の市場ポジショニング
- 企業の市場シェア分析
- 企業ヒートマップ分析
- 戦略マッピング
- 拡大
- 合併と買収
- パートナーシップとコラボレーション
- 新製品の発売
- 研究開発
- 企業プロファイル
- Siemens AG
- TOSHIBA CORPORATION
- Next Kraftwerke GmbH
- Hitachi, Ltd.
- ABB Ltd.
- Tesla, Inc.
- AutoGrid Systems, Inc.
- Limejump Limited
- Sunverge Energy, Inc.
- Centrica plc
List of Tables
- Table 1 Global Virtual Power Plant market size estimates & forecasts 2018 - 2030 (USD Million)
- Table 2 Global Virtual Power Plant market, by region, 2018 - 2030 (USD Million)
- Table 3 Global Virtual Power Plant market, by technology, 2018 - 2030 (USD Million)
- Table 4 Global Virtual Power Plant market, by end use, 2018 - 2030 (USD Million)
- Table 5 Distributed Energy Resource Virtual Power Plant market, by region, 2018 - 2030 (USD Million)
- Table 6 Demand Response Virtual Power Plant market, by region, 2018 - 2030 (USD Million)
- Table 7 Mixed Asset Virtual Power Plant market, by region, 2018 - 2030 (USD Million)
- Table 8 Industrial Virtual Power Plant market, by region, 2018 - 2030 (USD Million)
- Table 9 Commercial Virtual Power Plant market, by region, 2018 - 2030 (USD Million)
- Table 10 Residential Virtual Power Plant market, by region, 2018 - 2030 (USD Million)
- Table 11 North America Virtual Power Plant market, by technology, 2018 - 2030 (USD Million)
- Table 12 North America Virtual Power Plant market, by end use, 2018 - 2030 (USD Million)
- Table 13 U.S Virtual Power Plant market, by technology, 2018 - 2030 (USD Million)
- Table 14 U.S Virtual Power Plant market, by end use, 2018 - 2030 (USD Million)
- Table 15 Canada Virtual Power Plant market, by technology, 2018 - 2030 (USD Million)
- Table 16 Canada Virtual Power Plant market, by end use, 2018 - 2030 (USD Million)
- Table 17 Mexico Virtual Power Plant market, by technology, 2018 - 2030 (USD Million)
- Table 18 Mexico Virtual Power Plant market, by end use, 2018 - 2030 (USD Million)
- Table 19 Europe Virtual Power Plant market, by technology, 2018 - 2030 (USD Million)
- Table 20 Europe Virtual Power Plant market, by end use, 2018 - 2030 (USD Million)
- Table 21 UK Virtual Power Plant market, by technology, 2018 - 2030 (USD Million)
- Table 22 UK Virtual Power Plant market, by end use, 2018 - 2030 (USD Million)
- Table 23 Germany Virtual Power Plant market, by technology, 2018 - 2030 (USD Million)
- Table 24 Germany Virtual Power Plant market, by end use, 2018 - 2030 (USD Million)
- Table 25 France Virtual Power Plant market, by technology, 2018 - 2030 (USD Million)
- Table 26 France Virtual Power Plant market, by end use, 2018 - 2030 (USD Million)
- Table 27 Asia Pacific Virtual Power Plant market, by technology, 2018 - 2030 (USD Million)
- Table 28 Asia Pacific Virtual Power Plant market, by end use, 2018 - 2030 (USD Million)
- Table 29 China Virtual Power Plant market, by technology, 2018 - 2030 (USD Million)
- Table 30 China Virtual Power Plant market, by end use, 2018 - 2030 (USD Million)
- Table 31 India Virtual Power Plant market, by technology, 2018 - 2030 (USD Million)
- Table 32 India Virtual Power Plant market, by end use, 2018 - 2030 (USD Million)
- Table 33 Japan Virtual Power Plant market, by technology, 2018 - 2030 (USD Million)
- Table 34 Japan Virtual Power Plant market, by end use, 2018 - 2030 (USD Million)
- Table 35 South Korea Virtual Power Plant market, by technology, 2018 - 2030 (USD Million)
- Table 36 South Korea Virtual Power Plant market, by end use, 2018 - 2030 (USD Million)
- Table 37 Australia Virtual Power Plant market, by technology, 2018 - 2030 (USD Million)
- Table 38 Australia Virtual Power Plant market, by end use, 2018 - 2030 (USD Million)
- Table 39 Latin America Virtual Power Plant market, by technology, 2018 - 2030 (USD Million)
- Table 40 Latin America Virtual Power Plant market, by end use, 2018 - 2030 (USD Million)
- Table 41 Brazil Virtual Power Plant market, by technology, 2018 - 2030 (USD Million)
- Table 42 Brazil Virtual Power Plant market, by end use, 2018 - 2030 (USD Million)
- Table 43 MEA Virtual Power Plant market, by technology, 2018 - 2030 (USD Million)
- Table 44 MEA Virtual Power Plant market, by end use, 2018 - 2030 (USD Million)
- Table 45 UAE Virtual Power Plant market, by technology, 2018 - 2030 (USD Million)
- Table 46 UAE Virtual Power Plant market, by end use, 2018 - 2030 (USD Million)
- Table 47 KSA Virtual Power Plant market, by technology, 2018 - 2030 (USD Million)
- Table 48 KSA Virtual Power Plant market, by end use, 2018 - 2030 (USD Million)
- Table 49 South Africa Virtual Power Plant market, by technology, 2018 - 2030 (USD Million)
- Table 50 South Africa Virtual Power Plant market, by end use, 2018 - 2030 (USD Million)
List of Figures
- Fig. 1 Virtual power plant market segmentation
- Fig. 2 Market research process
- Fig. 3 Information procurement
- Fig. 4 Primary research pattern
- Fig. 5 Market research approaches
- Fig. 6 Value chain-based sizing & forecasting
- Fig. 7 Parent market analysis
- Fig. 8 Market formulation & validation
- Fig. 9 Virtual Power Plant market snapshot
- Fig. 10 Virtual Power Plant market segment snapshot
- Fig. 11 Virtual Power Plant market competitive landscape snapshot
- Fig. 12 Market research process
- Fig. 13 Market driver relevance analysis (Current & future impact)
- Fig. 14 Market restraint relevance analysis (Current & future impact)
- Fig. 15 Virtual Power Plant market, technology outlook key takeaways (USD Million)
- Fig. 16 Virtual Power Plant market, technology movement analysis (USD Million), 2024 & 2030
- Fig. 17 Distributed Energy Resource market revenue estimates and forecasts, 2018 - 2030 (USD Million)
- Fig. 18 Demand Response market revenue estimates and forecasts, 2018 - 2030 (USD Million)
- Fig. 19 Mixed Asset market revenue estimates and forecasts, 2018 - 2030 (USD Million)
- Fig. 20 Virtual Power Plant market: End Use outlook key takeaways (USD Million)
- Fig. 21 Virtual Power Plant market: End Use movement analysis (USD Million), 2024 & 2030
- Fig. 22 Industrial virtual power plant market revenue estimates and forecasts, 2018 - 2030 (USD Million)
- Fig. 23 Commercial virtual power plant market revenue estimates and forecasts, 2018 - 2030 (USD Million)
- Fig. 24 Residential virtual power plant market revenue estimates and forecasts, 2018 - 2030 (USD Million)
- Fig. 25 Regional marketplace: Key takeaways
- Fig. 26 Virtual Power Plant market: Regional outlook, 2024 & 2030, (USD Million)
- Fig. 27 North America Virtual Power Plant market estimates and forecasts, 2018 - 2030 (USD Million)
- Fig. 28 US Virtual Power Plant market estimates and forecasts, 2018 - 2030 (USD Million)
- Fig. 29 Canada Virtual Power Plant market estimates and forecasts, 2018 - 2030 (USD Million)
- Fig. 30 Mexico Virtual Power Plant market estimates and forecasts, 2018 - 2030 (USD Million)
- Fig. 31 Europe Virtual Power Plant market estimates and forecasts, 2018 - 2030 (USD Million)
- Fig. 32 UK Virtual Power Plant market estimates and forecasts, 2018 - 2030 (USD Million)
- Fig. 33 Germany Virtual Power Plant market estimates and forecasts, 2018 - 2030 (USD Million)
- Fig. 34 France Virtual Power Plant market estimates and forecasts, 2018 - 2030 (USD Million)
- Fig. 35 Asia Pacific Virtual Power Plant market estimates and forecasts, 2018 - 2030 (USD Million)
- Fig. 36 China Virtual Power Plant market estimates and forecasts, 2018 - 2030 (USD Million)
- Fig. 37 Japan Virtual Power Plant market estimates and forecasts, 2018 - 2030 (USD Million)
- Fig. 38 India Virtual Power Plant market estimates and forecasts, 2018 - 2030 (USD Million)
- Fig. 39 Australia Virtual Power Plant market estimates and forecasts, 2018 - 2030 (USD Million)
- Fig. 40 South Korea Virtual Power Plant market estimates and forecasts, 2018 - 2030 (USD Million)
- Fig. 41 Latin America Virtual Power Plant market estimates and forecasts, 2018 - 2030 (USD Million)
- Fig. 42 Brazil Virtual Power Plant market estimates and forecasts, 2018 - 2030 (USD Million)
- Fig. 43 MEA Virtual Power Plant market estimates and forecasts, 2018 - 2030 (USD Million)
- Fig. 44 KSA Virtual Power Plant market estimates and forecasts, 2018 - 2030 (USD Million)
- Fig. 45 UAE Virtual Power Plant market estimates and forecasts, 2018 - 2030 (USD Million)
- Fig. 46 South Africa Virtual Power Plant market estimates and forecasts, 2018 - 2030 (USD Million)
- Fig. 47 Strategy framework
- Fig. 48 Company Categorization
Virtual Power Plant Market Growth & Trends:
The global virtual power plant market size is anticipated to reach USD 16.65 billion by 2030 and is anticipated to expand at a CAGR of 22.3% from 2025 to 2030, according to a new report by Grand View Research. Virtual power plants (VPPs) can play a significant role in reducing carbon emissions in the energy sector. Virtual power plants can be programmed to prioritize the use of clean energy sources and minimize the use of carbon-intensive generation sources when possible, thus lowering overall emissions associated with electricity production. Through advanced control algorithms and real-time monitoring, virtual power plants can optimize energy production and consumption, reducing energy waste and associated emissions.
Virtual power plants offer several benefits to customers, both residential and commercial, by providing them with greater control over their energy consumption and cost savings. Customers can reduce their energy bills by participating in virtual power plant programs. Virtual power plant enables customers to take advantage of time-of-use pricing and demand response opportunities, allowing them to shift energy consumption to lower-cost periods and avoid peak-demand charges. Virtual power plants often come with advanced energy management tools and applications that allow customers to monitor and control their energy usage in real-time.
Stringent government regulations can play a significant role in driving the use of virtual power plants. Regulations aimed at reducing greenhouse gas emissions often incentivize adopting clean energy technologies. Virtual power plants, by enabling the integration of renewables and demand response, contribute to reducing carbon emissions in the energy sector, aligning with government emission reduction goals. Governments often invest in grid modernization efforts to improve the overall efficiency and intelligence of the power grid.
Virtual Power Plant Market Report Highlights:
- In terms of technology, the demand response segment dominated the market in 2024. The demand response segment aligns with the broader sustainability goals, making it a critical driver of the VPP market's growth as the world increasingly transitions towards greener and more responsive energy systems.
- In terms of end use, the industrial segment dominated the market in 2024. The growth of the segment can be attributed to its substantial energy demands, complex energy management needs, and the potential for significant cost savings and carbon footprint reduction through VPP adoption.
- North America dominated the regional market in 2024. The growing awareness of the benefits of renewable power is leading to a rise in demand for renewables such as wind, solar, and hydropower in North America. Furthermore, supportive government initiatives in the region are promoting the development of renewable energy sources, which is expected to drive the demand for virtual power plants, thus driving the growth of the regional market.
- In June 2023, SolarEdge Technologies, Inc., a smart energy technology leader, unveiled its 1st battery virtual power plant that provides grid support through the U.K.'s National Grid ESO Demand Flexibility Service (DFS). This service can be leveraged for SolarEdge home battery owners with eligible smart meters across the U.K. and provides them financial incentives to utilize their stored battery energy during DFS demand events.
Table of Contents
Chapter 1. Methodology and Scope
- 1.1. Market Segmentation and Scope
- 1.2. Research Methodology
- 1.2.1. Information Procurement
- 1.3. Information or Data Analysis
- 1.4. Methodology
- 1.5. Research Scope and Assumptions
- 1.6. Market Formulation & Validation
- 1.7. List of Data Sources
Chapter 2. Executive Summary
- 2.1. Market Outlook
- 2.2. Segment Outlook
- 2.3. Competitive Insights
Chapter 3. Virtual Power Plant Market Variables, Trends, & Scope
- 3.1. Market Introduction/Lineage Outlook
- 3.2. Industry Value Chain Analysis
- 3.3. Market Dynamics
- 3.3.1. Market Driver Analysis
- 3.3.2. Market Restraint Analysis
- 3.3.3. Industry Challenge
- 3.4. Virtual Power Plant Market Analysis Tools
- 3.4.1. Porter's Analysis
- 3.4.1.1. Bargaining power of the suppliers
- 3.4.1.2. Bargaining power of the buyers
- 3.4.1.3. Threats of substitution
- 3.4.1.4. Threats from new entrants
- 3.4.1.5. Competitive rivalry
- 3.4.2. PESTEL Analysis
- 3.4.2.1. Political landscape
- 3.4.2.2. Economic and Social landscape
- 3.4.2.3. Technological landscape
- 3.4.2.4. Environmental landscape
- 3.4.2.5. Legal landscape
- 3.4.1. Porter's Analysis
Chapter 4. Virtual Power Plant Market: Technology Estimates & Trend Analysis
- 4.1. Segment Dashboard
- 4.2. Virtual Power Plant Market: Technology Movement Analysis, 2024 & 2030 (USD Million)
- 4.3. Distributed Energy Resource
- 4.3.1. Distributed Energy Resource Revenue Estimates and Forecasts, 2018 - 2030 (USD Million)
- 4.4. Demand Response
- 4.4.1. Demand Response Market Revenue Estimates and Forecasts, 2018 - 2030 (USD Million)
- 4.5. Mixed Asset
- 4.5.1. Mixed Asset Market Revenue Estimates and Forecasts, 2018 - 2030 (USD Million)
Chapter 5. Virtual Power Plant Market: End Use Estimates & Trend Analysis
- 5.1. Segment Dashboard
- 5.2. Virtual Power Plant Market: End Use Movement Analysis, 2024 & 2030 (USD Million)
- 5.3. Industrial
- 5.3.1. Industrial Market Revenue Estimates and Forecasts, 2018 - 2030 (USD Million)
- 5.4. Commercial
- 5.4.1. Commercial Market Revenue Estimates and Forecasts, 2018 - 2030 (USD Million)
- 5.5. Residential
- 5.5.1. Residential Market Revenue Estimates and Forecasts, 2018 - 2030 (USD Million)
Chapter 6. Virtual Power Plant Market: Regional Estimates & Trend Analysis
- 6.1. Virtual Power Plant Market Share, By Region, 2024 & 2030 (USD Million)
- 6.2. North America
- 6.2.1. North America Virtual Power Plant Market Estimates and Forecasts, 2018 - 2030 (USD Million)
- 6.2.2. U.S.
- 6.2.2.1. U.S. Virtual Power Plant Market Estimates and Forecasts, 2018 - 2030 (USD Million)
- 6.2.3. Canada
- 6.2.3.1. Canada Virtual Power Plant Market Estimates and Forecasts, 2018 - 2030 (USD Million)
- 6.2.4. Mexico
- 6.2.4.1. Mexico Virtual Power Plant Market Estimates and Forecasts, 2018 - 2030 (USD Million)
- 6.3. Europe
- 6.3.1. Europe Virtual Power Plant Market Estimates and Forecasts, 2018 - 2030 (USD Million)
- 6.3.2. UK
- 6.3.2.1. UK Virtual Power Plant Market Estimates and Forecasts, 2018 - 2030 (USD Million)
- 6.3.3. Germany
- 6.3.3.1. Germany Virtual Power Plant Market Estimates and Forecasts, 2018 - 2030 (USD Million)
- 6.3.4. France
- 6.3.4.1. France Virtual Power Plant Market Estimates and Forecasts, 2018 - 2030 (USD Million)
- 6.4. Asia Pacific
- 6.4.1. Asia Pacific Virtual Power Plant Market Estimates and Forecasts, 2018 - 2030 (USD Million)
- 6.4.2. China
- 6.4.2.1. China Virtual Power Plant Market Estimates and Forecasts, 2018 - 2030 (USD Million)
- 6.4.3. India
- 6.4.3.1. India Virtual Power Plant Market Estimates and Forecasts, 2018 - 2030 (USD Million)
- 6.4.4. Japan
- 6.4.4.1. Japan Virtual Power Plant Market Estimates and Forecasts, 2018 - 2030 (USD Million)
- 6.4.5. South Korea
- 6.4.5.1. South Korea Virtual Power Plant Market Estimates and Forecasts, 2018 - 2030 (USD Million)
- 6.4.6. Australia
- 6.4.6.1. Australia Virtual Power Plant Market Estimates and Forecasts, 2018 - 2030 (USD Million)
- 6.5. Latin America
- 6.5.1. Latin America Virtual Power Plant Market Estimates and Forecasts, 2018 - 2030 (USD Million)
- 6.5.2. Brazil
- 6.5.2.1. Brazil Virtual Power Plant Market Estimates and Forecasts, 2018 - 2030 (USD Million)
- 6.6. Middle East and Africa
- 6.6.1. Middle East and Africa Virtual Power Plant Market Estimates and Forecasts, 2018 - 2030 (USD Million)
- 6.6.2. Kingdom of Saudi Arabia (KSA)
- 6.6.2.1. Kingdom of Saudi Arabia (KSA) Virtual Power Plant Market Estimates and Forecasts, 2018 - 2030 (USD Million)
- 6.6.3. UAE
- 6.6.3.1. UAE Virtual Power Plant Market Estimates and Forecasts, 2018 - 2030 (USD Million)
- 6.6.4. South Africa
- 6.6.4.1. South Africa Virtual Power Plant Market Estimates and Forecasts, 2018 - 2030 (USD Million)
Chapter 7. Competitive Landscape
- 7.1. Recent Developments & Impact Analysis by Key Market Participants
- 7.2. Company Categorization
- 7.3. Company Market Positioning
- 7.4. Company Market Share Analysis
- 7.5. Company Heat Map Analysis
- 7.6. Strategy Mapping
- 7.6.1. Expansion
- 7.6.2. Mergers & Acquisition
- 7.6.3. Partnerships & Collaborations
- 7.6.4. New Product Launches
- 7.6.5. Research And Development
- 7.7. Company Profiles
- 7.7.1. Siemens AG
- 7.7.1.1. Participant's Overview
- 7.7.1.2. Financial Performance
- 7.7.1.3. Product Benchmarking
- 7.7.1.4. Recent Developments
- 7.7.2. TOSHIBA CORPORATION
- 7.7.2.1. Participant's Overview
- 7.7.2.2. Financial Performance
- 7.7.2.3. Product Benchmarking
- 7.7.2.4. Recent Developments
- 7.7.3. Next Kraftwerke GmbH.
- 7.7.3.1. Participant's Overview
- 7.7.3.2. Financial Performance
- 7.7.3.3. Product Benchmarking
- 7.7.3.4. Recent Developments
- 7.7.4. Hitachi, Ltd.
- 7.7.4.1. Participant's Overview
- 7.7.4.2. Financial Performance
- 7.7.4.3. Product Benchmarking
- 7.7.4.4. Recent Developments
- 7.7.5. ABB Ltd.
- 7.7.5.1. Participant's Overview
- 7.7.5.2. Financial Performance
- 7.7.5.3. Product Benchmarking
- 7.7.5.4. Recent Developments
- 7.7.6. Tesla, Inc.
- 7.7.6.1. Participant's Overview
- 7.7.6.2. Financial Performance
- 7.7.6.3. Product Benchmarking
- 7.7.6.4. Recent Developments
- 7.7.7. AutoGrid Systems, Inc.
- 7.7.7.1. Participant's Overview
- 7.7.7.2. Financial Performance
- 7.7.7.3. Product Benchmarking
- 7.7.7.4. Recent Developments
- 7.7.8. Limejump Limited
- 7.7.8.1. Participant's Overview
- 7.7.8.2. Financial Performance
- 7.7.8.3. Product Benchmarking
- 7.7.8.4. Recent Developments
- 7.7.9. Sunverge Energy, Inc.
- 7.7.9.1. Participant's Overview
- 7.7.9.2. Financial Performance
- 7.7.9.3. Product Benchmarking
- 7.7.9.4. Recent Developments
- 7.7.10. Centrica plc
- 7.7.10.1. Participant's Overview
- 7.7.10.2. Financial Performance
- 7.7.10.3. Product Benchmarking
- 7.7.10.4. Recent Developments
- 7.7.1. Siemens AG

