|
|
市場調査レポート
商品コード
1376010
衝突回避システムの市場規模、シェア、動向分析レポート:技術別、用途別、地域別、セグメント予測、2023年~2030年Collision Avoidance System Market Size, Share & Trends Analysis Report By Technology (Radar, Camera, Ultrasound, LiDAR), By Application (ACC, BSD, FCWS, LDWS, Parking Assistance), By Region, And Segment Forecasts, 2023 - 2030 |
||||||
|
|
|||||||
カスタマイズ可能
|
|||||||


| 衝突回避システムの市場規模、シェア、動向分析レポート:技術別、用途別、地域別、セグメント予測、2023年~2030年 |
|
出版日: 2023年10月25日
発行: Grand View Research
ページ情報: 英文 120 Pages
納期: 2~10営業日
|

- 全表示
- 概要
- 図表
- 目次
衝突回避システム市場の成長と動向:
Grand View Research, Inc.の最新レポートによると、衝突回避システムの世界市場規模は2023年から2030年にかけてCAGR 11.4%で拡大し、2030年には1,574億7,000万米ドルに達すると予測されています。
安全機関の格付けが更新され、大衆向けモデルに衝突防止システムが搭載されたことで、今後6年間の市場成長が促進されると予想されます。
消費者の意識の高まりと市場参入企業による広範な研究開発が市場成長を後押ししています。衝突回避システムは、自動車が半自律的・自律的な意思決定を行うことを可能にします。また、消費者や政府からの安全に対するニーズの高まりも、衝突回避システム市場の成長を後押しすると予想されます。
最近のセンサー技術の発展は、高度に洗練されたデバイスを作り、自動車の様々な部品で補強することを指向しています。衝突防止システムによって、自動車OEMは自律走行車の目標を達成するために追加のインテリジェンスを統合することができます。
厳しい法規制基準により、自動車にセンサーを搭載することが義務付けられています。これが衝突回避システム市場をさらに牽引すると推定されます。しかし、長距離レーダーやLiDARベースのシステムはコストが高いため、低価格の自動車メーカーは自動車のコスト上乗せを控える可能性があり、市場の成長を抑制する可能性があります。
衝突回避システム市場のレポートハイライト
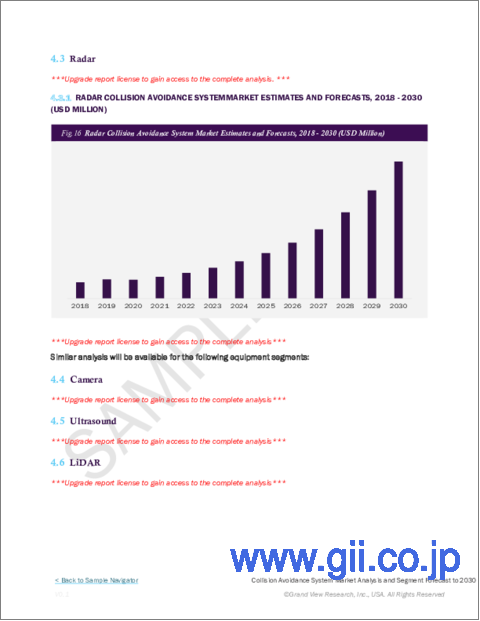
- レーダー分野は2022年に43.3%の大きな市場シェアを占めました。同分野は予測期間中にさらに市場シェアを拡大すると予測されます。
- レーダーの低価格化により、様々な自動車OEMがこの技術を採用するようになっています。
- カメラベースの衝突回避システムは、自動車への搭載を義務付ける政府規制により、高い成長が見込まれます。
- アダプティブクルーズコントロールは、2022年に大きな市場シェアを占めました。アダプティブクルーズコントロールは、長距離および中・短距離レーダーシステムに依存して、車両の速度を自動的に調整するシステムです。
- 2014年の国連交通安全共同研究(UN Road Safety Collaboration)によると、技術革新は事故の90%を占める人為的ミスによる事故の脅威に対抗するため、自動車へのシステム搭載を義務付ける可能性があります。
- 予測期間中、欧州が引き続き市場をリードすると予想されます。2022年には市場の33.0%以上を占めています。
- 主な業界参加者には、ボッシュ、コンチネンタル、デルファイ、デンソー、オートリブ、TRWなどが含まれます。
目次
第1章 調査手法と範囲
第2章 エグゼクティブサマリー
第3章 衝突回避システムの市場変数、動向、範囲
- 市場系統の見通し
- 業界のバリューチェーン分析
- 市場力学
- 市場促進要因分析
- 市場抑制要因分析
- 市場機会分析
- 衝突回避システム市場分析ツール
- 業界分析- ポーターのファイブフォース分析
- PESTEL分析
第4章 衝突回避システム市場:技術別の推定・動向分析
- 衝突回避システム市場:重要なポイント
- 衝突回避システム市場:動向と市場シェア分析、2022年および2030年
- レーダー
- カメラ
- 超音波
- LiDAR
第5章 衝突回避システム市場:用途別の推定・動向分析
- 衝突回避システム市場:重要なポイント
- 衝突回避システム市場:動向と市場シェア分析、2022年および2030年
- 教育
- ビジネス
- 医療
- その他
第6章 衝突回避システム市場:地域別の推定・動向分析
- 地域別の見通し
- 地域別の衝突回避システム市場:重要なポイント
- 北米
- 市場推計・予測、2017年から2030年まで
- 米国
- カナダ
- 欧州
- 英国
- ドイツ
- フランス
- アジア太平洋
- 日本
- 中国
- インド
- オーストラリア
- 韓国
- ラテンアメリカ
- ブラジル
- メキシコ
- 中東・アフリカ
- サウジアラビア
- 南アフリカ
- アラブ首長国連邦
第7章 競合情勢
- 主要市場参入企業による最近の動向と影響分析
- 市場参入企業の分類
- Continental AG
- BorgWarner Inc.
- DENSO CORPORATION
- Analog Devices Inc.
- Murata Manufacturing Co., Ltd.,
- NXP Semiconductors (Freescale Semiconductor, Inc.)
- Infineon Technologies AG
- Panasonic Holdings Corporation
- Robert Bosch Manufacturing Solutions GmbH
- ZF Friedrichshafen AG (TRW automotive)
List of Tables
- Table 1 List of abbreviation
- Table 2 North America collision avoidance system market, by technology, 2017 - 2030 (USD Million)
- Table 3 North America collision avoidance system market, by application, 2017 - 2030 (USD Million)
- Table 4 North America collision avoidance system market, by region, 2017 to 2030 (USD Million)
- Table 5 U.S. collision avoidance system market, by technology, 2017 - 2030 (USD Million)
- Table 6 U.S. collision avoidance system market, by application, 2017 - 2030 (USD Million)
- Table 7 Canada collision avoidance system market, by technology, 2017 - 2030 (USD Million)
- Table 8 Canada collision avoidance system market, by application, 2017 - 2030 (USD Million)
- Table 9 Europe collision avoidance system market, by technology, 2017 - 2030 (USD Million)
- Table 10 Europe collision avoidance system market, by application, 2017 - 2030 (USD Million)
- Table 11 Europe collision avoidance system market, by region, 2017 to 2030 (USD Million)
- Table 12 Germany collision avoidance system market, by technology, 2017 - 2030 (USD Million)
- Table 13 Germany collision avoidance system market, by application, 2017 - 2030 (USD Million)
- Table 14 UK collision avoidance system market, by technology, 2017 - 2030 (USD Million)
- Table 15 UK collision avoidance system market, by application, 2017 - 2030 (USD Million)
- Table 16 France collision avoidance system market, by technology, 2017 - 2030 (USD Million)
- Table 17 France collision avoidance system market, by application, 2017 - 2030 (USD Million)
- Table 18 Asia Pacific collision avoidance system market, by technology, 2017 - 2030 (USD Million)
- Table 19 Asia Pacific collision avoidance system market, by application, 2017 - 2030 (USD Million)
- Table 20 Asia Pacific collision avoidance system market, by region, 2017 to 2030 (USD Million)
- Table 21 China collision avoidance system market, by technology, 2017 - 2030 (USD Million)
- Table 22 China collision avoidance system market, by application, 2017 - 2030 (USD Million)
- Table 23 Japan collision avoidance system market, by technology, 2017 - 2030 (USD Million)
- Table 24 Japan collision avoidance system market, by application, 2017 - 2030 (USD Million)
- Table 25 India collision avoidance system market, by technology, 2017 - 2030 (USD Million)
- Table 26 India collision avoidance system market, by application, 2017 - 2030 (USD Million)
- Table 27 Australia collision avoidance system market, by technology, 2017 - 2030 (USD Million)
- Table 28 Australia collision avoidance system market, by application, 2017 - 2030 (USD Million)
- Table 29 South Korea collision avoidance system market, by technology, 2017 - 2030 (USD Million)
- Table 30 South Korea collision avoidance system market, by application, 2017 - 2030 (USD Million)
- Table 31 Latin America collision avoidance system market, by technology, 2017 - 2030 (USD Million)
- Table 32 Latin America collision avoidance system market, by application, 2017 - 2030 (USD Million)
- Table 33 Latin America collision avoidance system market, by region, 2017 to 2030 (USD Million)
- Table 34 Brazil collision avoidance system market, by technology, 2017 - 2030 (USD Million)
- Table 35 Brazil collision avoidance system market, by application, 2017 - 2030 (USD Million)
- Table 36 Mexico collision avoidance system market, by technology, 2017 - 2030 (USD Million)
- Table 37 Mexico collision avoidance system market, by application, 2017 - 2030 (USD Million)
- Table 38 Middle East and Africa collision avoidance system market, by technology, 2017 - 2030 (USD Million)
- Table 39 Middle East and Africa collision avoidance system market, by application, 2017 - 2030 (USD Million)
- Table 40 Middle East and Africa collision avoidance system market, by region, 2017 to 2030 (USD Million)
- Table 41 South Africa collision avoidance system market, by technology, 2017 - 2030 (USD Million)
- Table 42 South Africa collision avoidance system market, by application, 2017 - 2030 (USD Million)
- Table 43 Saudi Arabia collision avoidance system market, by technology, 2017 - 2030 (USD Million)
- Table 44 Saudi Arabia collision avoidance system market, by application, 2017 - 2030 (USD Million)
- Table 45 UAE collision avoidance system market, by technology, 2017 - 2030 (USD Million)
- Table 46 UAE collision avoidance system market, by application, 2017 - 2030 (USD Million)
List of Figure
Fig. 1 Market research process
Fig. 2 Data triangulation techniques
Fig. 3 Primary research pattern
Fig. 4 Market research approaches
Fig. 5 Value-chain-based sizing & forecasting
Fig. 6 QFD modeling for market share assessment
Fig. 7 Market formulation & validation
Fig. 8 Collision avoidance system: Market outlook
Fig. 9 Collision avoidance system: Competitive insights
Fig. 10 Parent market outlook
Fig. 11 Related/ancillary market outlook
Fig. 12 Penetration and growth prospect mapping
Fig. 13 Industry value chain analysis
Fig. 14 Collision avoidance system market driver impact
Fig. 15 Collision avoidance system market restraint impact
Fig. 16 Collision avoidance system market strategic initiatives analysis
Fig. 17 Collision avoidance system market: Technology movement analysis
Fig. 18 Collision avoidance system market: Technology outlook and key takeaways
Fig. 19 Radar market estimates and forecasts, 2017 - 2030
Fig. 20 Camera market estimates and forecasts, 2017 - 2030
Fig. 21 Ultrasound market estimates and forecasts, 2017 - 2030
Fig. 22 LiDAR market estimates and forecasts, 2017 - 2030
Fig. 23 Collision avoidance system market: Application movement analysis
Fig. 24 Collision avoidance system market: Application outlook and key takeaways
Fig. 25 Adaptive cruise control (ACC) market estimates and forecasts, 2017 - 2030
Fig. 26 Blind spot detection (BSD) market estimates and forecasts, 2017 - 2030
Fig. 27 Forward collision warning system (FCWS) market estimates and forecasts, 2017 - 2030
Fig. 28 Lane departure warning system (LDWS) market estimates and forecasts, 2017 - 2030
Fig. 29 Parking assistance market estimates and forecasts, 2017 - 2030
Fig. 30 Others market estimates and forecasts, 2017 - 2030
Fig. 31 Global collision avoidance system market: Regional movement analysis
Fig. 32 Global collision avoidance system market: Regional outlook and key takeaways
Fig. 33 North America market estimates and forecasts, 2017 - 2030
Fig. 34 U.S. market estimates and forecasts, 2017 - 2030
Fig. 35 Canada market estimates and forecasts, 2017 - 2030
Fig. 36 Europe market estimates and forecasts, 2017 - 2030
Fig. 37 UK market estimates and forecasts, 2017 - 2030
Fig. 38 Germany market estimates and forecasts, 2017 - 2030
Fig. 39 France market estimates and forecasts, 2017 - 2030
Fig. 40 Asia Pacific market estimates and forecasts, 2017 - 2030
Fig. 41 Japan market estimates and forecasts, 2017 - 2030
Fig. 42 China market estimates and forecasts, 2017 - 2030
Fig. 43 India market estimates and forecasts, 2017 - 2030
Fig. 44 Australia market estimates and forecasts, 2017 - 2030
Fig. 45 South Korea market estimates and forecasts, 2017 - 2030
Fig. 46 Latin America market estimates and forecasts, 2017 - 2030
Fig. 47 Brazil market estimates and forecasts, 2017 - 2030
Fig. 48 Mexico market estimates and forecasts, 2017 - 2030
Fig. 49 Middle East and Africa market estimates and forecasts, 2017 - 2030
Fig. 50 Saudi Arabia market estimates and forecasts, 2017 - 2030
Fig. 51 South Africa market estimates and forecasts, 2017 - 2030
Fig. 52 UAE market estimates and forecasts, 2017 - 2030
Collision Avoidance System Market Growth & Trends:
The global collision avoidance system market size is expected to reach USD 157.47 billion by 2030, expanding at a CAGR of 11.4% from 2023 to 2030, according to a new report by Grand View Research, Inc.. The updated ratings of safety agencies and incorporation of anti-collision systems in mass-market models are expected to propel the market growth over the next six years.
The increasing awareness among consumers and extensive R&D by market players have fueled the market growth. Collision avoidance systems enable vehicles to carry out semi-autonomous and autonomous decision-making. The rising need for security from consumers and governments is also expected to drive the collision avoidance systems market growth.
The recent developments in the sensor technology are oriented toward making highly sophisticated devices and augmenting them with various parts of an automobile. Anti-collision systems enable automotive OEMs to integrate additional intelligence to achieve the goal of an autonomous car.
Strict legal and regulatory standards have mandated the inclusion of sensors in motor vehicles. This is further estimated to drive the collision avoidance systems market. However, the high costs of long-range radars and LiDAR-based systems may restrain the market growth as low-price carmakers may abstain from adding onto the cost of vehicles.
Collision Avoidance System Market Report Highlights:
- The radar segment held a significant market share of 43.3% in 2022. The segment is further expected to gain market share over the forecast period.
- The reducing prices of radars have led to the increased adoption of the technology by various automotive OEMs
- Camera-based collision avoidance systems are expected to witness high growth, owing to the government regulations mandating their incorporation into vehicles
- Adaptive cruise control accounted for a major market share in 2022. Such systems rely on long-range and medium and short-range radar systems to automatically adjust a vehicle's speed.
- Technological innovations may mandate the incorporation of systems in vehicles to counter the threat of accidents due to human errors, which account for 90% of accidents, according to a 2014 UN Road Safety Collaboration study
- Europe is expected to continue to lead the market over the forecast period. It accounted for over 33.0% of the market in 2022.
- The key industry participants include Bosch, Continental, Delphi, Denso, Autoliv, and TRW, among others
Table of Contents
Chapter 1. Methodology and Scope
- 1.1. Market Segmentation & Scope
- 1.1.1. Technology
- 1.1.2. Application
- 1.1.3. Regional scope
- 1.1.4. Estimates and forecast timeline
- 1.2. Research Methodology
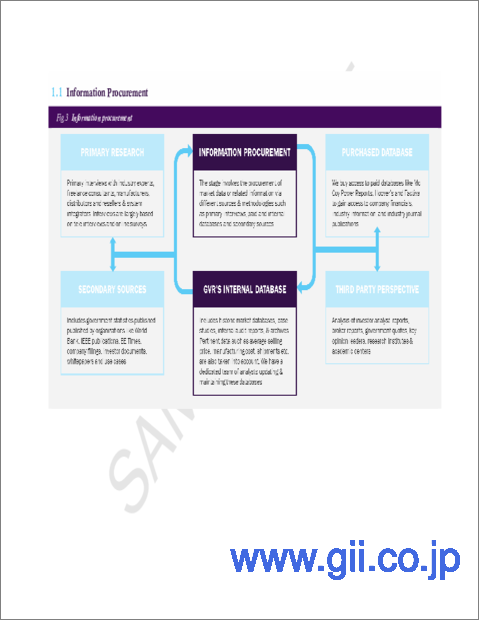
- 1.3. Information Procurement
- 1.3.1. Purchased database
- 1.3.2. GVR's internal database
- 1.3.3. Secondary sources
- 1.3.4. Primary research
- 1.3.5. Details of primary research
- 1.4. Information or Data Analysis
- 1.5. Market Formulation & Validation
- 1.6. Model Details
- 1.7. List of Secondary Sources
- 1.8. List of Primary Sources
- 1.9. Objectives
Chapter 2. Executive Summary
- 2.1. Market Outlook
- 2.2. Segment Outlook
- 2.2.1. Technology outlook
- 2.2.2. Application outlook
- 2.2.3. Regional outlook
- 2.3. Competitive Insights
Chapter 3. Collision Avoidance System Market Variables, Trends & Scope
- 3.1. Market Lineage Outlook
- 3.2. Industry Value Chain Analysis
- 3.3. Market Dynamics
- 3.3.1. Market driver analysis
- 3.3.2. Market restraint analysis
- 3.3.3. Market opportunity analysis
- 3.4. Collision Avoidance System Market Analysis Tools
- 3.4.1. Industry Analysis - Porter's
- 3.4.1.1. Supplier power
- 3.4.1.2. Buyer power
- 3.4.1.3. Substitution threat
- 3.4.1.4. Threat of new entrant
- 3.4.1.5. Competitive rivalry
- 3.4.2. PESTEL Analysis
- 3.4.2.1. Political landscape
- 3.4.2.2. Technological landscape
- 3.4.2.3. Economic landscape
- 3.4.1. Industry Analysis - Porter's
Chapter 4. Collision Avoidance System Market: Technology Estimates & Trend Analysis
- 4.1. Collision Avoidance System Market: Key Takeaways
- 4.2. Collision Avoidance System Market: Movement & Market Share Analysis, 2022 & 2030
- 4.3. Radar
- 4.3.1. Radar market estimates and forecasts, 2017 to 2030 (USD Million)
- 4.4. Camera
- 4.4.1. Camera market estimates and forecasts, 2017 to 2030 (USD Million)
- 4.5. Ultrasound
- 4.5.1. Ultrasound market estimates and forecasts, 2017 to 2030 (USD Million)
- 4.6. LiDAR
- 4.6.1. LiDAR market estimates and forecasts, 2017 to 2030 (USD Million)
Chapter 5. Collision Avoidance System Market: Application Estimates & Trend Analysis
- 5.1. Collision Avoidance System Market: Key Takeaways
- 5.2. Collision Avoidance System Market: Movement & Market Share Analysis, 2022 & 2030
- 5.3. Education
- 5.3.1. Education market estimates and forecasts, 2017 to 2030 (USD Million)
- 5.4. Business
- 5.4.1. Business market estimates and forecasts, 2017 to 2030 (USD Million)
- 5.5. Healthcare
- 5.5.1. Healthcare market estimates and forecasts, 2017 to 2030 (USD Million)
- 5.6. Other
- 5.6.1. Other market estimates and forecasts, 2017 to 2030 (USD Million)
Chapter 6. Collision Avoidance System Market: Regional Estimates & Trend Analysis
- 6.1. Regional Outlook
- 6.2. Collision Avoidance System Market by Region: Key Takeaway
- 6.3. North America
- 6.3.1. Market estimates and forecasts, 2017 to 2030 (Revenue, USD Million)
- 6.3.2. U.S.
- 6.3.2.1. Market estimates and forecasts, 2017 to 2030 (Revenue, USD Million)
- 6.3.3. Canada
- 6.3.3.1. Market estimates and forecasts, 2017 to 2030 (Revenue, USD Million)
- 6.4. Europe
- 6.4.1. UK
- 6.4.1.1. Market estimates and forecasts, 2017 to 2030 (Revenue, USD Million)
- 6.4.2. Germany
- 6.4.2.1. Market estimates and forecasts, 2017 to 2030 (Revenue, USD Million)
- 6.4.3. France
- 6.4.3.1. Market estimates and forecasts, 2017 to 2030 (Revenue, USD Million)
- 6.4.1. UK
- 6.5. Asia Pacific
- 6.5.1. Japan
- 6.5.1.1. Market estimates and forecasts, 2017 to 2030 (Revenue, USD Million)
- 6.5.2. China
- 6.5.2.1. Market estimates and forecasts, 2017 to 2030 (Revenue, USD Million)
- 6.5.3. India
- 6.5.3.1. Market estimates and forecasts, 2017 to 2030 (Revenue, USD Million)
- 6.5.4. Australia
- 6.5.4.1. Market estimates and forecasts, 2017 to 2030 (Revenue, USD Million)
- 6.5.5. South Korea
- 6.5.5.1. Market estimates and forecasts, 2017 to 2030 (Revenue, USD Million)
- 6.5.1. Japan
- 6.6. Latin America
- 6.6.1. Brazil
- 6.6.1.1. Market estimates and forecasts, 2017 to 2030 (Revenue, USD Million)
- 6.6.2. Mexico
- 6.6.2.1. Market estimates and forecasts, 2017 to 2030 (Revenue, USD Million)
- 6.6.1. Brazil
- 6.7. MEA
- 6.7.1. Saudi Arabia
- 6.7.1.1. Market estimates and forecasts, 2017 to 2030 (Revenue, USD Million)
- 6.7.2. South Africa
- 6.7.2.1. Market estimates and forecasts, 2017 to 2030 (Revenue, USD Million)
- 6.7.3. UAE
- 6.7.3.1. Market estimates and forecasts, 2017 to 2030 (Revenue, USD Million)
- 6.7.1. Saudi Arabia
Chapter 7. Competitive Landscape
- 7.1. Recent Developments & Impact Analysis, By Key Market Participants
- 7.2. Market Participant Categorization
- 7.2.1. Continental AG
- 7.2.1.1. Company overview
- 7.2.1.2. Financial performance
- 7.2.1.3. Product benchmarking
- 7.2.1.4. Strategic initiatives
- 7.2.2. BorgWarner Inc.
- 7.2.2.1. Company overview
- 7.2.2.2. Financial performance
- 7.2.2.3. Product benchmarking
- 7.2.2.4. Strategic initiatives
- 7.2.3. DENSO CORPORATION
- 7.2.3.1. Company overview
- 7.2.3.2. Financial performance
- 7.2.3.3. Product benchmarking
- 7.2.3.4. Strategic initiatives
- 7.2.4. Analog Devices Inc.
- 7.2.4.1. Company overview
- 7.2.4.2. Financial performance
- 7.2.4.3. Product benchmarking
- 7.2.4.4. Strategic initiatives
- 7.2.5. Murata Manufacturing Co., Ltd.,
- 7.2.5.1. Company overview
- 7.2.5.2. Financial performance
- 7.2.5.3. Product benchmarking
- 7.2.5.4. Strategic initiatives
- 7.2.6. NXP Semiconductors (Freescale Semiconductor, Inc.)
- 7.2.6.1. Company overview
- 7.2.6.2. Financial performance
- 7.2.6.3. Product benchmarking
- 7.2.6.4. Strategic initiatives
- 7.2.7. Infineon Technologies AG
- 7.2.7.1. Company overview
- 7.2.7.2. Financial performance
- 7.2.7.3. Product benchmarking
- 7.2.7.4. Strategic initiatives
- 7.2.8. Panasonic Holdings Corporation
- 7.2.8.1. Company overview
- 7.2.8.2. Financial performance
- 7.2.8.3. Product benchmarking
- 7.2.8.4. Strategic initiatives
- 7.2.9. Robert Bosch Manufacturing Solutions GmbH
- 7.2.9.1. Company overview
- 7.2.9.2. Financial performance
- 7.2.9.3. Product benchmarking
- 7.2.9.4. Strategic initiatives
- 7.2.10. ZF Friedrichshafen AG (TRW automotive)
- 7.2.10.1. Company overview
- 7.2.10.2. Financial performance
- 7.2.10.3. Product benchmarking
- 7.2.10.4. Strategic initiatives
- 7.2.1. Continental AG
