|
|
市場調査レポート
商品コード
1375995
プライマリケアPOC診断の市場規模、シェア、動向分析レポート:製品別、最終用途別、地域別、セグメント予測、2023年~2030年Primary Care POC Diagnostics Market Size, Share & Trends Analysis Report By Product (Glucose Testing, Lipid Testing, Drug Abuse Testing), By End-use (Pharmacy & Retail Clinics, Physician Office), By Region, And Segment Forecasts, 2023 - 2030 |
||||||
|
|
|||||||
|
● お客様のご希望に応じて、既存データの加工や未掲載情報(例:国別セグメント)の追加などの対応が可能です。 詳細はお問い合わせください。 |
|||||||


| プライマリケアPOC診断の市場規模、シェア、動向分析レポート:製品別、最終用途別、地域別、セグメント予測、2023年~2030年 |
|
出版日: 2023年10月23日
発行: Grand View Research
ページ情報: 英文 192 Pages
納期: 2~10営業日
|
- 全表示
- 概要
- 図表
- 目次
プライマリケアPOC診断市場の成長と動向:
Grand View Research, Inc.の最新レポートによると、プライマリケアPOC診断の世界市場規模は2030年までに261億7,000万米ドルに達し、予測期間中のCAGRは6.5%を記録すると予測されています。
柔軟で先進的な中核分子ラボは、多くの一般的なターゲットのスクリーニングを病院のレセプションルームや医師のオフィスに移すために、POC検査の使用を受け入れ、サポートしています。
2014年にAmerican Journal of Clinical Pathologyが実施した研究によると、POC検査は、患者のフォローアップコールと手紙をそれぞれ85.0%と89.0%削減し、フォローアップ訪問を61.0%削減することにより、製造業者の臨床業務を改善することが判明しました。また、検査オーダー数は21.0%減少しました。
さらに、1988年臨床検査改善法(CLIA)の下で免除ステータスを受ける検査数の増加が、市場の成長を促進すると予想されます。患者1人当たり約12~15米ドルのコスト削減と約50.0%のフォローアップ検査削減により、調査機関やメーカーはますますこれらの検査を推奨するようになっています。しかし、異なる検査法とその使用領域には大きな重複があります。例えば、グルコース測定パネルや迅速国際標準化比検査は、元々は自己検査用であったが、現在では病院やプライマリー環境で使用されています。
プライマリケアPOC診断市場レポートハイライト
- 2022年には感染症分野が26.4%で最大の市場シェアを占めたが、これは感染症の流行の増加、迅速かつ正確な診断に対する需要、POC検査の利点に対する認識の高まりによるものです。
- 定期検診の一環として脂質検査を行う外来診療の増加は、市場における脂質検査の採用率を積極的に高め、製品別市場全体において突出した地位を与えることが予想されます。
- 最終用途に関しては、研究機関やバイオテクノロジー企業による先進的でより正確なPOC検査キットの共同調査が医師の診療所セグメントを促進する可能性が高い一方、政府のイニシアティブやプライマリケア施設を拡張するプロジェクトが診療所以外の診療所セグメントを押し上げると思われます。
- 北米のプライマリケアPOC診断市場は、世界のその他の地域よりも発展しています。同地域は、革新的で先進的なPOC診断製品が複数提供されていること、プライマリーホームヘルスケアや補助医療におけるPOC診断に対する認識と需要が高まっていることが背景にあります。
- 米国市場では、在宅医療、在宅検査、モニタリング機器への患者の関与が増加しています。さらに、米国ではデジタル化、EHR、遠隔医療、モニタリングデータのウェブ対応ソリューションが加速しており、成長を牽引しています。
目次
第1章 調査手法と範囲
第2章 エグゼクティブサマリー
第3章 プライマリケアPOC診断市場の変数、動向および範囲
- 市場系統の見通し
- 親市場の見通し
- 関連/付随市場の見通し
- 普及と成長の見通しマッピング
- 市場力学
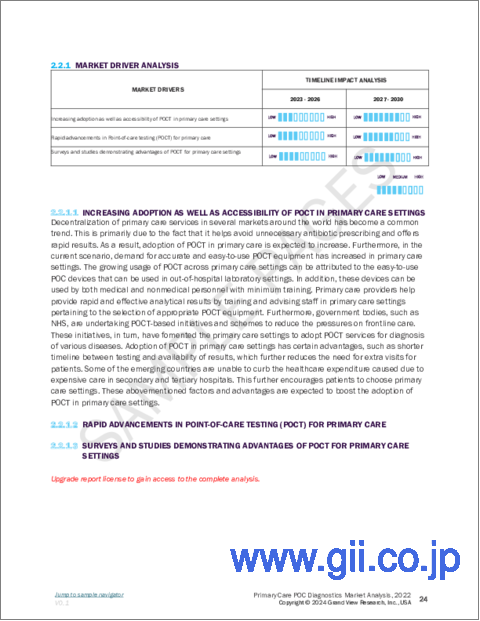
- 市場促進要因分析
- 市場抑制要因分析
- プライマリケアPOC診断市場分析ツール
- 業界分析- ポーターのファイブフォース分析
- PESTEL分析
第4章 プライマリケアPOC診断:製品の推定・動向分析
- プライマリケアPOC診断市場:重要なポイント
- プライマリケアPOC診断市場:動向と市場シェア分析、2022年および2030年
- グルコース検査
- グルコース検査市場推計・予測、2018年から2030年まで
- Hb1Ac検査
- Hb1Ac検査市場推計・予測、2018年から2030年まで
- 自己免疫疾患
- 自己免疫疾患市場推計・予測、2018年から2030年まで
- 凝固
- 凝固市場推計・予測、2018年から2030年まで
- 受胎能力
- 不妊市場推計・予測、2018年から2030年まで
- 感染症
- 感染症市場推計・予測、2018年から2030年まで
- 心臓マーカー
- 心臓マーカー市場推計・予測、2018年から2030年まで
- 甲状腺刺激ホルモン
- 甲状腺刺激ホルモン市場推計・予測、2018年から2030年まで
- 血液学
- 血液学市場推計・予測、2018年から2030年まで
- プライマリケアシステム
- プライマリケアシステム市場推計・予測、2018年から2030年まで
- 分散型臨床化学
- 分散型臨床化学市場推計・予測、2018年から2030年まで
- 糞便
- 糞便市場推計・予測、2018年から2030年まで
- 脂質検査
- 脂質検査市場推計・予測、2018年から2030年まで
- がんマーカー
- がんマーカー市場推計・予測、2018年から2030年まで
- 血液ガス/電解質
- 血液ガス/電解質市場推計・予測、2018年から2030年まで
- 外来化学
- 外来化学市場推計・予測、2018年から2030年まで
- 薬物乱用検査
- 薬物乱用検査市場推計・予測、2018年から2030年まで
- 尿検査
- 尿検査市場推計・予測、2018年から2030年まで
第5章 プライマリケアPOC診断:最終用途の推定・動向分析
- プライマリケアPOC診断市場:重要なポイント
- プライマリケアPOC診断市場:動向と市場シェア分析、2022年および2030年
- 薬局および小売クリニック
- 診療所
- 救急診療クリニック
- 非診療クリニック
第6章 プライマリケアPOC診断市場:地域の推定・動向分析
- 地域別の見通し
- 地域別のプライマリケアPOC診断市場:主要マーケットプレースのポイント
- 北米
- 市場推計・予測、2018~2030年
- 米国
- カナダ
- 欧州
- 英国
- ドイツ
- フランス
- イタリア
- スペイン
- スウェーデン
- ノルウェー
- デンマーク
- アジア太平洋地域
- 日本
- 中国
- インド
- オーストラリア
- タイ
- 韓国
- ラテンアメリカ
- ブラジル
- メキシコ
- アルゼンチン
- 中東・アフリカ
- サウジアラビア
- 南アフリカ
- アラブ首長国連邦
- クウェート
第7章 競合情勢
- 主要市場参入企業による最近の動向と影響分析
- 市場参入企業の分類
- F Hoffmann-La Roche Ltd.
- Danaher
- Abbott
- Siemens Healthineers
- bioMerieux SA
- Abaxis
- QIAGEN
- Johnson & Johnson Services, Inc.
- Nova Biomedical
- Instrumentation Laboratory
- Trividia Health, Inc.
- OraSure Technologies, Inc.
- Quidel Corporation
- Trinity Biotech
- Sekisui Diagnostics
- BD
List of Tables
- Table 1 List of Abbreviation
- Table 2 North America primary care POC diagnostics market, by product, 2018 - 2030 (USD Million)
- Table 3 North America primary care POC diagnostics market, by end use, 2018 - 2030 (USD Million)
- Table 4 North America primary care POC diagnostics market, by region, 2018 - 2030 (USD Million)
- Table 5 U.S. primary care POC diagnostics market, by product, 2018 - 2030 (USD Million)
- Table 6 U.S. primary care POC diagnostics market, by end use, 2018 - 2030 (USD Million)
- Table 7 Canada primary care POC diagnostics market, by product, 2018 - 2030 (USD Million)
- Table 8 Canada primary care POC diagnostics market, by end use, 2018 - 2030 (USD Million)
- Table 9 Europe primary care POC diagnostics market, by product, 2018 - 2030 (USD Million)
- Table 10 Europe primary care POC diagnostics market, by end use, 2018 - 2030 (USD Million)
- Table 11 Europe primary care POC diagnostics market, by region, 2018 - 2030 (USD Million)
- Table 12 Germany primary care POC diagnostics market, by product, 2018 - 2030 (USD Million)
- Table 13 Germany primary care POC diagnostics market, by end use, 2018 - 2030 (USD Million)
- Table 14 UK primary care POC diagnostics market, by product, 2018 - 2030 (USD Million)
- Table 15 UK primary care POC diagnostics market, by end use, 2018 - 2030 (USD Million)
- Table 16 France primary care POC diagnostics market, by product, 2018 - 2030 (USD Million)
- Table 17 France primary care POC diagnostics market, by end use, 2018 - 2030 (USD Million)
- Table 18 Italy primary care POC diagnostics market, by product, 2018 - 2030 (USD Million)
- Table 19 Italy primary care POC diagnostics market, by end use, 2018 - 2030 (USD Million)
- Table 20 Spain primary care POC diagnostics market, by product, 2018 - 2030 (USD Million)
- Table 21 Spain primary care POC diagnostics market, by end use, 2018 - 2030 (USD Million)
- Table 22 Sweden primary care POC diagnostics market, by product, 2018 - 2030 (USD Million)
- Table 23 Sweden primary care POC diagnostics market, by end use, 2018 - 2030 (USD Million)
- Table 24 Norway primary care POC diagnostics market, by product, 2018 - 2030 (USD Million)
- Table 25 Norway primary care POC diagnostics market, by end use, 2018 - 2030 (USD Million)
- Table 26 Denmark primary care POC diagnostics market, by product, 2018 - 2030 (USD Million)
- Table 27 Denmark primary care POC diagnostics market, by end use, 2018 - 2030 (USD Million)
- Table 28 Asia Pacific primary care POC diagnostics market, by product, 2018 - 2030 (USD Million)
- Table 29 Asia Pacific primary care POC diagnostics market, by end use, 2018 - 2030 (USD Million)
- Table 30 Asia Pacific primary care POC diagnostics market, by region, 2018 - 2030 (USD Million)
- Table 31 China primary care POC diagnostics market, by product, 2018 - 2030 (USD Million)
- Table 32 China primary care POC diagnostics market, by end use, 2018 - 2030 (USD Million)
- Table 33 Japan primary care POC diagnostics market, by product, 2018 - 2030 (USD Million)
- Table 34 Japan primary care POC diagnostics market, by end use, 2018 - 2030 (USD Million)
- Table 35 India primary care POC diagnostics market, by product, 2018 - 2030 (USD Million)
- Table 36 India primary care POC diagnostics market, by end use, 2018 - 2030 (USD Million)
- Table 37 Australia primary care POC diagnostics market, by product, 2018 - 2030 (USD Million)
- Table 38 Australia primary care POC diagnostics market, by end use, 2018 - 2030 (USD Million)
- Table 39 Thailand primary care POC diagnostics market, by product, 2018 - 2030 (USD Million)
- Table 40 Thailand primary care POC diagnostics market, by end use, 2018 - 2030 (USD Million)
- Table 41 South Korea primary care POC diagnostics market, by product, 2018 - 2030 (USD Million)
- Table 42 South Korea primary care POC diagnostics market, by end use, 2018 - 2030 (USD Million)
- Table 43 Latin America primary care POC diagnostics market, by product, 2018 - 2030 (USD Million)
- Table 44 Latin America primary care POC diagnostics market, by end use, 2018 - 2030 (USD Million)
- Table 45 Latin America primary care POC diagnostics market, by region, 2018 - 2030 (USD Million)
- Table 46 Brazil primary care POC diagnostics market, by product, 2018 - 2030 (USD Million)
- Table 47 Brazil primary care POC diagnostics market, by end use, 2018 - 2030 (USD Million)
- Table 48 Mexico primary care POC diagnostics market, by product, 2018 - 2030 (USD Million)
- Table 49 Mexico primary care POC diagnostics market, by end use, 2018 - 2030 (USD Million)
- Table 50 Argentina primary care POC diagnostics market, by product, 2018 - 2030 (USD Million)
- Table 51 Argentina primary care POC diagnostics market, by end use, 2018 - 2030 (USD Million)
- Table 52 Middle East and Africa primary care POC diagnostics market, by product, 2018 - 2030 (USD Million)
- Table 53 Middle East and Africa primary care POC diagnostics market, by end use, 2018 - 2030 (USD Million)
- Table 54 Middle East and Africa primary care POC diagnostics market, by region, 2018 - 2030 (USD Million)
- Table 55 South Africa primary care POC diagnostics market, by product, 2018 - 2030 (USD Million)
- Table 56 South Africa primary care POC diagnostics market, by end use, 2018 - 2030 (USD Million)
- Table 57 Saudi Arabia primary care POC diagnostics market, by product, 2018 - 2030 (USD Million)
- Table 58 Saudi Arabia primary care POC diagnostics market, by end use, 2018 - 2030 (USD Million)
- Table 59 UAE primary care POC diagnostics market, by product, 2018 - 2030 (USD Million)
- Table 60 UAE primary care POC diagnostics market, by end use, 2018 - 2030 (USD Million)
- Table 61 Kuwait primary care POC diagnostics market, by product, 2018 - 2030 (USD Million)
- Table 62 Kuwait primary care POC diagnostics market, by end use, 2018 - 2030 (USD Million)
List of Figures
- Fig. 1 Market research process
- Fig. 2 Data triangulation techniques
- Fig. 3 Primary research pattern
- Fig. 4 Market research approaches
- Fig. 5 Value-chain-based sizing & forecasting
- Fig. 6 QFD modeling for market share assessment
- Fig. 7 Market formulation & validation
- Fig. 8 Primary care POC diagnostics: Market outlook
- Fig. 9 Primary care POC diagnostics: Competitive insights
- Fig. 10 Parent market outlook
- Fig. 11 Related/ancillary market outlook
- Fig. 12 Penetration and growth prospect mapping
- Fig. 13 Industry value chain analysis
- Fig. 14 Primary care POC diagnostics market driver impact
- Fig. 15 Primary care POC diagnostics market restraint impact
- Fig. 16 Primary care POC diagnostics market strategic initiatives analysis
- Fig. 17 Primary care POC diagnostics market: Product movement analysis
- Fig. 18 Primary care POC diagnostics market: Product outlook and key takeaways
- Fig. 19 Glucose testing market estimates and forecasts, 2018 - 2030 (USD Million)
- Fig. 20 Hb1Ac testing market estimates and forecasts, 2018 - 2030 (USD Million)
- Fig. 21 Autoimmune disease market estimates and forecasts, 2018 - 2030 (USD Million)
- Fig. 22 Coagulation market estimates and forecasts, 2018 - 2030 (USD Million)
- Fig. 23 Fertility market estimates and forecasts, 2018 - 2030 (USD Million)
- Fig. 24 Infectious diseases market estimates and forecasts, 2018 - 2030 (USD Million)
- Fig. 25 Cardiac markers market estimates and forecasts, 2018 - 2030 (USD Million)
- Fig. 26 Thyroid stimulating hormone market estimates and forecasts, 2018 - 2030 (USD Million)
- Fig. 27 Hematology market estimates and forecasts, 2018 - 2030 (USD Million)
- Fig. 28 Primary care systems market estimates and forecasts, 2018 - 2030 (USD Million)
- Fig. 29 Decentralized clinical chemistry market estimates and forecasts, 2018 - 2030 (USD Million)
- Fig. 30 Feces market estimates and forecasts, 2018 - 2030 (USD Million)
- Fig. 31 Lipid testing market estimates and forecasts, 2018 - 2030 (USD Million)
- Fig. 32 Cancer Marker market estimates and forecasts, 2018 - 2030 (USD Million)
- Fig. 33 Blood gas/electrolytes market estimates and forecasts, 2018 - 2030 (USD Million)
- Fig. 34 Ambulatory chemistry market estimates and forecasts, 2018 - 2030 (USD Million)
- Fig. 35 Drug abuse testing market estimates and forecasts, 2018 - 2030 (USD Million)
- Fig. 36 Urinalysis market estimates and forecasts, 2018 - 2030 (USD Million)
- Fig. 37 Primary care POC diagnostics market: End use movement analysis
- Fig. 38 Primary care POC diagnostics market: End use outlook and key takeaways
- Fig. 39 Pharmacy & retail clinics market estimates and forecasts, 2018 - 2030 (USD Million)
- Fig. 40 Physician office market estimates and forecasts, 2018 - 2030 (USD Million)
- Fig. 41 Urgent care clinics market estimates and forecasts, 2018 - 2030 (USD Million)
- Fig. 42 Non-practice clinics market estimates and forecasts, 2018 - 2030 (USD Million)
- Fig. 43 Global primary care POC diagnostics market: Regional movement analysis
- Fig. 44 Global primary care POC diagnostics market: Regional outlook and key takeaways
- Fig. 45 North America market estimates and forecasts, 2018 - 2030 (USD Million)
- Fig. 46 U.S. market estimates and forecasts, 2018 - 2030 (USD Million)
- Fig. 47 Canada market estimates and forecasts, 2018 - 2030 (USD Million)
- Fig. 48 Europe market estimates and forecasts, 2018 - 2030 (USD Million)
- Fig. 49 UK market estimates and forecasts, 2018 - 2030 (USD Million)
- Fig. 50 Germany market estimates and forecasts, 2018 - 2030 (USD Million)
- Fig. 51 France market estimates and forecasts, 2018 - 2030 (USD Million)
- Fig. 52 Italy market estimates and forecasts, 2018 - 2030 (USD Million)
- Fig. 53 Spain market estimates and forecasts, 2018 - 2030 (USD Million)
- Fig. 54 Sweden market estimates and forecasts, 2018 - 2030 (USD Million)
- Fig. 55 Norway market estimates and forecasts, 2018 - 2030 (USD Million)
- Fig. 56 Denmark market estimates and forecasts, 2018 - 2030 (USD Million)
- Fig. 57 Asia Pacific market estimates and forecasts, 2018 - 2030 (USD Million)
- Fig. 58 Japan market estimates and forecasts, 2018 - 2030 (USD Million)
- Fig. 59 China market estimates and forecasts, 2018 - 2030 (USD Million)
- Fig. 60 India market estimates and forecasts, 2018 - 2030 (USD Million)
- Fig. 61 Australia market estimates and forecasts, 2018 - 2030 (USD Million)
- Fig. 62 Thailand market estimates and forecasts, 2018 - 2030 (USD Million)
- Fig. 63 South Korea market estimates and forecasts, 2018 - 2030 (USD Million)
- Fig. 64 Latin America market estimates and forecasts, 2018 - 2030 (USD Million)
- Fig. 65 Brazil market estimates and forecasts, 2018 - 2030 (USD Million)
- Fig. 66 Mexico market estimates and forecasts, 2018 - 2030 (USD Million)
- Fig. 67 Argentina market estimates and forecasts, 2018 - 2030 (USD Million)
- Fig. 68 Middle East and Africa. market estimates and forecasts, 2018 - 2030 (USD Million)
- Fig. 69 Saudi Arabia market estimates and forecasts, 2018 - 2030 (USD Million)
- Fig. 70 South Africa market estimates and forecasts, 2018 - 2030 (USD Million)
- Fig. 71 UAE market estimates and forecasts, 2018 - 2030 (USD Million)
- Fig. 72 Kuwait market estimates and forecasts, 2018 - 2030 (USD Million)
Primary Care POC Diagnostics Market Growth & Trends:
The global primary care POC diagnostics market size is expected to reach USD 26.17 billion by 2030, according to a new report by Grand View Research, Inc.., registering a 6.5% CAGR during the forecast period. Flexible and forward-thinking core molecular labs have been embracing and supporting the use of POC tests to move screening of many common targets to hospital receiving rooms and physicians' offices.
As per a study conducted by the American Journal of Clinical Pathology in 2014, it was found that POC testing improved clinical operations for manufacturers by reducing follow-up calls and letters of patients by 85.0% and 89.0%, respectively, and reducing their follow-up visits by 61.0%. It was also observed that the number of tests ordered decreased by 21.0%.
Furthermore, rise in the number of tests receiving a waived status under the Clinical Laboratory Improvement Amendments of 1988 (CLIA) is anticipated to aid market growth. Researchers and manufacturers are increasingly recommending these tests owing to cost reduction of about USD 12-15 per patient and reduction in follow up tests by about 50.0%. However, there is a massive overlap between different methods and their areas of usage. For instance, panels to measure glucose and quick international normalized ratio tests were originally meant for self-testing but are now used in hospitals and primary settings instead.
Primary Care POC Diagnostics Market Report Highlights:
- The infectious disease segment held the largest market share at 26.4% in 2022, owing to the increased prevalence of infectious diseases, demand for quick and precise diagnosis, and the growing awareness of the benefits of POC testing.
- Increase in out-patient practices for lipid testing as part of a routine checkup is expected to positively enhance the adoption rate of lipid testing in the market, giving it a prominent spot in the overall market by product
- In terms of end use, while collaborative research for advanced and more accurate POC testing kits by research institutes and biotech firms is likely to facilitate the physicians' office segment, government initiatives and projects to extend primary care facilities will boost the non-practice clinics segment
- The North America primary care POC diagnostics market is more developed compared to the rest of the world. The regional segment is fueled by availability of several innovative and advanced POC diagnostic products and growing awareness and demand for point-of-care diagnostics in primary home healthcare and assisted healthcare
- The U.S. market is witnessing a shift toward increasing patient involvement in home care, home-based tests, and monitoring instruments. In addition, digitalization, EHR, telemedicine, and web-enabled solutions of monitoring data are gaining pace in U.S., thereby driving its growth
Table of Contents
Chapter 1. Methodology and Scope
- 1.1. Market Segmentation & Scope
- 1.1.1. Product
- 1.1.2. End use
- 1.1.3. Regional scope
- 1.1.4. Estimates and forecast timeline
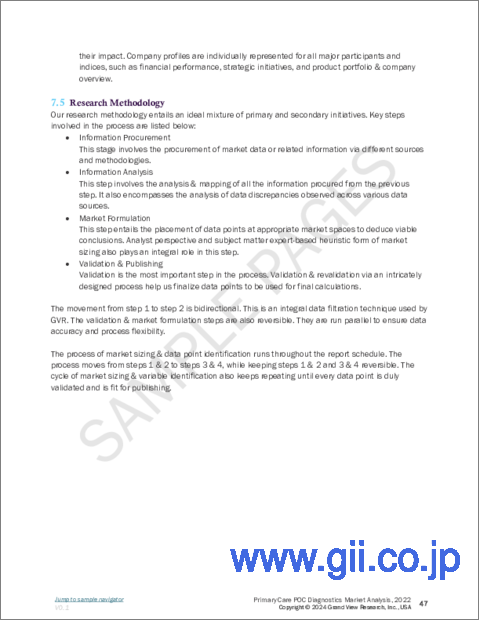
- 1.2. Research Methodology
- 1.3. Information Procurement
- 1.3.1. Purchased database
- 1.3.2. GVR's internal database
- 1.3.3. Secondary sources
- 1.3.4. Primary research
- 1.3.5. Details of primary research
- 1.4. Information or Data Analysis
- 1.5. Market Formulation & Validation
- 1.6. Model Details
- 1.7. List of Secondary Sources
- 1.8. List of Primary Sources
- 1.9. Objectives
Chapter 2. Executive Summary
- 2.1. Market Outlook
- 2.2. Segment Outlook
- 2.2.1. Product outlook
- 2.2.2. End use outlook
- 2.2.3. Regional outlook
- 2.3. Competitive Insights
Chapter 3. Primary Care POC Diagnostics Market Variables, Trends & Scope
- 3.1. Market Lineage Outlook
- 3.1.1. Parent market outlook
- 3.1.2. Related/ancillary market outlook
- 3.2. Penetration & Growth Prospect Mapping
- 3.3. Market Dynamics
- 3.3.1. Market driver analysis
- 3.3.2. Market restraint analysis
- 3.4. Primary Care POC Diagnostics Market Analysis Tools
- 3.4.1. Industry Analysis - Porter's
- 3.4.1.1. Supplier power
- 3.4.1.2. Buyer power
- 3.4.1.3. Substitution threat
- 3.4.1.4. Threat of new entrant
- 3.4.1.5. Competitive rivalry
- 3.4.2. PESTEL Analysis
- 3.4.2.1. Political landscape
- 3.4.2.2. Technological landscape
- 3.4.2.3. Economic landscape
- 3.4.1. Industry Analysis - Porter's
Chapter 4. Primary Care POC Diagnostics: Product Estimates & Trend Analysis
- 4.1. Primary Care POC Diagnostics Market: Key Takeaways
- 4.2. Primary Care POC Diagnostics Market: Movement & Market Share Analysis, 2022 & 2030
- 4.3. Glucose Testing
- 4.3.1. Glucose Testing market estimates and forecasts, 2018 to 2030 (USD Million)
- 4.4. Hb1Ac Testing
- 4.4.1. Hb1Ac testing market estimates and forecasts, 2018 to 2030 (USD Million)
- 4.5. 4.5. Autoimmune Disease
- 4.5.1. Autoimmune Disease market estimates and forecasts, 2018 to 2030 (USD Million)
- 4.6. Coagulation
- 4.6.1. Coagulation market estimates and forecasts, 2018 to 2030 (USD Million)
- 4.7. Fertility
- 4.7.1. Fertility market estimates and forecasts, 2018 to 2030 (USD Million)
- 4.8. Infectious Diseases
- 4.8.1. Infectious diseases market estimates and forecasts, 2018 to 2030 (USD Million)
- 4.9. Cardiac Markers
- 4.9.1. Cardiac markers market estimates and forecasts, 2018 to 2030 (USD Million)
- 4.10. Thyroid Stimulating Hormone
- 4.10.1. Thyroid stimulating hormone market estimates and forecasts, 2018 to 2030 (USD Million)
- 4.11. Hematology
- 4.11.1. Hematology market estimates and forecasts, 2018 to 2030 (USD Million)
- 4.12. Primary Care Systems
- 4.12.1. Primary care systems market estimates and forecasts, 2018 to 2030 (USD Million)
- 4.13. Decentralized Clinical Chemistry
- 4.13.1. Decentralized clinical chemistry market estimates and forecasts, 2018 to 2030 (USD Million)
- 4.14. Feces
- 4.14.1. Feces market estimates and forecasts, 2018 to 2030 (USD Million)
- 4.15. Lipid Testing
- 4.15.1. Lipid testing market estimates and forecasts, 2018 to 2030 (USD Million)
- 4.16. Cancer Markers
- 4.16.1. Cancer markers market estimates and forecasts, 2018 to 2030 (USD Million)
- 4.17. Blood Gas/Electrolytes
- 4.17.1. Blood gas/electrolytes market estimates and forecasts, 2018 to 2030 (USD Million)
- 4.18. Ambulatory Chemistry
- 4.18.1. Ambulatory chemistry market estimates and forecasts, 2018 to 2030 (USD Million)
- 4.19. Drug Abuse Testing
- 4.19.1. Drug abuse testing market estimates and forecasts, 2018 to 2030 (USD Million)
- 4.20. Urinalysis
- 4.20.1. Urinalysis market estimates and forecasts, 2018 to 2030 (USD Million)
Chapter 5. Primary Care POC Diagnostics: End Use Estimates & Trend Analysis
- 5.1. Primary Care POC Diagnostics Market: Key Takeaways
- 5.2. Primary Care POC Diagnostics Market: Movement & Market Share Analysis, 2022 & 2030
- 5.3. Pharmacy & Retail Clinics
- 5.3.1. Pharmacy & Retail Clinics market estimates and forecasts, 2018 to 2030 (USD Million)
- 5.4. Physician office
- 5.4.1. Physician office market estimates and forecasts, 2018 to 2030 (USD Million)
- 5.5. Urgent Care Clinics
- 5.5.1. Urgent care clinics market estimates and forecasts, 2018 to 2030 (USD Million)
- 5.6. Non-practice Clinics
- 5.6.1. Non-practice clinics market estimates and forecasts, 2018 to 2030 (USD Million)
Chapter 6. Primary Care POC Diagnostics Market: Regional Estimates & Trend Analysis
- 6.1. Regional Outlook
- 6.2. Primary Care POC Diagnostics Market by Region: Key Marketplace Takeaway
- 6.3. North America
- 6.3.1. Market estimates and forecasts, 2018 - 2030 (Revenue, USD Million)
- 6.3.2. U.S.
- 6.3.2.1. Market estimates and forecasts, 2018 - 2030 (Revenue, USD Million)
- 6.3.3. Canada
- 6.3.3.1. Market estimates and forecasts, 2018 - 2030 (Revenue, USD Million)
- 6.4. Europe
- 6.4.1. UK
- 6.4.1.1. Market estimates and forecasts, 2018 - 2030 (Revenue, USD Million)
- 6.4.2. Germany
- 6.4.2.1. Market estimates and forecasts, 2018 - 2030 (Revenue, USD Million)
- 6.4.3. France
- 6.4.3.1. Market estimates and forecasts, 2018 - 2030 (Revenue, USD Million)
- 6.4.4. Italy
- 6.4.4.1. Market estimates and forecasts, 2018 - 2030 (Revenue, USD Million)
- 6.4.5. Spain
- 6.4.5.1. Market estimates and forecasts, 2018 - 2030 (Revenue, USD Million)
- 6.4.6. Sweden
- 6.4.6.1. Market estimates and forecasts, 2018 - 2030 (Revenue, USD Million)
- 6.4.7. Norway
- 6.4.7.1. Market estimates and forecasts, 2018 - 2030 (Revenue, USD Million)
- 6.4.8. Denmark
- 6.4.8.1. Market estimates and forecasts, 2018 - 2030 (Revenue, USD Million)
- 6.4.1. UK
- 6.5. Asia Pacific
- 6.5.1. Japan
- 6.5.1.1. Market estimates and forecasts, 2018 - 2030 (Revenue, USD Million)
- 6.5.2. China
- 6.5.2.1. Market estimates and forecasts, 2018 - 2030 (Revenue, USD Million)
- 6.5.3. India
- 6.5.3.1. Market estimates and forecasts, 2018 - 2030 (Revenue, USD Million)
- 6.5.4. Australia
- 6.5.4.1. Market estimates and forecasts, 2018 - 2030 (Revenue, USD Million)
- 6.5.5. Thailand
- 6.5.5.1. Market estimates and forecasts, 2018 - 2030 (Revenue, USD Million)
- 6.5.6. South Korea
- 6.5.6.1. Market estimates and forecasts, 2018 - 2030 (Revenue, USD Million)
- 6.5.1. Japan
- 6.6. Latin America
- 6.6.1. Brazil
- 6.6.1.1. Market estimates and forecasts, 2018 - 2030 (Revenue, USD Million)
- 6.6.2. Mexico
- 6.6.2.1. Market estimates and forecasts, 2018 - 2030 (Revenue, USD Million)
- 6.6.3. Argentina
- 6.6.3.1. Market estimates and forecasts, 2018 - 2030 (Revenue, USD Million)
- 6.6.1. Brazil
- 6.7. MEA
- 6.7.1. Saudi Arabia
- 6.7.1.1. Market estimates and forecasts, 2018 - 2030 (Revenue, USD Million)
- 6.7.2. South Africa
- 6.7.2.1. Market estimates and forecasts, 2018 - 2030 (Revenue, USD Million)
- 6.7.3. UAE
- 6.7.3.1. Market estimates and forecasts, 2018 - 2030 (Revenue, USD Million)
- 6.7.4. Kuwait
- 6.7.4.1. Market estimates and forecasts, 2018 - 2030 (Revenue, USD Million)
- 6.7.1. Saudi Arabia
Chapter 7. Competitive Landscape
- 7.1. Recent Developments & Impact Analysis, By Key Market Participants
- 7.2. Market Participant Categorization
- 7.2.1. F Hoffmann-La Roche Ltd.
- 7.2.1.1. Company overview
- 7.2.1.2. Financial performance
- 7.2.1.3. Product benchmarking
- 7.2.1.4. Strategic initiatives
- 7.2.2. Danaher
- 7.2.2.1. Company overview
- 7.2.2.2. Financial performance
- 7.2.2.3. Product benchmarking
- 7.2.2.4. Strategic initiatives
- 7.2.3. Abbott
- 7.2.3.1. Company overview
- 7.2.3.2. Financial performance
- 7.2.3.3. Product benchmarking
- 7.2.3.4. Strategic initiatives
- 7.2.4. Siemens Healthineers
- 7.2.4.1. Company overview
- 7.2.4.2. Financial performance
- 7.2.4.3. Product benchmarking
- 7.2.4.4. Strategic initiatives
- 7.2.5. bioMerieux SA
- 7.2.5.1. Company overview
- 7.2.5.2. Financial performance
- 7.2.5.3. Product benchmarking
- 7.2.5.4. Strategic initiatives
- 7.2.6. Abaxis
- 7.2.6.1. Company overview
- 7.2.6.2. Financial performance
- 7.2.6.3. Product benchmarking
- 7.2.6.4. Strategic initiatives
- 7.2.7. QIAGEN
- 7.2.7.1. Company overview
- 7.2.7.2. Financial performance
- 7.2.7.3. Product benchmarking
- 7.2.7.4. Strategic initiatives
- 7.2.8. Johnson & Johnson Services, Inc.
- 7.2.8.1. Company overview
- 7.2.8.2. Financial performance
- 7.2.8.3. Product benchmarking
- 7.2.8.4. Strategic initiatives
- 7.2.9. Nova Biomedical
- 7.2.9.1. Company overview
- 7.2.9.2. Financial performance
- 7.2.9.3. Product benchmarking
- 7.2.9.4. Strategic initiatives
- 7.2.10. Instrumentation Laboratory
- 7.2.10.1. Company overview
- 7.2.10.2. Financial performance
- 7.2.10.3. Product benchmarking
- 7.2.10.4. Strategic initiatives
- 7.2.11. Trividia Health, Inc.
- 7.2.11.1. Company overview
- 7.2.11.2. Financial performance
- 7.2.11.3. Product benchmarking
- 7.2.11.4. Strategic initiatives
- 7.2.12. OraSure Technologies, Inc.
- 7.2.12.1. Company overview
- 7.2.12.2. Financial performance
- 7.2.12.3. Product benchmarking
- 7.2.12.4. Strategic initiatives
- 7.2.13. Quidel Corporation
- 7.2.13.1. Company overview
- 7.2.13.2. Financial performance
- 7.2.13.3. Product benchmarking
- 7.2.13.4. Strategic initiatives
- 7.2.14. Trinity Biotech
- 7.2.14.1. Company overview
- 7.2.14.2. Financial performance
- 7.2.14.3. Product benchmarking
- 7.2.14.4. Strategic initiatives
- 7.2.15. Sekisui Diagnostics
- 7.2.15.1. Company overview
- 7.2.15.2. Financial performance
- 7.2.15.3. Product benchmarking
- 7.2.15.4. Strategic initiatives
- 7.2.16. BD
- 7.2.16.1. Company overview
- 7.2.16.2. Financial performance
- 7.2.16.3. Product benchmarking
- 7.2.16.4. Strategic initiatives
- 7.2.1. F Hoffmann-La Roche Ltd.