|
|
市場調査レポート
商品コード
1375960
カルナバワックスの市場規模、シェア、動向分析レポート:製品別、用途別、地域別、セグメント予測、2023年~2030年Carnauba Wax Market Size, Share & Trends Analysis Report By Product (Type 1, Type 3, Type 4), By Application (Cosmetics, Food, Automotive, Pharmaceutical), By Region, And Segment Forecasts, 2023 - 2030 |
||||||
|
|
|||||||
カスタマイズ可能
|
|||||||


| カルナバワックスの市場規模、シェア、動向分析レポート:製品別、用途別、地域別、セグメント予測、2023年~2030年 |
|
出版日: 2023年10月17日
発行: Grand View Research
ページ情報: 英文 89 Pages
納期: 2~10営業日
|

- 全表示
- 概要
- 図表
- 目次
カルナバワックス市場の成長と動向
Grand View Research, Inc.の最新レポートによると、世界のカルナバワックス市場規模は2030年までに3億8,580万米ドルに達し、予測期間中のCAGRは3.4%を記録すると予測されています。
同市場は、優れた光沢を与え、美的能力を向上させる食品艶出し剤としての同製品の使用増加により、高い成長が見込まれています。カルナバワックス市場は、欧州連合(EU)や食品医薬品局(FDA)などの規制機関が実施する有利な規制の影響を強く受けています。この業界は原材料に大きく依存しており、これが製造業者の運営コストの大部分を占めています。原料は主に農家や土地所有者から供給され、ワックス抽出のための原始的な技術を採用しています。しかし、場合によっては、メーカーが原料の抽出まで後方統合していることもあります。
ブラジルのヤシの木はこの地域だけのものであるため、製品の製造はブラジルに限られています。生産は、Brasil Ceras、Carnauba do Brasil、Foncepi、Pontesのワックスメーカー4社が独占しています。この市場に参入している企業は、国際市場で製品を販売するために外部の第三者流通チャネルに頼る一方、国内流通は企業が確立した流通チャネルを通じて行われています。この業界は、北米、欧州、アジア太平洋などの主要なカルナバワックス消費地域に広がる多数のサプライヤーとディストリビューターが存在することが特徴です。
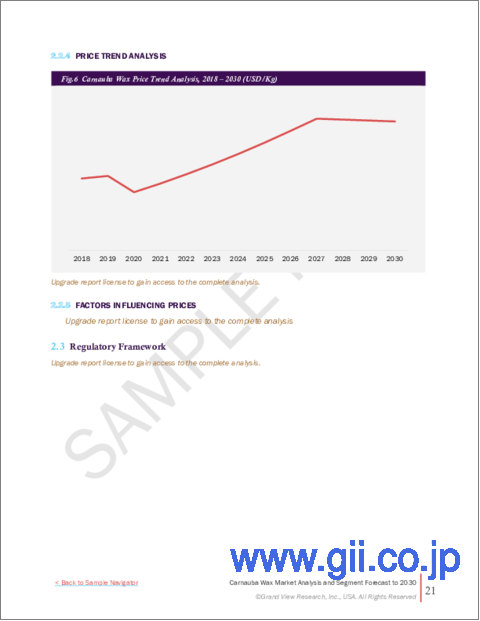
市場の投資可能性は、原料供給業者と製造業者の利益率が低く、供給業者と卸売業者の利益率が比較的高いことを宣言しています。製品の価格は北米と欧州では低いが、アジア太平洋では高いです。同製品はブラジルのみで製造されているため、中南米では北米や欧州に比べて比較的安価です。価格は輸送コストにより地域によって大きく異なります。その結果、北米の価格はアジア太平洋の価格に比べて大幅に低くなっています。
カルナバワックス市場レポートハイライト
- 自動車用途は、2022年に45.6%の最大の売上シェアを占めました。これは、高光沢の仕上げを提供し、紫外線、傷、その他の損傷から車の塗装を保護するために、カーワックスにプレミアムシャインワックスの需要が高いためです。
- 食品用途分野は、菓子類や果物コーティングにおけるカルナバワックスの使用増加により、最も速いCAGR 3.7%を記録する見込みです。
- アジア太平洋地域は、中国やインドなどの新興経済諸国における急速な工業化により、2022年には34.6%の収益シェアで市場を独占しました。同地域における可処分所得の増加と消費者の嗜好の変化が相まって、需要の牽引役となることが予想されます。前述の経済圏における菓子類の成長は、市場成長に恩恵をもたらすと予想されます。
- 業界の主要参加者は、世界の需要に対応するために広範な流通網の構築に関与しています。流通業者は、メーカーからの製品の調達に関与し、その後、エンドユーザーの要求に従って、物理的形状に関連する製品のカスタマイズが行われます。
目次
第1章 調査手法と範囲
第2章 エグゼクティブサマリー
第3章 カルナバワックス市場変数、動向および範囲
- 市場系統の見通し
- 普及と成長の見通しマッピング
- バリューチェーン分析
- 規制の枠組み
- 市場力学
- 市場促進要因分析
- 市場抑制要因分析
- 業界の機会と課題
- カルナバワックス市場分析ツール
- 業界分析- ポーターのファイブフォース分析
- PESTEL分析
第4章 サプライヤーのポートフォリオ分析
- サプライヤー一覧
- クラジック・マトリックス
- 調達のベストプラクティス
- 交渉戦略
第5章 カルナバワックス:製品推定・動向分析
- カルナバ蝋市場:重要なポイント
- カルナバワックス市場:動向と市場シェア分析、2022年と2030年
- 1号
- 1号市場推計・予測、2018年から2030年まで
- 3号
- 3号の市場推計・予測、2018年から2030年まで
- 4号
- 4号の市場推計・予測、2018年から2030年まで
第6章 カルナバワックス:用途の推定・動向分析
- カルナバワックス市場:重要なポイント
- カルナバワックス市場:動向と市場シェア分析、2022年と2030年
- 化粧品
- 食品
- 自動車
- 医薬品
- その他
第7章 カルナバワックス市場:地域の推定・動向分析
- 地域別の見通し
- 地域別のカルナバワックス市場:重要なポイント
- 北米
- 市場推計・予測、2018~2030年
- 米国
- カナダ
- メキシコ
- 欧州
- 英国
- ドイツ
- フランス
- イタリア
- スペイン
- ロシア
- オランダ
- アジア太平洋地域
- 中国
- 日本
- インド
- 韓国
- 東南アジア
- 中南米(CSA)
- ブラジル
- アルゼンチン
- 中東・アフリカ
- サウジアラビア
- 南アフリカ
第8章 競合情勢
- 主要市場参入企業による最近の動向と影響分析
- 市場参入企業の分類
- FONCEPI- Comercial Exportadora Ltda.
- Carnauba do Brasil Ltda
- Brasil Ceras
- Tropical Ceras Do Brasil Ltda.
- Natural Wax
- Pontes Industria de Cera ltda.
- Strahl & Pitsch, Inc.
- Kahl GmbH & Co. KG
- Norevo GmbH.
- Koster Keunen Holland
- The International Group, Inc.
- Frank B. Ross, Inc.
- Poth Hille
- Ter Hell & Co. GmbH
- J. Allcock & Sons Ltd.
List of Tables
- Table 1 List of abbreviations
- Table 2 North America carnauba wax market, by product, 2018 - 2030 (USD Million) (Tons)
- Table 3 North America carnauba wax market, by application, 2018 - 2030 (USD Million) (Tons)
- Table 4 North America carnauba wax market, by region, 2018 - 2030 (USD Million) (Tons)
- Table 5 U.S. carnauba wax market, by product, 2018 - 2030 (USD Million) (Tons)
- Table 6 U.S. carnauba wax market, by application, 2018 - 2030 (USD Million) (Tons)
- Table 7 Canada carnauba wax market, by product, 2018 - 2030 (USD Million) (Tons)
- Table 8 Canada carnauba wax market, by application, 2018 - 2030 (USD Million) (Tons)
- Table 9 Mexico carnauba wax market, by product, 2018 - 2030 (USD Million) (Tons)
- Table 10 Mexico carnauba wax market, by application, 2018 - 2030 (USD Million) (Tons)
- Table 11 Europe carnauba wax market, by product, 2018 - 2030 (USD Million) (Tons)
- Table 12 Europe carnauba wax market, by application, 2018 - 2030 (USD Million) (Tons)
- Table 13 Europe carnauba wax market, by region, 2018 - 2030 (USD Million) (Tons)
- Table 14 UK carnauba wax market, by product, 2018 - 2030 (USD Million) (Tons)
- Table 15 UK carnauba wax market, by application, 2018 - 2030 (USD Million) (Tons)
- Table 16 Germany carnauba wax market, by product, 2018 - 2030 (USD Million) (Tons)
- Table 17 Germany carnauba wax market, by application, 2018 - 2030 (USD Million) (Tons)
- Table 18 France carnauba wax market, by product, 2018 - 2030 (USD Million) (Tons)
- Table 19 France carnauba wax market, by application, 2018 - 2030 (USD Million) (Tons)
- Table 20 Italy carnauba wax market, by product, 2018 - 2030 (USD Million) (Tons)
- Table 21 Italy carnauba wax market, by application, 2018 - 2030 (USD Million) (Tons)
- Table 22 Spain carnauba wax market, by product, 2018 - 2030 (USD Million) (Tons)
- Table 23 Spain carnauba wax market, by application, 2018 - 2030 (USD Million) (Tons)
- Table 24 Russia carnauba wax market, by product, 2018 - 2030 (USD Million) (Tons)
- Table 25 Russia carnauba wax market, by application, 2018 - 2030 (USD Million) (Tons)
- Table 26 Netherlands carnauba wax market, by product, 2018 - 2030 (USD Million) (Tons)
- Table 27 Netherlands carnauba wax market, by application, 2018 - 2030 (USD Million) (Tons)
- Table 28 Asia Pacific carnauba wax market, by product, 2018 - 2030 (USD Million) (Tons)
- Table 29 Asia Pacific carnauba wax market, by application, 2018 - 2030 (USD Million) (Tons)
- Table 30 Asia Pacific carnauba wax market, by region, 2018 - 2030 (USD Million) (Tons)
- Table 31 China carnauba wax market, by product, 2018 - 2030 (USD Million) (Tons)
- Table 32 China carnauba wax market, by application, 2018 - 2030 (USD Million) (Tons)
- Table 33 Japan carnauba wax market, by product, 2018 - 2030 (USD Million) (Tons)
- Table 34 Japan carnauba wax market, by application, 2018 - 2030 (USD Million) (Tons)
- Table 35 India carnauba wax market, by product, 2018 - 2030 (USD Million) (Tons)
- Table 36 India carnauba wax market, by application, (USD Million) (Tons) 2018 - 2030
- Table 37 South Korea carnauba wax market, by product, 2018 - 2030 (USD Million) (Tons)
- Table 38 South Korea carnauba wax market, by application, 2018 - 2030 (USD Million) (Tons)
- Table 39 Southeast Asia carnauba wax market, by product, 2018 - 2030 (USD Million) (Tons)
- Table 40 Southeast Asia carnauba wax market, by application, 2018 - 2030 (USD Million) (Tons)
- Table 41 Central & South America carnauba wax market, by product, 2018 - 2030 (USD Million) (Tons)
- Table 42 Central & South America carnauba wax market, by application, 2018 - 2030 (USD Million) (Tons)
- Table 43 Central & South America carnauba wax market, by region, 2018 - 2030 (USD Million) (Tons)
- Table 44 Brazil carnauba wax market, by product, 2018 - 2030 (USD Million) (Tons)
- Table 45 Brazil carnauba wax market, by application, 2018 - 2030 (USD Million) (Tons)
- Table 46 Argentina carnauba wax market, by product, 2018 - 2030 (USD Million) (Tons)
- Table 47 Argentina carnauba wax market, by application, 2018 - 2030 (USD Million) (Tons)
- Table 48 Middle East and Africa carnauba wax market, by product, 2018 - 2030 (USD Million) (Tons)
- Table 49 Middle East and Africa carnauba wax market, by application, 2018 - 2030 (USD Million) (Tons)
- Table 50 Middle East and Africa carnauba wax market, by region, 2018 - 2030 (USD Million) (Tons)
- Table 51 Saudi Arabia carnauba wax market, by product, 2018 - 2030 (USD Million) (Tons)
- Table 52 Saudi Arabia carnauba wax market, by application, 2018 - 2030 (USD Million) (Tons)
- Table 53 South Africa carnauba wax market, by product, 2018 - 2030 (USD Million) (Tons)
- Table 54 South Africa carnauba wax market, by application, 2018 - 2030 (USD Million) (Tons)
List of Figures
- Fig. 1 Market research process
- Fig. 2 Data triangulation techniques
- Fig. 3 Primary research pattern
- Fig. 4 Market research approaches
- Fig. 5 Value-chain-based sizing & forecasting
- Fig. 6 QFD modeling for market share assessment
- Fig. 7 Market formulation & validation
- Fig. 8 Carnauba wax: Market outlook
- Fig. 9 Carnauba wax: Competitive insights
- Fig. 10 Parent market outlook
- Fig. 11 Related/ancillary market outlook
- Fig. 12 Penetration and growth prospect mapping
- Fig. 13 Industry value chain analysis
- Fig. 14 Carnauba wax market driver impact
- Fig. 15 Carnauba wax market restraint impact
- Fig. 16 Carnauba wax market strategic initiatives analysis
- Fig. 17 Carnauba wax market: Product movement analysis
- Fig. 18 Carnauba wax market: Product outlook and key takeaways
- Fig. 19 Type 1 market estimates and forecasts, (2018 - 2030 USD Million) (Tons)
- Fig. 20 Type 3 market estimates and forecasts, (2018 - 2030 USD Million) (Tons)
- Fig. 21 Type 4 market estimates and forecasts, (2018 - 2030 USD Million) (Tons)
- Fig. 22 Carnauba wax market: Application movement analysis
- Fig. 23 Carnauba wax market: Application outlook and key takeaways
- Fig. 24 Cosmetics market estimates and forecasts, (2018 - 2030 USD Million) (Tons)
- Fig. 25 Food market estimates and forecasts, (2018 - 2030 USD Million) (Tons)
- Fig. 26 Automotive market estimates and forecasts, (2018 - 2030 USD Million) (Tons)
- Fig. 27 Pharmaceutical market estimates and forecasts, (2018 - 2030 USD Million) (Tons)
- Fig. 28 Others market estimates and forecasts, (2018 - 2030 USD Million) (Tons)
- Fig. 29 Global carnauba wax market: Regional movement analysis
- Fig. 30 Global carnauba wax market: Regional outlook and key takeaways
- Fig. 31 North America market estimates and forecasts, (2018 - 2030 USD Million) (Tons)
- Fig. 32 U.S. market estimates and forecasts, (2018 - 2030 USD Million) (Tons)
- Fig. 33 Canada market estimates and forecasts, (2018 - 2030 USD Million) (Tons)
- Fig. 34 Mexico market estimates and forecasts, (2018 - 2030 USD Million) (Tons)
- Fig. 35 Europe market estimates and forecasts, (2018 - 2030 USD Million) (Tons)
- Fig. 36 UK market estimates and forecasts, (2018 - 2030 USD Million) (Tons)
- Fig. 37 Germany market estimates and forecasts, (2018 - 2030 USD Million) (Tons)
- Fig. 38 France market estimates and forecasts, (2018 - 2030 USD Million) (Tons)
- Fig. 39 Italy market estimates and forecasts, (2018 - 2030 USD Million) (Tons)
- Fig. 40 Spain market estimates and forecasts, (2018 - 2030 USD Million) (Tons)
- Fig. 41 Russia market estimates and forecasts, (2018 - 2030 USD Million) (Tons)
- Fig. 42 Netherlands market estimates and forecasts, (2018 - 2030 USD Million) (Tons)
- Fig. 43 Asia Pacific market estimates and forecasts, (2018 - 2030 USD Million) (Tons)
- Fig. 44 China market estimates and forecasts, (2018 - 2030 USD Million) (Tons)
- Fig. 45 Japan market estimates and forecasts, (2018 - 2030 USD Million) (Tons)
- Fig. 46 India market estimates and forecasts, (2018 - 2030 USD Million) (Tons)
- Fig. 47 South Korea market estimates and forecasts, (2018 - 2030 USD Million) (Tons)
- Fig. 48 Southeast Asia market estimates and forecasts, (2018 - 2030 USD Million) (Tons)
- Fig. 49 Central & South America market estimates and forecasts, (2018 - 2030 USD Million) (Tons)
- Fig. 50 Brazil market estimates and forecasts, (2018 - 2030 USD Million) (Tons)
- Fig. 51 Argentina market estimates and forecasts, (2018 - 2030 USD Million) (Tons)
- Fig. 52 Middle East and Africa market estimates and forecasts, (2018 - 2030 USD Million) (Tons)
- Fig. 53 Saudi Arabia market estimates and forecasts, (2018 - 2030 USD Million) (Tons)
- Fig. 54 South Africa market estimates and forecasts, (2018 - 2030 USD Million) (Tons) (2018 - 2030 USD Million) (Tons) (2018 - 2030 USD Million) (Tons)
Carnauba Wax Market Growth & Trends:
The global carnauba wax market size is expected to reach USD 385.8 million by 2030, registering a CAGR of 3.4% during the forecast period, according to a new report by Grand View Research, Inc.. The market is expected to witness high growth owing to increasing use of the product as a food glazing agent which provides a superior shine, thus improving its aesthetic ability. Carnauba wax market is highly influenced by the favorable regulations enforced by the regulatory agencies such as European Union (EU) and Food and Drug Administration (FDA). The industry is highly dependent on the raw materials which form a major part of the operational cost for the manufacturers. The raw material is supplied majorly by the farmers and landholders, employing primitive techniques for wax extraction. However, in some cases, the manufacturers may be backward integrated to the extraction of raw materials.
The manufacturing of the product is limited to Brazil due to the exclusivity of the Brazilian palm tree to the region. The production is dominated by four wax manufacturers namely Brasil Ceras, Carnauba do Brasil, Foncepi, and Pontes. The companies in the market resort to external third party distribution channels to sell their product in the international market while the domestic distribution is carried out through the company established distribution channels. The industry is characterized by the presence of a number of suppliers and distributors spread across the major carnauba wax consuming regions such as North America, Europe, and Asia Pacific.
The investment feasibility for the market declares the low-profit margins for the raw materials suppliers and the manufacturers, and a relatively higher margins for the suppliers and the wholesalers. The price of the product is lower in North America and Europe, but higher in Asia Pacific. The product is manufactured solely in Brazil, leading to a comparatively lower cost in Central and South America as compared to North America and Europe. The prices significantly vary across region owing to transportation cost. As a result, the prices in North America are significantly lower as compared to the cost in Asia Pacific.
Carnauba Wax Market Report Highlights:
- The automotive application accounted for the largest revenue share of 45.6% in 2022, on account of high-demand premium shine wax in car waxes to provide a high-gloss finish and protect the car's paint from UV rays, scratches, and other damage.
- The food application segment is expected to register the fastest CAGR of 3.7%, due to the growing use of carnauba wax in confectionery and fruit coatings.
- Asia Pacific dominated the market with a revenue share of 34.6% in 2022, due to rapid industrialization in the developing economies such as China and India. Increasing disposable income coupled with the changing consumer preference in the region is expected to drive the demand. The growth of the confectionery industry in the aforementioned economies is expected to benefit the market growth.
- Key participants in the industry are involved in setting up of the extensive distribution network to cater to the global demand. The distributors are involved in the procurement of the product from the manufacturers, followed by product customization related to the physical form, in accordance with the requirements of the end-users.
Table of Contents
Chapter 1. Methodology and Scope
- 1.1. Market Segmentation & Scope
- 1.1.1. Product
- 1.1.2. Application
- 1.1.3. Regional scope
- 1.1.4. Estimates and forecast timeline
- 1.2. Research Methodology
- 1.3. Information Procurement
- 1.3.1. Purchased database
- 1.3.2. GVR's internal database
- 1.3.3. Secondary sources
- 1.3.4. Primary research
- 1.3.5. Details of primary research
- 1.4. Information or Data Analysis
- 1.5. Market Formulation & Validation
- 1.6. Model Details
- 1.7. List of Secondary Sources
- 1.8. List of Primary Sources
- 1.9. Objectives
Chapter 2. Executive Summary
- 2.1. Market Outlook
- 2.2. Segment Outlook
- 2.2.1. Product outlook
- 2.2.2. Application outlook
- 2.2.3. Regional outlook
- 2.3. Competitive Insights
Chapter 3. Carnauba Wax Market Variables, Trends & Scope
- 3.1. Market Lineage Outlook
- 3.2. Penetration & Growth Prospect Mapping
- 3.3. Value Chain Analysis
- 3.4. Regulatory Framework
- 3.5. Market Dynamics
- 3.5.1. Market driver analysis
- 3.5.2. Market restraint analysis
- 3.5.3. Industry opportunities & challenges
- 3.6. Carnauba Wax Market Analysis Tools
- 3.6.1. Industry analysis - Porter's
- 3.6.1.1. Supplier power
- 3.6.1.2. Buyer power
- 3.6.1.3. Substitution threat
- 3.6.1.4. Threat of new entrant
- 3.6.1.5. Competitive rivalry
- 3.6.2. PESTEL analysis
- 3.6.2.1. Political landscape
- 3.6.2.2. Technological landscape
- 3.6.2.3. Economic landscape
- 3.6.2.4. Social landscape
- 3.6.2.5. Environmental landscape
- 3.6.2.6. Legal landscape
- 3.6.1. Industry analysis - Porter's
Chapter 4. Supplier Portfolio Analysis
- 4.1. List of Suppliers
- 4.2. Kraljic Matrix
- 4.3. Sourcing Best Practices
- 4.4. Negotiation Strategies
Chapter 5. Carnauba Wax: Product Estimates & Trend Analysis
- 5.1. Carnauba Wax Market: Key Takeaways
- 5.2. Carnauba Wax Market: Movement & Market Share Analysis, 2022 & 2030
- 5.3. Type 1
- 5.3.1. Type 1 market estimates and forecasts, 2018 to 2030 (USD Million, Tons)
- 5.4. Type 3
- 5.4.1. Type 3 market estimates and forecasts, 2018 to 2030 (USD Million, Tons)
- 5.5. Type 4
- 5.5.1. Type 4 market estimates and forecasts, 2018 to 2030 (USD Million, Tons)
Chapter 6. Carnauba Wax: Application Estimates & Trend Analysis
- 6.1. Carnauba Wax Market: Key Takeaways
- 6.2. Carnauba Wax Market: Movement & Market Share Analysis, 2022 & 2030
- 6.3. Cosmetics
- 6.3.1. Cosmetics market estimates and forecasts, 2018 to 2030 (USD Million, Tons)
- 6.4. Food
- 6.4.1. Food market estimates and forecasts, 2018 to 2030 (USD Million, Tons)
- 6.5. Automotive
- 6.5.1. Automotive market estimates and forecasts, 2018 to 2030 (USD Million, Tons)
- 6.6. Pharmaceutical
- 6.6.1. Pharmaceutical market estimates and forecasts, 2018 to 2030 (USD Million, Tons)
- 6.7. Others
- 6.7.1. Others market estimates and forecasts, 2018 to 2030 (USD Million, Tons)
Chapter 7. Carnauba Wax Market: Regional Estimates & Trend Analysis
- 7.1. Regional Outlook
- 7.2. Carnauba Wax Market by Region: Key Takeaway
- 7.3. North America
- 7.3.1. Market estimates and forecasts, 2018 - 2030 (Revenue, USD Million, Volume, Tons)
- 7.3.2. U.S.
- 7.3.2.1. Market estimates and forecasts, 2018 - 2030 (Revenue, USD Million, Volume, Tons)
- 7.3.3. Canada
- 7.3.3.1. Market estimates and forecasts, 2018 - 2030 (Revenue, USD Million, Volume, Tons)
- 7.3.4. Mexico
- 7.3.4.1. Market estimates and forecasts, 2018 - 2030 (Revenue, USD Million, Volume, Tons)
- 7.4. Europe
- 7.4.1. UK
- 7.4.1.1. Market estimates and forecasts, 2018 - 2030 (Revenue, USD Million, Volume, Tons)
- 7.4.2. Germany
- 7.4.2.1. Market estimates and forecasts, 2018 - 2030 (Revenue, USD Million, Volume, Tons)
- 7.4.3. France
- 7.4.3.1. Market estimates and forecasts, 2018 - 2030 (Revenue, USD Million, Volume, Tons)
- 7.4.4. Italy
- 7.4.4.1. Market estimates and forecasts, 2018 - 2030 (Revenue, USD Million, Volume, Tons)
- 7.4.5. Spain
- 7.4.5.1. Market estimates and forecasts, 2018 - 2030 (Revenue, USD Million, Volume, Tons)
- 7.4.6. Russia
- 7.4.6.1. Market estimates and forecasts, 2018 - 2030 (Revenue, USD Million, Volume, Tons)
- 7.4.7. Netherlands
- 7.4.7.1. Market estimates and forecasts, 2018 - 2030 (Revenue, USD Million, Volume, Tons)
- 7.4.1. UK
- 7.5. Asia Pacific
- 7.5.1. China
- 7.5.1.1. Market estimates and forecasts, 2018 - 2030 (Revenue, USD Million, Volume, Tons)
- 7.5.2. Japan
- 7.5.2.1. Market estimates and forecasts, 2018 - 2030 (Revenue, USD Million, Volume, Tons)
- 7.5.3. India
- 7.5.3.1. Market estimates and forecasts, 2018 - 2030 (Revenue, USD Million, Volume, Tons)
- 7.5.4. South Korea
- 7.5.4.1. Market estimates and forecasts, 2018 - 2030 (Revenue, USD Million, Volume, Tons)
- 7.5.5. Southeast Asia
- 7.5.5.1. Market estimates and forecasts, 2018 - 2030 (Revenue, USD Million, Volume, Tons)
- 7.5.1. China
- 7.6. Central & South America (CSA)
- 7.6.1. Brazil
- 7.6.1.1. Market estimates and forecasts, 2018 - 2030 (Revenue, USD Million, Volume, Tons)
- 7.6.2. Argentina
- 7.6.2.1. Market estimates and forecasts, 2018 - 2030 (Revenue, USD Million, Volume, Tons)
- 7.6.1. Brazil
- 7.7. MEA
- 7.7.1. Saudi Arabia
- 7.7.1.1. Market estimates and forecasts, 2018 - 2030 (Revenue, USD Million, Volume, Tons)
- 7.7.2. South Africa
- 7.7.2.1. Market estimates and forecasts, 2018 - 2030 (Revenue, USD Million, Volume, Tons)
- 7.7.1. Saudi Arabia
Chapter 8. Competitive Landscape
- 8.1. Recent Developments & Impact Analysis, By Key Market Participants
- 8.2. Market Participant Categorization
- 8.2.1. FONCEPI- Comercial Exportadora Ltda.
- 8.2.1.1. Company overview
- 8.2.1.2. Financial performance
- 8.2.1.3. Product benchmarking
- 8.2.1.4. Strategic initiatives
- 8.2.2. Carnauba do Brasil Ltda
- 8.2.2.1. Company overview
- 8.2.2.2. Financial performance
- 8.2.2.3. Product benchmarking
- 8.2.2.4. Strategic initiatives
- 8.2.3. Brasil Ceras
- 8.2.3.1. Company overview
- 8.2.3.2. Financial performance
- 8.2.3.3. Product benchmarking
- 8.2.3.4. Strategic initiatives
- 8.2.4. Tropical Ceras Do Brasil Ltda.
- 8.2.4.1. Company overview
- 8.2.4.2. Financial performance
- 8.2.4.3. Product benchmarking
- 8.2.4.4. Strategic initiatives
- 8.2.5. Natural Wax
- 8.2.5.1. Company overview
- 8.2.5.2. Financial performance
- 8.2.5.3. Product benchmarking
- 8.2.5.4. Strategic initiatives
- 8.2.6. Pontes Industria de Cera ltda.
- 8.2.6.1. Company overview
- 8.2.6.2. Financial performance
- 8.2.6.3. Product benchmarking
- 8.2.6.4. Strategic initiatives
- 8.2.7. Strahl & Pitsch, Inc.
- 8.2.7.1. Company overview
- 8.2.7.2. Financial performance
- 8.2.7.3. Product benchmarking
- 8.2.7.4. Strategic initiatives
- 8.2.8. Kahl GmbH & Co. KG
- 8.2.8.1. Company overview
- 8.2.8.2. Financial performance
- 8.2.8.3. Product benchmarking
- 8.2.8.4. Strategic initiatives
- 8.2.9. Norevo GmbH.
- 8.2.9.1. Company overview
- 8.2.9.2. Financial performance
- 8.2.9.3. Product benchmarking
- 8.2.9.4. Strategic initiatives
- 8.2.10. Koster Keunen Holland
- 8.2.10.1. Company overview
- 8.2.10.2. Financial performance
- 8.2.10.3. Product benchmarking
- 8.2.10.4. Strategic initiatives
- 8.2.11. The International Group, Inc.
- 8.2.11.1. Company overview
- 8.2.11.2. Financial performance
- 8.2.11.3. Product benchmarking
- 8.2.11.4. Strategic initiatives
- 8.2.12. Frank B. Ross, Inc.
- 8.2.12.1. Company overview
- 8.2.12.2. Financial performance
- 8.2.12.3. Product benchmarking
- 8.2.12.4. Strategic initiatives
- 8.2.13. Poth Hille
- 8.2.13.1. Company overview
- 8.2.13.2. Financial performance
- 8.2.13.3. Product benchmarking
- 8.2.13.4. Strategic initiatives
- 8.2.14. Ter Hell & Co. GmbH
- 8.2.14.1. Company overview
- 8.2.14.2. Financial performance
- 8.2.14.3. Product benchmarking
- 8.2.14.4. Strategic initiatives
- 8.2.15. J. Allcock & Sons Ltd.
- 8.2.15.1. Company overview
- 8.2.15.2. Financial performance
- 8.2.15.3. Product benchmarking
- 8.2.15.4. Strategic initiatives
- 8.2.1. FONCEPI- Comercial Exportadora Ltda.
