|
|
市場調査レポート
商品コード
1375871
北米のスマート業務用トイレ製品市場規模、シェア、動向分析レポート:製品別、用途別、地域別、セグメント別予測、2023年~2030年North America Smart Commercial Restroom Products Market Size, Share & Trends Analysis Report By Product (Touchless Faucets, Smart Consumables, Smart Hand Dryers), By Application, By Region, And Segment Forecasts, 2023 - 2030 |
||||||
|
|
|||||||
カスタマイズ可能
|
|||||||


| 北米のスマート業務用トイレ製品市場規模、シェア、動向分析レポート:製品別、用途別、地域別、セグメント別予測、2023年~2030年 |
|
出版日: 2023年10月04日
発行: Grand View Research
ページ情報: 英文 96 Pages
納期: 2~10営業日
|

- 全表示
- 概要
- 図表
- 目次
北米のスマート業務用トイレ製品市場の成長と動向:
Grand View Research, Inc.の最新レポートによると、北米のスマート業務用トイレ製品市場規模は2030年までに10億7,000万米ドルに達し、予測期間中にCAGR 9.3%で成長すると予測されています。
同市場は、重要な要因によって大幅な成長を遂げています。特にCOVID-19の大流行中、衛生と健康が重視されるようになったことが極めて重要な要素の1つです。スマートトイレ製品は、自動蛇口、ソープディスペンサー、水洗システムなど、タッチレスやセンサー駆動のソリューションを提供し、細菌感染のリスクを効果的に低減し、全体的な清潔さを向上させる。
持続可能性も、この市場の拡大に寄与する重要な要因のひとつです。環境問題に対する意識の高まりを受けて、企業は低流量トイレ、LED照明、稼働センサーなど、水やエネルギー効率の高い機能を組み込んだスマートトイレ・技術の採用を増やしています。こうした機能は運用コストを削減し、より持続可能な環境に貢献します。さらに、ユーザーエクスペリエンスの向上に対する需要が、スマートトイレ製品業界の成長を後押ししています。自動便座カバー、自動洗浄便器、水温と水圧の個別設定などのイノベーションは、利用者の全体的なトイレ体験を大幅に改善しています。
データ分析は、トイレ管理の最適化に重要な役割を果たしています。多くのスマートトイレ製品にはセンサーとデータ収集機能が搭載されており、トイレの使用パターンの監視、予知保全、より効率的な清掃スケジュールを可能にしています。さらに、利用者への配慮とアクセシビリティ基準への準拠も重要な考慮事項となっています。スマートトイレ製品には、すべての利用者のアクセシビリティを確保するために、グラブバー、音声作動式コントロール、点字表示が含まれていることが多いです。スマートトイレルーム製品への初期投資は高くつくかもしれないが、水やエネルギーの消費量の削減、メンテナンス費用の削減、運用効率の向上に伴う長期的なコスト削減を認識する企業が増えています。
この分野の最近の動向は、UV-C殺菌技術の統合など、衛生と安全への取り組みを反映しています。さらに、モノのインターネット(IoT)を活用して、トイレ設備の集中管理、遠隔監視、予知保全が可能になりつつあります。音声起動やモバイルアプリベースの制御は、ユーザーの利便性を高め、タッチポイントを減らしています。性別にとらわれないトイレ、美しいデザイン、LEEDのようなエコ認証の採用は、スマート業務用トイレの進化をさらに際立たせています。
北米のスマート業務用トイレ製品市場レポートハイライト:
- 製品別では、タッチレス(モーション)蛇口分野が2022年に最大の売上シェアを占めました。タッチレス水栓は、利用者が物理的にハンドルに触れる必要がなく、二次汚染や細菌・病原菌の感染の可能性を低減します。この機能は、複数の人が毎日器具に接触する公共および業務用トイレで最も重要です。
- 用途別では、業務用不動産分野が2023年から2030年にかけて最も速いCAGRで成長すると予想されています。スマートトイレ製品は、業務用不動産の管理者が業務効率を最適化するのに役立ちます。自動照明、節水、予知保全などの機能により、光熱費と頻繁な手作業による点検・保守の必要性が削減されます。
- 米国は2023年から2030年にかけてCAGR 5.4%の成長が見込まれます。幅広い人口に対するファッション産業の影響力の増大と裁量支出の増加が、北米におけるスマート業務用トイレ製品の需要を促進すると予想されます。
目次
第1章 調査手法と範囲
第2章 エグゼクティブサマリー
第3章 北米のスマート業務用トイレ製品市場の変数、動向、範囲
- 市場系統の見通し
- 業界のバリューチェーン分析
- 原材料の見通し
- 製造と技術の展望
- 利益率分析
- 市場力学
- 市場促進要因分析
- 市場抑制要因分析
- 市場機会
- 市場の課題
- 業界分析- ポーターのファイブフォース分析
- 市場参入戦略
第4章 消費者行動分析
- 人口動向分析
- 消費者の動向と好み
- 購入決定に影響を与える要因
- 消費者向け製品の採用
- 主な観察と調査結果
第5章 スマート業務用トイレ製品市場:製品別、推定・動向分析
- 製品変動分析と市場シェア、2022年と2030年
- タッチレス(モーション)水栓
- スマートソープディスペンサー
- スマートフラッシュバルブ
- スマート使用検出
- スマートハンドドライヤー
- スマート漏れ/浸水検出
- スマート消耗品
- その他のスマート製品
第6章 北米のスマート業務用トイレ製品市場:用途別、推定・動向分析
- スマート業務用トイレ製品分析と市場シェア、2022年と2030年
- 教育機関
- 交通機関
- 医療
- 娯楽施設
- ホテルとレストラン
- 業務用不動産
- その他
第7章 北米のスマート業務用トイレ製品市場:地域推定・動向分析
- 地域変動分析と市場シェア、2022年と2030年
- 北米
- 市場推計・予測、2017~2030年
- 製品別、2017~2030年
- 用途別、2017~2030年
- 米国
- カナダ
第8章 競合分析
- 主要市場参入企業による最近の動向と影響分析
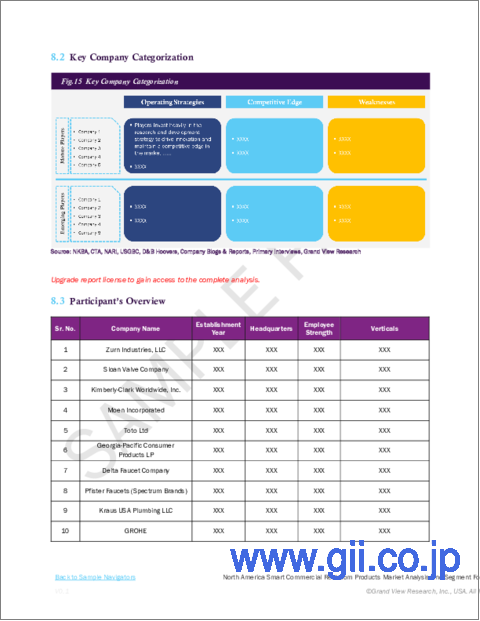
- 企業の分類
- 参入企業概要
- 企業の市場シェア分析、2022年(%)
- 企業ヒートマップ分析
- 戦略マッピング
- このセクションで分析される主要企業のリストには次のものが含まれます。
- Zurn Industries, LLC
- Sloan Valve Company
- Kimberly-Clark Worldwide, Inc
- Moen Incorporated
- TOTO Ltd
- Georgia-Pacific Consumer Products LP
- Delta Faucet Company
- Pfister Faucets(Spectrum Brands)
- Kraus USA Plumbing LLC
- GROHE
- American Standard(LIXIL Corporation)
- Kohler Co.
- Roca Sanitario, SA
- Delany Products
- Chicago Faucets
List of Tables
- 1. North America smart commercial restroom products market- Driving factor market analysis
- 2. North America smart commercial restroom products market- Restraint factor market analysis
- 3. North America smart commercial restroom products market estimates & forecast, by product (USD Million)
- 4. North America smart commercial restroom products market estimates & forecast, by claim (USD Million)
- 5. North America smart commercial restroom products market estimates & forecast, by packaging (USD Million)
- 6. North America smart commercial restroom products market estimates & forecast, by distribution channel (USD Million)
- 7. U.S. macro-economic outlay
- 8. Canada macro-economic outlay
- 9. Recent developments & impact analysis, by key market participants
- 10. Company market share, 2022 (Value % Share)
- 11. Company heat map analysis
List of Figures
- 1. Information procurement
- 2. Primary research pattern
- 3. Primary research approaches
- 4. Primary research process
- 5. Market Snapshot
- 6. Segment Snapshot
- 7. Segment Snapshot
- 8. Competitive Landscape Snapshot
- 9. North America smart commercial restroom products market size, 2017 to 2030 (USD Million)
- 10. North America smart commercial restroom products market: Value chain analysis
- 11. North America smart commercial restroom products market: Profit-margin analysis
- 12. North America smart commercial restroom products market: Dynamics
- 13. North America smart commercial restroom products market: Porter's five forces analysis
- 14. Factors affecting buying decisions for North America smart commercial restroom products
- 15. North America smart commercial restroom products market, by product: Key takeaways
- 16. North America smart commercial restroom products market, by product: Market share, 2022 & 2030
- 17. Touchless (motion) faucets market estimates and forecast, 2017 - 2030 (USD Million)
- 18. Smart soap dispensers market estimates and forecast, 2017 - 2030 (USD Million)
- 19. Smart flush valves market estimates and forecast, 2017 - 2030 (USD Million)
- 20. Smart occupancy detection market estimates and forecast, 2017 - 2030 (USD Million)
- 21. Smart hand dryers market estimates and forecast, 2017 - 2030 (USD Million)
- 22. Smart leak/ flood detection market estimates and forecast, 2017 - 2030 (USD Million)
- 23. Smart consumables market estimates and forecast, 2017 - 2030 (USD Million)
- 24. Other smart products market estimates and forecast, 2017 - 2030 (USD Million)
- 25. North America smart commercial restroom products market, by application: Key takeaways
- 26. North America smart commercial restroom products market, by application: Market share, 2022 & 2030
- 27. Educational institutions market estimates & forecast, 2017 - 2030 (USD Million)
- 28. Transportation market estimates & forecast, 2017 - 2030 (USD Million)
- 29. Healthcare market estimates & forecast, 2017 - 2030 (USD Million)
- 30. Entertainment venues market estimates & forecast, 2017 - 2030 (USD Million)
- 31. Hotels & restaurants market estimates & forecast, 2017 - 2030 (USD Million)
- 32. Commercial real estate market estimates & forecast, 2017 - 2030 (USD Million)
- 33. Others market estimates & forecast, 2017 - 2030 (USD Million)
- 34. Regional marketplace: Key takeaways
- 35. Regional marketplace: Key takeaways
- 36. North America smart commercial restroom products market estimates & forecast, 2017- 2030 (USD Million)
- 37. U.S. smart commercial restroom products market estimates & forecast, 2017 - 2030 (USD Million)
- 38. Canada smart commercial restroom products market estimates & forecast, 2017 - 2030 (USD Million)
- 39. Key company categorization
- 40. Company market share analysis, 2022
North America Smart Commercial Restroom Products Market Growth & Trends:
The North America smart commercial restroom products market size is expected to reach USD 1.07 billion by 2030, growing at a CAGR of 9.3% during the forecast period, according to a new report by Grand View Research, Inc.. The market has been experiencing substantial growth, driven by significant factors. One pivotal element is the increased emphasis on hygiene and health, especially during the COVID-19 pandemic. Smart restroom products offer touchless and sensor-driven solutions, such as automatic faucets, soap dispensers, and flush systems, effectively reducing the risk of germ transmission and enhancing overall cleanliness.
Sustainability is another key driver contributing to this market's expansion. With a growing awareness of environmental issues, businesses are increasingly adopting smart restroom technologies to incorporate water- and energy-efficient features like low-flow toilets, LED lighting, and occupancy sensors. These features reduce operational costs and contribute to a more sustainable environment. Additionally, the demand for an enhanced user experience has fueled the growth of the smart restroom products industry. Innovations such as automated toilet seat covers, self-cleaning toilets, and personalized settings for water temperature and pressure have greatly improved the overall restroom experience for users.
Data analytics is playing a significant role in optimizing restroom management. Many smart restroom products are equipped with sensors and data collection capabilities that enable monitoring restroom usage patterns, predictive maintenance, and more efficient cleaning schedules. Moreover, inclusivity and compliance with accessibility standards have also become important considerations. Smart restroom products often include grab bars, voice-activated controls, and braille signage to ensure accessibility for all users. While the initial investment in smart restroom products may be higher, businesses increasingly recognize the long-term cost savings associated with reduced water and energy consumption, lower maintenance costs, and improved operational efficiency.
Recent trends in this domain reflect a commitment to hygiene and safety, including integrating UV-C disinfection technology. Moreover, the Internet of Things (IoT) is being leveraged to enable centralized control, remote monitoring, and predictive maintenance of restroom facilities. Voice activation and mobile app-based controls are enhancing user convenience and reducing touchpoints. Adopting gender-neutral restrooms, aesthetically pleasing designs, and green certifications like LEED further underscore the evolving landscape of smart commercial restrooms.
North America Smart Commercial Restroom Products Market Report Highlights:
- In terms of product, the touchless (motion) faucets segment held the largest revenue share in 2022. Touchless faucets eliminate the need for users to touch the handles physically, reducing the potential for cross-contamination and the transmission of germs and pathogens. This feature is paramount in public and commercial restrooms, where multiple people come into contact with the fixtures daily
- Based on application, the commercial real estate segment is expected to grow at the fastest CAGR from 2023 to 2030. Smart restroom products help commercial real estate managers optimize operational efficiency. Features such as automated lighting, water conservation, and predictive maintenance reduce utility costs and the need for frequent manual inspections and maintenance
- The U.S. is expected to grow at a CAGR of 5.4% from 2023 to 2030. The growing influence of the fashion industry over a wider population and increased discretionary spending are expected to fuel the demand for smart commercial restroom products in North America
Table of Contents
Chapter 1. Methodology and Scope
- 1.1. Market Segmentation & Scope
- 1.2. Market Definition
- 1.3. Information Procurement
- 1.3.1. Purchased Database
- 1.3.2. GVR's Internal Database
- 1.3.3. Secondary Sources & Third-Party Perspectives
- 1.3.4. Primary Research
- 1.4. Information Analysis
- 1.4.1. Data Analysis Models
- 1.5. Market Formulation & Data Visualization
- 1.6. Data Validation & Publishing
Chapter 2. Executive Summary
- 2.1. Market Outlook
- 2.2. Product Outlook
- 2.3. Application Outlook
- 2.4. Regional Outlook
- 2.5. Competition Outlook
Chapter 3. North America Smart Commercial Restroom Products Market Variables, Trends & Scope
- 3.1. Market Lineage Outlook
- 3.2. Industry Value Chain Analysis
- 3.2.1. Raw Material Outlook
- 3.2.2. Manufacturing and Technology Outlook
- 3.2.3. Profit Margin Analysis
- 3.3. Market Dynamics
- 3.3.1. Market Driver Analysis
- 3.3.2. Market Restraint Analysis
- 3.3.3. Market Opportunities
- 3.3.4. Market Challenges
- 3.4. Industry Analysis - Porter's Five Forces Analysis
- 3.5. Market Entry Strategies
Chapter 4. Consumer Behavior Analysis
- 4.1. Demographics Analysis
- 4.2. Consumer Trends and Preferences
- 4.3. Factors Affecting Buying Decision
- 4.4. Consumer Product Adoption
- 4.5. Key Observations & Findings
Chapter 5. Healthy Snacks Market: Product Estimates & Trend Analysis
- 5.1. Product Movement Analysis & Market Share, 2022 & 2030
- 5.2. Touchless (motion) faucets
- 5.2.1. Touchless (motion) faucets market estimates and forecast, 2017 - 2030 (USD Million)
- 5.3. Smart soap dispensers
- 5.3.1. Smart soap dispensers market estimates and forecast, 2017 - 2030 (USD Million)
- 5.4. Smart flush valves
- 5.4.1. Smart flush valves market estimates and forecast, 2017 - 2030 (USD Million)
- 5.5. Smart occupancy detection
- 5.5.1. Smart occupancy detection market estimates and forecast, 2017 - 2030 (USD Million)
- 5.6. Smart hand dryers
- 5.6.1. Smart hand dryers market estimates and forecast, 2017 - 2030 (USD Million)
- 5.7. Smart leak/flood detection
- 5.7.1. Smart leak/flood detection market estimates and forecast, 2017 - 2030 (USD Million)
- 5.8. Smart consumables
- 5.8.1. Smart consumables market estimates and forecast, 2017 - 2030 (USD Million)
- 5.8.1.1 Smart toilet paper dispenser
- 5.8.1.1.1 Smart toilet paper dispenser market estimates and forecast, 2017 - 2030 (USD Million)
- 5.8.1.2 Smart paper towel dispenser
- 5.8.1.2.1 Smart paper towel dispenser market estimates and forecast, 2017 - 2030 (USD Million)
- 5.8.1. Smart consumables market estimates and forecast, 2017 - 2030 (USD Million)
- 5.9 Other smart products
- 5.9.1 Other smart products market estimates and forecast, 2017 - 2030 (USD Million)
Chapter 6. North America Smart Commercial Restroom Products Market: Application Estimates & Trend Analysis
- 6.1 Claim Movement Analysis & Market Share, 2022 & 2030
- 6.2 Educational institutions
- 6.2.1 Educational institutions market estimates and forecast, 2017 - 2030 (USD Million)
- 6.2.1.1 K-12 educational institutions
- 6.2.1.1.1 K-12 educational institutions market estimates and forecast, 2017 - 2030 (USD Million)
- 6.2.1.2 Higher educational institutions
- 6.2.1.2.1 Higher educational institutions market estimates and forecast, 2017 - 2030 (USD Million)
- 6.2.1 Educational institutions market estimates and forecast, 2017 - 2030 (USD Million)
- 6.3 Transportation
- 6.3.1 Transportation market estimates and forecast, 2017 - 2030 (USD Million)
- 6.3.1.1 Airports
- 6.3.1.1.1 Airports market estimates and forecast, 2017 - 2030 (USD Million)
- 6.3.1.2 Other transport hubs
- 6.3.1.2.1 Other transport hubs market estimates and forecast, 2017 - 2030 (USD Million)
- 6.3.1 Transportation market estimates and forecast, 2017 - 2030 (USD Million)
- 6.4 Healthcare
- 6.4.1 Healthcare market estimates and forecast, 2017 - 2030 (USD Million)
- 6.5 Entertainment venues
- 6.5.1 Entertainment venues market estimates and forecast, 2017 - 2030 (USD Million)
- 6.6 Hotels & restaurants
- 6.6.1 Hotels & restaurants market estimates and forecast, 2017 - 2030 (USD Million)
- 6.7 Commercial real estate
- 6.7.1 Commercial real estate market estimates and forecast, 2017 - 2030 (USD Million)
- 6.7.1.1 Office buildings
- 6.7.1.1.1 Office buildings market estimates and forecast, 2017 - 2030 (USD Million)
- 6.7.1.2 Malls & shopping centers
- 6.7.1.2.1 Malls & shopping centers market estimates and forecast, 2017 - 2030 (USD Million)
- 6.7.1 Commercial real estate market estimates and forecast, 2017 - 2030 (USD Million)
- 6.8 Others
- 6.8.1 Others market estimates and forecast, 2017 - 2030 (USD Million)
Chapter 7. North America Smart Commercial Restroom Products Market: Regional Estimates & Trend Analysis
- 7.1 Regional Movement Analysis & Market Share, 2022 & 2030
- 7.2 North America
- 7.2.1 Market estimates and forecast, 2017 - 2030 (USD Million)
- 7.2.2 Market estimates and forecast, by product, 2017 - 2030 (USD Million)
- 7.2.3 Market estimates and forecast, by application, 2017 - 2030 (USD Million)
- 7.2.4 U.S.
- 7.2.4.1 Market estimates and forecast, 2017 - 2030 (USD Million)
- 7.2.4.2 Market estimates and forecast, by product, 2017 - 2030 (USD Million)
- 7.2.4.3 Market estimates and forecast, by application, 2017 - 2030 (USD Million)
- 7.2.5 Canada
- 7.2.5.1 Market estimates and forecast, 2017 - 2030 (USD Million)
- 7.2.5.2 Market estimates and forecast, by product, 2017 - 2030 (USD Million)
- 7.2.5.3 Market estimates and forecast, by application, 2017 - 2030 (USD Million)
Chapter 8. Competitive Analysis
- 8.1 Recent developments & impact analysis, by key market participants
- 8.2 Company Categorization
- 8.3 Participant's Overview
- 8.4 Financial Performance
- 8.5 Product Benchmarking
- 8.6 Company Market Share Analysis, 2022 (%)
- 8.7 Company Heat Map Analysis
- 8.8 Strategy Mapping
- 8.9 List of key companies analyzed in this section includes:
- 8.9.1 Zurn Industries, LLC
- 8.9.2 Sloan Valve Company
- 8.9.3 Kimberly-Clark Worldwide, Inc
- 8.9.4 Moen Incorporated
- 8.9.5 TOTO Ltd
- 8.9.6 Georgia-Pacific Consumer Products LP
- 8.9.7 Delta Faucet Company
- 8.9.8 Pfister Faucets (Spectrum Brands)
- 8.9.9 Kraus USA Plumbing LLC
- 8.9.10 GROHE
- 8.9.11 American Standard (LIXIL Corporation)
- 8.9.12 Kohler Co.
- 8.9.13 Roca Sanitario, S.A
- 8.9.14 Delany Products
- 8.9.15 Chicago Faucets
