|
|
市場調査レポート
商品コード
1363506
バイオベースポリ塩化ビニル(PVC)の市場規模、シェア、動向分析レポート:製品別、用途別、地域別、セグメント予測、2023年~2030年Bio-based Polyvinyl Chloride Market Size, Share & Trends Analysis Report By Product (Rigid, Flexible), By Application (Films & Sheets, Wires & Cables, Pipes & Fittings), By Region, And Segment Forecasts, 2023 - 2030 |
||||||
|
|
|||||||
カスタマイズ可能
|
|||||||


| バイオベースポリ塩化ビニル(PVC)の市場規模、シェア、動向分析レポート:製品別、用途別、地域別、セグメント予測、2023年~2030年 |
|
出版日: 2023年09月21日
発行: Grand View Research
ページ情報: 英文 134 Pages
納期: 2~10営業日
|

- 全表示
- 概要
- 図表
- 目次
バイオベースポリ塩化ビニル(PVC)市場の成長と動向
Grand View Research, Inc.の最新調査によると、世界のバイオベースポリ塩化ビニル(PVC)市場規模は2030年までに25億4,465万米ドルに達する見込みです。
同市場は2023年から2030年にかけてCAGR 19.3%で拡大すると予測されています。バイオベースポリ塩化ビニル市場は、持続可能性と環境責任に向けた顕著な動向を経験しています。環境問題に対する世界の意識が高まり続ける中、環境に優しい素材を好む傾向が強まっています。
バイオマスや農業残渣など再生可能な資源を原料とするバイオベースポリ塩化ビニルは、石油由来の原料に依存する従来のポリ塩化ビニルよりも持続可能な代替品を提供することで、この動向に合致しています。この傾向は、特に建設、自動車、包装などの業界で顕著であり、持続可能性の目標や、より環境に優しい製品を求める消費者の要望に応えるため、バイオベースPVCの採用が進んでいます。
政府の規制や取り組みも、バイオベースPVC市場の成長を後押ししています。多くの国が、プラスチック廃棄物の削減と持続可能な素材の使用を促進する政策を実施しています。こうした規制は、環境基準を満たし二酸化炭素排出量を削減する手段として、バイオベースPVCへの投資を企業に促しています。さらに、バイオベースPVC分野での研究開発努力は進み続けており、製品性能の向上、コスト効率の改善、用途の拡大につながっています。このような技術の進歩により、バイオベースPVCは産業界にとってより魅力的な選択肢となっており、市場のさらなる成長を促進する態勢が整っています。
全体として、バイオベースPVC市場は予測期間中に大きく拡大する見通しです。持続可能な製品に対する消費者の需要、支持的な政府政策、バイオベースPVC技術における継続的な技術革新の融合により、この市場は、より環境に配慮した責任あるプラスチック産業への移行における重要なプレーヤーとして位置づけられています。
バイオベースポリ塩化ビニル(PVC)市場レポートハイライト
- アジア太平洋地域は世界のバイオベースPVC市場において支配的な地域であり、2022年には全体の収益の43.0%以上を占めました。中国やインドのような国々における急速な都市化、インフラ整備、持続可能性への意識の高まりが、用途におけるバイオベースPVCの需要を大幅に押し上げています。また、原材料の入手可能性と持続可能な材料に対する政府の支援が、この地域の市場優位性を後押ししています。
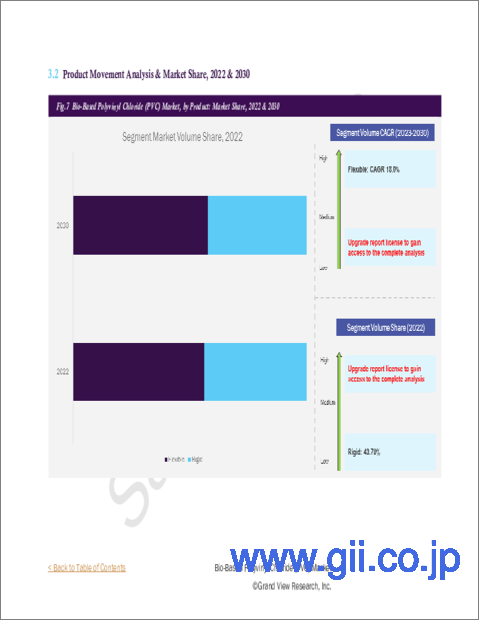
- 硬質PVCは世界のバイオベースポリ塩化ビニル市場の主要製品であり、2022年には全体の売上高の41.0%以上を占めました。この高いシェアは、その卓越した耐久性と汎用性により、様々な産業にとって理想的な選択肢となっていることに起因しています。過酷な条件に耐え、腐食に耐えるその能力は、バイオベース材料としての環境に優しい特性と相まって、持続可能性の目標や厳しい環境規制に合致し、市場の優位性をさらに高めています。
- パイプと継手の分野は、バイオベースPVCの世界市場で圧倒的なシェアを占めており、2022年には全体の売上高の31.0%以上を占めました。これは、バイオベースPVCが卓越した耐久性、耐腐食性、環境に優しい性質を備えているためで、さまざまなインフラや配管用途に好まれる選択肢となっています。持続可能な建設材料への注目の高まりや、環境に配慮した選択を促す規制が、パイプや継手におけるバイオベースPVCの採用をさらに後押ししています。
- 2021年2月、Westlake Chemical Corporationの子会社であるVinnolitは、医療、自動車、建設業界で幅広く利用できる低炭素の代替PVCである「GreenVin」のブランド名で、バイオ属性のポリ塩化ビニル(PVC)を発売しました。
目次
第1章 調査手法と範囲
第2章 エグゼクティブサマリー
第3章 バイオベースポリ塩化ビニル(PVC)市場:変数と動向
- 市場系統の見通し
- バイオベースポリ塩化ビニル(PVC)市場- 浸透と成長の見通しマッピング
- 業界のバリューチェーン分析
- 技術概要
- 規制の枠組み
- 市場力学
- 迫り来るインフレ懸念と景気減速、そしてそれが市場に与える影響
- 東欧の地政学的紛争の影響
- 業界分析ツール
第4章 バイオベースポリ塩化ビニル(PVC)市場:製品別推定・動向分析
- 製品変動分析と市場シェア、2022年と2030年
- 製品別
第5章 バイオベースポリ塩化ビニル(PVC)市場:用途別推定・動向分析
- 用途の変動分析と市場シェア、2022年と2030年
- 用途別
第6章 バイオベースポリ塩化ビニル(PVC)市場:地域別推定・動向分析
- バイオベースポリ塩化ビニル(PVC)市場:地域別の見通し
- 北米
- 北米バイオベースポリ塩化ビニル
- 米国
- カナダ
- メキシコ
- 欧州
- 欧州バイオベースポリ塩化ビニル
- ドイツ
- 英国
- フランス
- イタリア
- スペイン
- オランダ
- アジア太平洋地域
- アジア太平洋地域のバイオベースポリ塩化ビニル
- 中国
- インド
- 日本
- 韓国
- オーストラリア
- タイ
- マレーシア
- インドネシア
- ベトナム
- 中南米
- 中南米バイオベースポリ塩化ビニル
- ブラジル
- アルゼンチン
- 中東とアフリカ
- 中東およびアフリカのバイオベースポリ塩化ビニル
- サウジアラビア
- アラブ首長国連邦
- 南アフリカ
第7章 バイオベースポリ塩化ビニル(PVC)市場-競合情勢
- 主要市場参入企業による最近の動向と影響分析
- 企業の分類
- ベンダー情勢
- 参入企業の概要
- 財務実績
- 製品のベンチマーク
- 企業ヒートマップ分析
- 戦略マッピング
List of Tables
- Table 1 List Of Abbreviations
- Table 2 Rigid Bio-based Polyvinyl Chloride (PVC) Market Estimates And Forecasts, 2018 - 2030 (Kilotons) (USD Million)
- Table 3 Flexible Bio-based Polyvinyl Chloride (PVC) Market Estimates And Forecasts, 2018 - 2030 (Kilotons) (USD Million)
- Table 4 Films And Sheets Bio-based Polyvinyl Chloride (PVC) Market Estimates And Forecasts, 2018 - 2030 (Kilotons) (USD Million)
- Table 5 Wires And Cables Bio-based Polyvinyl Chloride (PVC) Market Estimates And Forecasts, 2018 - 2030 (Kilotons) (USD Million)
- Table 6 Pipes And Fittings Bio-based Polyvinyl Chloride (PVC) Market Estimates And Forecasts, 2018 - 2030 (Kilotons) (USD Million)
- Table 7 Profiles/hoses/tubing Bio-based Polyvinyl Chloride (PVC) Market Estimates And Forecasts, 2018 - 2030 (Kilotons) (USD Million)
- Table 8 Edge Band Bio-based Polyvinyl Chloride (PVC) Market Estimates And Forecasts, 2018 - 2030 (Kilotons) (USD Million)
- Table 9 Others Bio-based Polyvinyl Chloride (PVC) Market Estimates And Forecasts, 2018 - 2030 (Kilotons) (USD Million)
- Table 10 North America Bio-based Polyvinyl Chloride (PVC) Market Estimates And Forecasts, 2018 - 2030 (Kilotons) (USD Million)
- Table 11 North America Bio-based Polyvinyl Chloride (PVC) Market Estimates And Forecasts, By Product, 2018 - 2030 (Kilotons)
- Table 12 North America Bio-based Polyvinyl Chloride (PVC) Market Estimates And Forecasts, By Product, 2018 - 2030 (USD Million)
- Table 13 North America Bio-based Polyvinyl Chloride (PVC) Market Estimates And Forecasts, By Application, 2018 - 2030 (Kilotons)
- Table 14 North America Bio-based Polyvinyl Chloride (PVC) Market Estimates And Forecasts, By Application, 2018 - 2030 (USD Million)
- Table 15 U.S. Bio-based Polyvinyl Chloride (PVC) Market Estimates And Forecasts, 2018 - 2030 (Kilotons) (USD Million)
- Table 16 U.S. Bio-based Polyvinyl Chloride (PVC) Market Estimates And Forecasts, By Product, 2018 - 2030 (Kilotons)
- Table 17 U.S. Bio-based Polyvinyl Chloride (PVC) Market Estimates And Forecasts, By Product, 2018 - 2030 (USD Million)
- Table 18 U.S. Bio-based Polyvinyl Chloride (PVC) Market Estimates And Forecasts, By Application, 2018 - 2030 (Kilotons)
- Table 19 U.S. Bio-based Polyvinyl Chloride (PVC) Market Estimates And Forecasts, By Application, 2018 - 2030 (USD Million)
- Table 20 Canada Bio-based Polyvinyl Chloride (PVC) Market Estimates And Forecasts, 2018 - 2030 (Kilotons) (USD Million)
- Table 21 Canada Bio-based Polyvinyl Chloride (PVC) Market Estimates And Forecasts, By Product, 2018 - 2030 (Kilotons)
- Table 22 Canada Bio-based Polyvinyl Chloride (PVC) Market Estimates And Forecasts, By Product, 2018 - 2030 (USD Million)
- Table 23 Canada Bio-based Polyvinyl Chloride (PVC) Market Estimates And Forecasts, By Application, 2018 - 2030 (Kilotons)
- Table 24 Canada Bio-based Polyvinyl Chloride (PVC) Market Estimates And Forecasts, By Application, 2018 - 2030 (USD Million)
- Table 25 Mexico Bio-based Polyvinyl Chloride (PVC) Market Estimates And Forecasts, 2018 - 2030 (Kilotons) (USD Million)
- Table 26 Mexico Bio-based Polyvinyl Chloride (PVC) Market Estimates And Forecasts, By Product, 2018 - 2030 (Kilotons)
- Table 27 Mexico Bio-based Polyvinyl Chloride (PVC) Market Estimates And Forecasts, By Product, 2018 - 2030 (USD Million)
- Table 28 Mexico Bio-based Polyvinyl Chloride (PVC) Market Estimates And Forecasts, By Application, 2018 - 2030 (Kilotons)
- Table 29 Mexico Bio-based Polyvinyl Chloride (PVC) Market Estimates And Forecasts, By Application, 2018 - 2030 (USD Million)
- Table 30 Europe Bio-based Polyvinyl Chloride (PVC) Market Estimates And Forecasts, 2018 - 2030 (Kilotons) (USD Million)
- Table 31 Europe Bio-based Polyvinyl Chloride (PVC) Market Estimates And Forecasts, By Product, 2018 - 2030 (Kilotons)
- Table 32 Europe Bio-based Polyvinyl Chloride (PVC) Market Estimates And Forecasts, By Product, 2018 - 2030 (USD Million)
- Table 33 Europe Bio-based Polyvinyl Chloride (PVC) Market Estimates And Forecasts, By Application, 2018 - 2030 (Kilotons)
- Table 34 Europe Bio-based Polyvinyl Chloride (PVC) Market Estimates And Forecasts, By Application, 2018 - 2030 (USD Million)
- Table 35 Germany Bio-based Polyvinyl Chloride (PVC) Market Estimates And Forecasts, 2018 - 2030 (Kilotons) (USD Million)
- Table 36 Germany Bio-based Polyvinyl Chloride (PVC) Market Estimates And Forecasts, By Product, 2018 - 2030 (Kilotons)
- Table 37 Germany Bio-based Polyvinyl Chloride (PVC) Market Estimates And Forecasts, By Product, 2018 - 2030 (USD Million)
- Table 38 Germany Bio-based Polyvinyl Chloride (PVC) Market Estimates And Forecasts, By Application, 2018 - 2030 (Kilotons)
- Table 39 Germany Bio-based Polyvinyl Chloride (PVC) Market Estimates And Forecasts, By Application, 2018 - 2030 (USD Million)
- Table 40 UK Bio-based Polyvinyl Chloride (PVC) Market Estimates And Forecasts, 2018 - 2030 (Kilotons) (USD Million)
- Table 41 UK Bio-based Polyvinyl Chloride (PVC) Market Estimates And Forecasts, By Product, 2018 - 2030 (Kilotons)
- Table 42 UK Bio-based Polyvinyl Chloride (PVC) Market Estimates And Forecasts, By Product, 2018 - 2030 (USD Million)
- Table 43 UK Bio-based Polyvinyl Chloride (PVC) Market Estimates And Forecasts, By Application, 2018 - 2030 (Kilotons)
- Table 44 UK Bio-based Polyvinyl Chloride (PVC) Market Estimates And Forecasts, By Application, 2018 - 2030 (USD Million)
- Table 45 France Bio-based Polyvinyl Chloride (PVC) Market Estimates And Forecasts, 2018 - 2030 (Kilotons) (USD Million)
- Table 46 France Bio-based Polyvinyl Chloride (PVC) Market Estimates And Forecasts, By Product, 2018 - 2030 (Kilotons)
- Table 47 France Bio-based Polyvinyl Chloride (PVC) Market Estimates And Forecasts, By Product, 2018 - 2030 (USD Million)
- Table 48 France Bio-based Polyvinyl Chloride (PVC) Market Estimates And Forecasts, By Application, 2018 - 2030 (Kilotons)
- Table 49 France Bio-based Polyvinyl Chloride (PVC) Market Estimates And Forecasts, By Application, 2018 - 2030 (USD Million)
- Table 50 Italy Bio-based Polyvinyl Chloride (PVC) Market Estimates And Forecasts, 2018 - 2030 (Kilotons) (USD Million)
- Table 51 Italy Bio-based Polyvinyl Chloride (PVC) Market Estimates And Forecasts, By Product, 2018 - 2030 (Kilotons)
- Table 52 Italy Bio-based Polyvinyl Chloride (PVC) Market Estimates And Forecasts, By Product, 2018 - 2030 (USD Million)
- Table 53 Italy Bio-based Polyvinyl Chloride (PVC) Market Estimates And Forecasts, By Application, 2018 - 2030 (Kilotons)
- Table 54 Italy Bio-based Polyvinyl Chloride (PVC) Market Estimates And Forecasts, By Application, 2018 - 2030 (USD Million)
- Table 55 Spain Bio-based Polyvinyl Chloride (PVC) Market Estimates And Forecasts, 2018 - 2030 (Kilotons) (USD Million)
- Table 56 Spain Bio-based Polyvinyl Chloride (PVC) Market Estimates And Forecasts, By Product, 2018 - 2030 (Kilotons)
- Table 57 Spain Bio-based Polyvinyl Chloride (PVC) Market Estimates And Forecasts, By Product, 2018 - 2030 (USD Million)
- Table 58 Spain Bio-based Polyvinyl Chloride (PVC) Market Estimates And Forecasts, By Application, 2018 - 2030 (Kilotons)
- Table 59 Spain Bio-based Polyvinyl Chloride (PVC) Market Estimates And Forecasts, By Application, 2018 - 2030 (USD Million)
- Table 60 The Netherlands Bio-based Polyvinyl Chloride (PVC) Market Estimates And Forecasts, 2018 - 2030 (Kilotons) (USD Million)
- Table 61 The Netherlands Bio-based Polyvinyl Chloride (PVC) Market Estimates And Forecasts, By Product, 2018 - 2030 (Kilotons)
- Table 62 The Netherlands Bio-based Polyvinyl Chloride (PVC) Market Estimates And Forecasts, By Product, 2018 - 2030 (USD Million)
- Table 63 The Netherlands Bio-based Polyvinyl Chloride (PVC) Market Estimates And Forecasts, By Application, 2018 - 2030 (Kilotons)
- Table 64 The Netherlands Bio-based Polyvinyl Chloride (PVC) Market Estimates And Forecasts, By Application, 2018 - 2030 (USD Million)
- Table 65 Asia Pacific Bio-based Polyvinyl Chloride (PVC) Market Estimates And Forecasts, 2018 - 2030 (Kilotons) (USD Million)
- Table 66 Asia Pacific Bio-based Polyvinyl Chloride (PVC) Market Estimates And Forecasts, By Product, 2018 - 2030 (Kilotons)
- Table 67 Asia Pacific Bio-based Polyvinyl Chloride (PVC) Market Estimates And Forecasts, By Product, 2018 - 2030 (USD Million)
- Table 68 Asia Pacific Bio-based Polyvinyl Chloride (PVC) Market Estimates And Forecasts, By Application, 2018 - 2030 (Kilotons)
- Table 69 Asia Pacific Bio-based Polyvinyl Chloride (PVC) Market Estimates And Forecasts, By Application, 2018 - 2030 (USD Million)
- Table 70 China Bio-based Polyvinyl Chloride (PVC) Market Estimates And Forecasts, 2018 - 2030 (Kilotons) (USD Million)
- Table 71 China Bio-based Polyvinyl Chloride (PVC) Market Estimates And Forecasts, By Product, 2018 - 2030 (Kilotons)
- Table 72 China Bio-based Polyvinyl Chloride (PVC) Market Estimates And Forecasts, By Product, 2018 - 2030 (USD Million)
- Table 73 China Bio-based Polyvinyl Chloride (PVC) Market Estimates And Forecasts, By Application, 2018 - 2030 (Kilotons)
- Table 74 China Bio-based Polyvinyl Chloride (PVC) Market Estimates And Forecasts, By Application, 2018 - 2030 (USD Million)
- Table 75 India Bio-based Polyvinyl Chloride (PVC) Market Estimates And Forecasts, 2018 - 2030 (Kilotons) (USD Million)
- Table 76 India Bio-based Polyvinyl Chloride (PVC) Market Estimates And Forecasts, By Product, 2018 - 2030 (Kilotons)
- Table 77 India Bio-based Polyvinyl Chloride (PVC) Market Estimates And Forecasts, By Product, 2018 - 2030 (USD Million)
- Table 78 India Bio-based Polyvinyl Chloride (PVC) Market Estimates And Forecasts, By Application, 2018 - 2030 (Kilotons)
- Table 79 India Bio-based Polyvinyl Chloride (PVC) Market Estimates And Forecasts, By Application, 2018 - 2030 (USD Million)
- Table 80 Japan Bio-based Polyvinyl Chloride (PVC) Market Estimates And Forecasts, 2018 - 2030 (Kilotons) (USD Million)
- Table 81 Japan Bio-based Polyvinyl Chloride (PVC) Market Estimates And Forecasts, By Product, 2018 - 2030 (Kilotons)
- Table 82 Japan Bio-based Polyvinyl Chloride (PVC) Market Estimates And Forecasts, By Product, 2018 - 2030 (USD Million)
- Table 83 Japan Bio-based Polyvinyl Chloride (PVC) Market Estimates And Forecasts, By Application, 2018 - 2030 (Kilotons)
- Table 84 Japan Bio-based Polyvinyl Chloride (PVC) Market Estimates And Forecasts, By Application, 2018 - 2030 (USD Million)
- Table 85 South Korea Bio-based Polyvinyl Chloride (PVC) Market Estimates And Forecasts, 2018 - 2030 (Kilotons) (USD Million)
- Table 86 South Korea Bio-based Polyvinyl Chloride (PVC) Market Estimates And Forecasts, By Product, 2018 - 2030 (Kilotons)
- Table 87 South Korea Bio-based Polyvinyl Chloride (PVC) Market Estimates And Forecasts, By Product, 2018 - 2030 (USD Million)
- Table 88 South Korea Bio-based Polyvinyl Chloride (PVC) Market Estimates And Forecasts, By Application, 2018 - 2030 (Kilotons)
- Table 89 South Korea Bio-based Polyvinyl Chloride (PVC) Market Estimates And Forecasts, By Application, 2018 - 2030 (USD Million)
- Table 90 Australia Bio-based Polyvinyl Chloride (PVC) Market Estimates And Forecasts, 2018 - 2030 (Kilotons) (USD Million)
- Table 91 Australia Bio-based Polyvinyl Chloride (PVC) Market Estimates And Forecasts, By Product, 2018 - 2030 (Kilotons)
- Table 92 Australia Bio-based Polyvinyl Chloride (PVC) Market Estimates And Forecasts, By Product, 2018 - 2030 (USD Million)
- Table 93 Australia Bio-based Polyvinyl Chloride (PVC) Market Estimates And Forecasts, By Application, 2018 - 2030 (Kilotons)
- Table 94 Australia Bio-based Polyvinyl Chloride (PVC) Market Estimates And Forecasts, By Application, 2018 - 2030 (USD Million)
- Table 95 Thailand Bio-based Polyvinyl Chloride (PVC) Market Estimates And Forecasts, 2018 - 2030 (Kilotons) (USD Million)
- Table 96 Thailand Bio-based Polyvinyl Chloride (PVC) Market Estimates And Forecasts, By Product, 2018 - 2030 (Kilotons)
- Table 97 Thailand Bio-based Polyvinyl Chloride (PVC) Market Estimates And Forecasts, By Product, 2018 - 2030 (USD Million)
- Table 98 Thailand Bio-based Polyvinyl Chloride (PVC) Market Estimates And Forecasts, By Application, 2018 - 2030 (Kilotons)
- Table 99 Thailand Bio-based Polyvinyl Chloride (PVC) Market Estimates And Forecasts, By Application, 2018 - 2030 (USD Million)
- Table 100 Malaysia Bio-based Polyvinyl Chloride (PVC) Market Estimates And Forecasts, 2018 - 2030 (Kilotons) (USD Million)
- Table 101 Malaysia Bio-based Polyvinyl Chloride (PVC) Market Estimates And Forecasts, By Product, 2018 - 2030 (Kilotons)
- Table 102 Malaysia Bio-based Polyvinyl Chloride (PVC) Market Estimates And Forecasts, By Product, 2018 - 2030 (USD Million)
- Table 103 Malaysia Bio-based Polyvinyl Chloride (PVC) Market Estimates And Forecasts, By Application, 2018 - 2030 (Kilotons)
- Table 104 Malaysia Bio-based Polyvinyl Chloride (PVC) Market Estimates And Forecasts, By Application, 2018 - 2030 (USD Million)
- Table 105 Indonesia Bio-based Polyvinyl Chloride (PVC) Market Estimates And Forecasts, 2018 - 2030 (Kilotons) (USD Million)
- Table 106 Indonesia Bio-based Polyvinyl Chloride (PVC) Market Estimates And Forecasts, By Product, 2018 - 2030 (Kilotons)
- Table 107 Indonesia Bio-based Polyvinyl Chloride (PVC) Market Estimates And Forecasts, By Product, 2018 - 2030 (USD Million)
- Table 108 Indonesia Bio-based Polyvinyl Chloride (PVC) Market Estimates And Forecasts, By Application, 2018 - 2030 (Kilotons)
- Table 109 Indonesia Bio-based Polyvinyl Chloride (PVC) Market Estimates And Forecasts, By Application, 2018 - 2030 (USD Million)
- Table 110 Vietnam Bio-based Polyvinyl Chloride (PVC) Market Estimates And Forecasts, 2018 - 2030 (Kilotons) (USD Million)
- Table 111 Vietnam Bio-based Polyvinyl Chloride (PVC) Market Estimates And Forecasts, By Product, 2018 - 2030 (Kilotons)
- Table 112 Vietnam Bio-based Polyvinyl Chloride (PVC) Market Estimates And Forecasts, By Product, 2018 - 2030 (USD Million)
- Table 113 Vietnam Bio-based Polyvinyl Chloride (PVC) Market Estimates And Forecasts, By Application, 2018 - 2030 (Kilotons)
- Table 114 Vietnam Bio-based Polyvinyl Chloride (PVC) Market Estimates And Forecasts, By Application, 2018 - 2030 (USD Million)
- Table 115 Central & South America Bio-based Polyvinyl Chloride (PVC) Market Estimates And Forecasts, 2018 - 2030 (Kilotons) (USD Million)
- Table 116 Central & South America Bio-based Polyvinyl Chloride (PVC) Market Estimates And Forecasts, By Product, 2018 - 2030 (Kilotons)
- Table 117 Central & South America Bio-based Polyvinyl Chloride (PVC) Market Estimates And Forecasts, By Product, 2018 - 2030 (USD Million)
- Table 118 Central & South America Bio-based Polyvinyl Chloride (PVC) Market Estimates And Forecasts, By Application, 2018 - 2030 (Kilotons)
- Table 119 Central & South America Bio-based Polyvinyl Chloride (PVC) Market Estimates And Forecasts, By Application, 2018 - 2030 (USD Million)
- Table 120 Brazil Bio-based Polyvinyl Chloride (PVC) Market Estimates And Forecasts, 2018 - 2030 (Kilotons) (USD Million)
- Table 121 Brazil Bio-based Polyvinyl Chloride (PVC) Market Estimates And Forecasts, By Product, 2018 - 2030 (Kilotons)
- Table 122 Brazil Bio-based Polyvinyl Chloride (PVC) Market Estimates And Forecasts, By Product, 2018 - 2030 (USD Million)
- Table 123 Brazil Bio-based Polyvinyl Chloride (PVC) Market Estimates And Forecasts, By Application, 2018 - 2030 (Kilotons)
- Table 124 Brazil Bio-based Polyvinyl Chloride (PVC) Market Estimates And Forecasts, By Application, 2018 - 2030 (USD Million)
- Table 125 Argentina Bio-based Polyvinyl Chloride (PVC) Market Estimates And Forecasts, 2018 - 2030 (Kilotons) (USD Million)
- Table 126 Argentina Bio-based Polyvinyl Chloride (PVC) Market Estimates And Forecasts, By Product, 2018 - 2030 (Kilotons)
- Table 127 Argentina Bio-based Polyvinyl Chloride (PVC) Market Estimates And Forecasts, By Product, 2018 - 2030 (USD Million)
- Table 128 Argentina Bio-based Polyvinyl Chloride (PVC) Market Estimates And Forecasts, By Application, 2018 - 2030 (Kilotons)
- Table 129 Argentina Bio-based Polyvinyl Chloride (PVC) Market Estimates And Forecasts, By Application, 2018 - 2030 (USD Million)
- Table 130 Middle East & Africa Bio-based Polyvinyl Chloride (PVC) Market Estimates And Forecasts, 2018 - 2030 (Kilotons) (USD Million)
- Table 131 Middle East & Africa Bio-based Polyvinyl Chloride (PVC) Market Estimates And Forecasts, By Product, 2018 - 2030 (Kilotons)
- Table 132 Middle East & Africa Bio-based Polyvinyl Chloride (PVC) Market Estimates And Forecasts, By Product, 2018 - 2030 (USD Million)
- Table 133 Middle East & Africa Bio-based Polyvinyl Chloride (PVC) Market Estimates And Forecasts, By Application, 2018 - 2030 (Kilotons)
- Table 134 Middle East & Africa Bio-based Polyvinyl Chloride (PVC) Market Estimates And Forecasts, By Application, 2018 - 2030 (USD Million)
- Table 135 Saudi Arabia Bio-based Polyvinyl Chloride (PVC) Market Estimates And Forecasts, 2018 - 2030 (Kilotons) (USD Million)
- Table 136 Saudi Arabia Bio-based Polyvinyl Chloride (PVC) Market Estimates And Forecasts, By Product, 2018 - 2030 (Kilotons)
- Table 137 Saudi Arabia Bio-based Polyvinyl Chloride (PVC) Market Estimates And Forecasts, By Product, 2018 - 2030 (USD Million)
- Table 138 Saudi Arabia Bio-based Polyvinyl Chloride (PVC) Market Estimates And Forecasts, By Application, 2018 - 2030 (Kilotons)
- Table 139 Saudi Arabia Bio-based Polyvinyl Chloride (PVC) Market Estimates And Forecasts, By Application, 2018 - 2030 (USD Million)
- Table 140 UAE Bio-based Polyvinyl Chloride (PVC) Market Estimates And Forecasts, 2018 - 2030 (Kilotons) (USD Million)
- Table 141 UAE Bio-based Polyvinyl Chloride (PVC) Market Estimates And Forecasts, By Product, 2018 - 2030 (Kilotons)
- Table 142 UAE Bio-based Polyvinyl Chloride (PVC) Market Estimates And Forecasts, By Product, 2018 - 2030 (USD Million)
- Table 143 UAE Bio-based Polyvinyl Chloride (PVC) Market Estimates And Forecasts, By Application, 2018 - 2030 (Kilotons)
- Table 144 UAE Bio-based Polyvinyl Chloride (PVC) Market Estimates And Forecasts, By Application, 2018 - 2030 (USD Million)
- Table 145 South Africa Bio-based Polyvinyl Chloride (PVC) Market Estimates And Forecasts, 2018 - 2030 (Kilotons) (USD Million)
- Table 146 South Africa Bio-based Polyvinyl Chloride (PVC) Market Estimates And Forecasts, By Product, 2018 - 2030 (Kilotons)
- Table 147 South Africa Bio-based Polyvinyl Chloride (PVC) Market Estimates And Forecasts, By Product, 2018 - 2030 (USD Million)
- Table 148 South Africa Bio-based Polyvinyl Chloride (PVC) Market Estimates And Forecasts, By Application, 2018 - 2030 (Kilotons)
- Table 149 South Africa Bio-based Polyvinyl Chloride (PVC) Market Estimates And Forecasts, By Application, 2018 - 2030 (USD Million)
List of Figures
- Fig. 1 Bio-Based Polyvinyl Chloride (PVC) Market revenue, 2022 (USD Million)
- Fig. 2 Bio-Based Polyvinyl Chloride (PVC) Market Segmentation
- Fig. 3 Bio-Based Polyvinyl Chloride (PVC) Market volume & revenue, 2018 - 2030 (Kilotons) (USD Million)
- Fig. 4 Bio-Based Polyvinyl Chloride (PVC) Market driver impact Analysis
- Fig. 4 Bio-Based Polyvinyl Chloride (PVC) Market Restraint impact Analysis
- Fig. 5 Bio-Based Polyvinyl Chloride Market - Value Chain Analysis
- Fig. 6 Bio-Based Polyvinyl Chloride (PVC) Market - PESTLE
- Fig. 7 Bio-Based Polyvinyl Chloride PVC) Market - Porter's Five Forces Analysis
- Fig. 8 Bio-Based Polyvinyl Chloride (PVC) Market: Product movement analysis, 2022 & 2030
- Fig. 9 Bio-Based Polyvinyl Chloride (PVC) Market: Application movement analysis, 2022 & 2030
- Fig. 10 Bio-Based Polyvinyl Chloride (PVC) Market: Region movement analysis, 2022 & 2030
Bio-based Polyvinyl Chloride Market Growth & Trends:
The global bio-based polyvinyl chloride (PVC) market size is expected to reach USD 2,544.65 million by 2030, according to a new study by Grand View Research, Inc.. The market is expected to expand at a CAGR of 19.3% from 2023 to 2030. The bio-based polyvinyl chloride market is experiencing a notable trend towards sustainability and environmental responsibility. As global awareness of environmental issues continues to rise, there is a growing preference for eco-friendly materials.
Bio-based PVC, derived from renewable sources such as biomass and agricultural residues, aligns with this trend by offering a more sustainable alternative to traditional PVC, which relies on petroleum-based feedstocks. This trend is particularly evident in industries such as construction, automotive, and packaging, where bio-based PVC is being increasingly adopted to meet sustainability goals and consumer demands for greener products.
Government regulations and initiatives are also propelling the growth of the market for bio-based PVC. Many countries are implementing policies to reduce plastic waste and promote the use of sustainable materials. These regulations encourage businesses to invest in bio-based PVC as a means of meeting environmental standards and reducing their carbon footprint. Furthermore, R&D efforts in the bio-based PVC sector continue to advance, leading to improved product performance, cost-efficiency, and expanded applications. This technological progress is making bio-based PVC a more attractive choice for industries and is poised to drive further market growth.
Overall, the bio-based PVC market is poised for significant expansion over the forecast period. The convergence of consumer demand for sustainable products, supportive government policies, and ongoing innovations in bio-based PVC technology positions this market as a key player in the transition towards a more environment-conscious and responsible plastics industry.
Bio-based Polyvinyl Chloride Market Report Highlights:
- Asia Pacific was the dominating region in the global bio-based PVC market, accounting for more than 43.0% share of the overall revenue in 2022, which can be attributed to the region's robust industrial and construction sectors. The rapid urbanization, infrastructure development, and growing sustainability consciousness in countries like China and India have driven substantial demand for bio-based PVC in applications. Also, the availability of raw materials and government support for sustainable materials have driven the region's dominance in the market
- Rigid PVC is a major product in the global bio-based polyvinyl chloride market and accounted for more than 41.0% share of the overall revenue in 2022. The strong share can be attributed to its exceptional durability and versatility, making it an ideal choice for various industries. Its ability to withstand harsh conditions and resist corrosion, combined with its eco-friendly attributes as a bio-based material, aligns with sustainability goals and stringent environmental regulations, further boosting its market dominance
- The pipes and fittings segment was the dominating application in the global market for bio-based PVC and accounted for more than 31.0% share of the overall revenue in 2022, due to bio-based PVC's exceptional durability, resistance to corrosion, and eco-friendly nature, making it a preferred choice for various infrastructure and plumbing applications. The increasing focus on sustainable construction materials and regulations promoting environmentally responsible choices further propels the adoption of bio-based PVC in pipes and fittings
- In February 2021, Vinnolit, a subsidiary of Westlake Chemical Corporation, launched a bio-attributed polyvinyl chloride (PVC) with the brand name 'GreenVin', a lower-carbon alternative PVC that can be extensively utilized in the medical, automotive, and construction industries
Table of Contents
Chapter 1 Methodology And Scope
- 1.1 Market Segmentation & Scope
- 1.2 Market Definitions
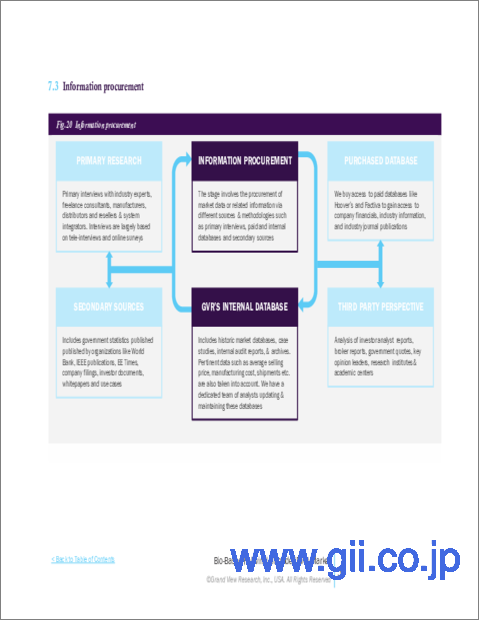
- 1.3 Information Procurement
- 1.3.1 Information Analysis
- 1.3.2 Market Formulation & Data Visualization
- 1.3.3 Data Validation & Publishing
- 1.4 Research Scope And Assumptions
- 1.4.1 List To Data Sources
Chapter 2 Executive Summary
- 2.1 Market Snapshot 2022
- 2.2 Segment Snapshot
- 2.3 Competitive Landscape Snapshot
Chapter 3 Bio-based Polyvinyl Chloride (PVC) Market: Variables And Trends
- 3.1 Market Lineage Outlook
- 3.1.1 Global Plastics Market
- 3.1.2 Global Bioplastics Market
- 3.2 Bio-based Polyvinyl Chloride (PVC) Market- Penetration & Growth Prospect Mapping
- 3.3 Industry Value Chain Analysis
- 3.3.1 Raw Material Trends
- 3.3.2 Raw Material Price Analysis
- 3.4 Technology Overview
- 3.4.1 Bio-based Polyvinyl Chloride (PVC) Market - Patent Analysis
- 3.5 Regulatory Framework
- 3.5.1 Standard & Compliances
- 3.5.2 Safety
- 3.6 Market Dynamics
- 3.6.1 Market Driver Impact Analysis
- 3.6.2 Market Restraint Impact Analysis
- 3.6.3 Market Challenges Analysis
- 3.6.4 Market Opportunity Analysis
- 3.7 Looming Inflation Concerns & Economic Slowdown And Its Impact On Market
- 3.8 Eastern Europe Geopolitical Conflict Impact
- 3.9 Industry Analysis Tools
- 3.9.1 Porter's Five Forces Analysis
- 3.9.2 Macroeconomic Analysis
Chapter 4 Bio-based Polyvinyl Chloride (PVC) Market: Product Estimates & Trend Analysis
- 4.1 Product Movement Analysis & Market Share, 2022 & 2030
- 4.2 Product Movement Analysis & Market Share, 2022 & 2030
- 4.3 Bio-based Polyvinyl Chloride (PVC) Market Estimates & Forecast, By Product (Kilotons) (USD Million)
- 4.3.1 Rigid
- 4.3.2 Flexible
Chapter 5 Bio-based Polyvinyl Chloride (PVC) Market: Application Estimates & Trend Analysis
- 5.1 Application Movement Analysis & Market Share, 2022 & 2030
- 5.2 Application Movement Analysis & Market Share, 2022 & 2030
- 5.3 Bio-based Polyvinyl Chloride (PVC) Market Estimates & Forecast, By Application (Kilotons) (USD Million)
- 5.3.1 Films And Sheets
- 5.3.2 Wires And Cables
- 5.3.3 Pipes And Fittings
- 5.3.4 Profiles/hoses/tubing
- 5.3.5 Edge Band
- 5.3.6 Others
Chapter 6 Bio-based Polyvinyl Chloride (PVC) Market: Regional Estimates & Trend Analysis
- 6.1 Bio-based Polyvinyl Chloride (PVC) Market: Regional Outlook
- 6.2 North America
- 6.2.1 North America Bio-based Polyvinyl Chloride (PVC) Market Estimates & Forecasts, 2018 - 2030 (Kilotons) (USD Million)
- 6.2.2 U.S.
- 6.2.2.1 U.S. Bio-based Polyvinyl Chloride (PVC) Market Estimates & Forecasts, 2018 - 2030 (Kilotons) (USD Million)
- 6.2.3 Canada
- 6.2.3.1 Canada Bio-based Polyvinyl Chloride (PVC) Market Estimates & Forecasts, 2018 - 2030 (Kilotons) (USD Million)
- 6.2.4 Mexico
- 6.2.4.1 Mexico Bio-based Polyvinyl Chloride (PVC) Market Estimates & Forecasts, 2018 - 2030 (Kilotons) (USD Million)
- 6.3 Europe
- 6.3.1 Europe Bio-based Polyvinyl Chloride (PVC) Market Estimates & Forecasts, 2018 - 2030 (Kilotons) (USD Million)
- 6.3.2 Germany
- 6.3.2.1 Germany Bio-based Polyvinyl Chloride (PVC) Market Estimates & Forecasts, 2018 - 2030 (Kilotons) (USD Million)
- 6.3.3 UK
- 6.3.3.1 UK Bio-based Polyvinyl Chloride (PVC) Market Estimates & Forecasts, 2018 - 2030 (Kilotons) (USD Million)
- 6.3.4 France
- 6.3.4.1 France Bio-based Polyvinyl Chloride (PVC) Market Estimates & Forecasts, 2018 - 2030 (Kilotons) (USD Million)
- 6.3.5 Italy
- 6.3.5.1 Italy Bio-based Polyvinyl Chloride (PVC) Market Estimates & Forecasts, 2018 - 2030 (Kilotons) (USD Million)
- 6.3.6 Spain
- 6.3.6.1 Spain Bio-based Polyvinyl Chloride (PVC) Market Estimates & Forecasts, 2018 - 2030 (Kilotons) (USD Million)
- 6.3.7 The Netherlands
- 6.3.7.1 The Netherlands Bio-based Polyvinyl Chloride (PVC) Market Estimates & Forecasts, 2018 - 2030 (Kilotons) (USD Million)
- 6.4 Asia Pacific
- 6.4.1 Asia Pacific Bio-based Polyvinyl Chloride (PVC) Market Estimates & Forecasts, 2018 - 2030 (Kilotons) (USD Million)
- 6.4.2 China
- 6.4.2.1 China Bio-based Polyvinyl Chloride (PVC) Market Estimates & Forecasts, 2018 - 2030 (Kilotons) (USD Million)
- 6.4.3 India
- 6.4.3.1 India Bio-based Polyvinyl Chloride (PVC) Market Estimates & Forecasts, 2018 - 2030 (Kilotons) (USD Million)
- 6.4.4 Japan
- 6.4.4.1 Japan Bio-based Polyvinyl Chloride (PVC) Market Estimates & Forecasts, 2018 - 2030 (Kilotons) (USD Million)
- 6.4.5 South Korea
- 6.4.5.1 South Korea Bio-based Polyvinyl Chloride (PVC) Market Estimates & Forecasts, 2018 - 2030 (Kilotons) (USD Million)
- 6.4.6 Australia
- 6.4.6.1 Australia Bio-based Polyvinyl Chloride (PVC) Market Estimates & Forecasts, 2018 - 2030 (Kilotons) (USD Million)
- 6.4.7 Thailand
- 6.4.7.1 Thailand Bio-based Polyvinyl Chloride (PVC) Market Estimates & Forecasts, 2018 - 2030 (Kilotons) (USD Million)
- 6.4.8 Malaysia
- 6.4.8.1 Malaysia Bio-based Polyvinyl Chloride (PVC) Market Estimates & Forecasts, 2018 - 2030 (Kilotons) (USD Million)
- 6.4.9 Indonesia
- 6.4.9.1 Indonesia Bio-based Polyvinyl Chloride (PVC) Market Estimates & Forecasts, 2018 - 2030 (Kilotons) (USD Million)
- 6.4.10 Vietnam
- 6.4.10.1 Vietnam Bio-based Polyvinyl Chloride (PVC) Market Estimates & Forecasts, 2018 - 2030 (Kilotons) (USD Million)
- 6.5 Central & South America
- 6.5.1 Central & South America Bio-based Polyvinyl Chloride (PVC) Market Estimates & Forecasts, 2018 - 2030 (Kilotons) (USD Million)
- 6.5.2 Brazil
- 6.5.2.1 Brazil Bio-based Polyvinyl Chloride (PVC) Market Estimates & Forecasts, 2018 - 2030 (Kilotons) (USD Million)
- 6.5.3 Argentina
- 6.5.3.1 Argentina Bio-based Polyvinyl Chloride (PVC) Market Estimates & Forecasts, 2018 - 2030 (Kilotons) (USD Million)
- 6.6 Middle East & Africa
- 6.6.1 Middle East & Africa Bio-based Polyvinyl Chloride (PVC) Market Estimates & Forecasts, 2018 - 2030 (Kilotons) (USD Million)
- 6.6.2 Saudi Arabia
- 6.6.2.1 Saudi Arabia Bio-based Polyvinyl Chloride (PVC) Market Estimates & Forecasts, 2018 - 2030 (Kilotons) (USD Million)
- 6.6.2 UAE
- 6.6.2.1 UAE Bio-based Polyvinyl Chloride (PVC) Market Estimates & Forecasts, 2018 - 2030 (Kilotons) (USD Million)
- 6.6.3 South Africa
- 6.6.3.1 South Africa Bio-based Polyvinyl Chloride (PVC) Market Estimates & Forecasts, 2018 - 2030 (Kilotons) (USD Million)
Chapter 7 Bio-based Polyvinyl Chloride (PVC) Market - Competitive Landscape
- 7.1 Recent Developments & Impact Analysis, By Key Market Participants
- 7.2 Company Categorization
- 7.3 Vendor Landscape
- 7.3.1 List Of Key Distributors & Channel Partners
- 7.3.2 List Of Key Potential Customers/end-users
- 7.4 Participant's Overview
- 7.5 Financial Performance
- 7.6 Product Benchmarking
- 7.7 Company Heat Map Analysis
- 7.8 Strategy Mapping
- 7.8.1 Expansion
- 7.8.2 Mergers & Acquisitions
- 7.8.3 Collaborations
- 7.8.4 New Application Launches
- 7.8.5 Research & Development
