|
|
市場調査レポート
商品コード
1363431
電子設計自動化(EDA)ソフトウェアの市場規模、シェア、動向分析レポート:製品別、展開別、最終用途別、地域別、セグメント別予測、2023年~2030年Electronic Design Automation Software Market Size, Share & Trends Analysis Report By Product, By Deployment, By Application, By End-use, By Region, And Segment Forecasts, 2023 - 2030 |
||||||
|
|
|||||||
|
● お客様のご希望に応じて、既存データの加工や未掲載情報(例:国別セグメント)の追加などの対応が可能です。 詳細はお問い合わせください。 |
|||||||


| 電子設計自動化(EDA)ソフトウェアの市場規模、シェア、動向分析レポート:製品別、展開別、最終用途別、地域別、セグメント別予測、2023年~2030年 |
|
出版日: 2023年09月07日
発行: Grand View Research
ページ情報: 英文 150 Pages
納期: 2~10営業日
|
- 全表示
- 概要
- 図表
- 目次
電子設計自動化(EDA)ソフトウェア市場の成長と動向:
Grand View Research, Inc.の最新調査によると、電子設計自動化(EDA)ソフトウェアの世界市場規模は、2023年から2030年にかけてCAGR 9.1%で拡大し、2030年には222億1,000万米ドルに達すると予測されています。
ヘルスケア、自動車、コンシューマーエレクトロニクスなど、さまざまな分野で高度な電子部品の利用が拡大していることが、EDA(Electronic Design Automation)ソフトウェア市場の成長を後押ししています。これとは別に、モノのインターネット(IoT)とコネクテッドデバイスの普及がEDAソフトウェア市場の進展をさらに促進しています。
デバイスやチップの小型化は、EDAソフトウェアに有利な機会をもたらすと期待されています。このソフトウェアは、集積回路(IC)やチップのエラーを減らすためにチップメーカーを支援し、それによって電子設計自動化(EDA)ソフトウェア業界の成長を推進しています。集積回路市場の急激な成長が、電子設計自動化(EDA)ソフトウェアの必要性を高めています。このソフトウェアは、プリント基板や集積回路などの電子システムの設計に採用されることが増えており、EDA市場の成長を支えています。
さらに、技術の発展、デジタル化の進展、エレクトロニクス製造業の成長、ハードウェア設計者による高度なレンダリング&シミュレーションツールの採用増加などが、予測期間中の電子設計自動化(EDA)ソフトウェア産業の成長にプラスの影響を与えると予想されます。さらに、スマートフィットネスデバイスの普及と認知度の向上は、電子設計企業がより高性能でコンパクトな製品を設計するための革新的な設計ソフトウェアツールに投資する要因となっており、予測期間中のEDAソフトウェア市場の成長を後押ししています。
EDAソフトウェアに対する需要の高まりは、電子設計自動化(EDA)ソフトウェア市場でより高い収益性を達成するために、様々なビジネス戦略を採用することを様々な市場プレーヤーに促しています。市場プレーヤーは、自社のブランドアイデンティティを向上させるために技術プロバイダーと提携することで新しいソリューションを発表し、EDAソフトウェア市場の成長を促進しています。例えば、アルティウムLLCは2022年1月、米国を拠点とする電子製造向けクラウドプラットフォームプロバイダーのマクロファブ社との提携を発表し、"Altimade"を発表しました。この新しいソリューションは、Altium 365電子設計プラットフォームで利用できる弾力的な製造機能とリアルタイムのサプライチェーンデータを組み合わせたものです。Altimadeにより、顧客は設計環境を離れることなく、PCBアセンブリの製造のために即座に見積もりを要求し、発注することができます。
電子設計自動化(EDA)ソフトウェア市場レポートハイライト
- サービス分野は、2023年から2030年にかけてCAGR 10.6%を記録すると予測されます。このセグメントの成長は、設計ニーズをアウトソーシングするOEMの傾向が強まっていることに起因しています。さらに、電子回路基板は、携帯電話やタブレット端末など、さまざまな重要な電子製品で重要性が増しているため、業界で高い需要があります。
- クラウド分野は、2023年から2030年にかけてCAGR 10.8%を記録すると予想されています。クラウドベースの展開により、迅速な配布、メンテナンスの軽減、コストの削減、拡張性の向上が可能になります。
- ヘルスケア分野は、2023年から2030年にかけてCAGR 11.5%の成長が見込まれます。同分野の成長は、ヘルスケアにおけるEDAソフトウェアのメリットであるコスト削減、患者転帰の改善、設計・開発の迅速化、医療機器の規制対応、医療機器のシミュレーションとテストなどに起因しています。
- マイクロプロセッサ&コントローラ分野は、2023年から2030年にかけてCAGR 9.5%を記録すると予測されています。スマートフォン、パーソナルコンピュータ(PC)、ノートPCなどの消費者向け機器におけるマイクロプロセッサの使用の増加が、同分野の世界需要を牽引すると予想されます。
- アジア太平洋地域はCAGR 9.6%で予測期間中に最も急成長する地域になると予測されています。電子機器需要の急増と中華圏における主要電子部品メーカーの普及が、同地域の成長を牽引すると予想されます。
目次
第1章 調査手法と範囲
第2章 エグゼクティブサマリー
第3章 電子設計自動化(EDA)ソフトウェア市場変数、動向および範囲
- 市場系統の見通し
- 業界のバリューチェーン分析
- 市場力学
- 市場促進要因の分析
- 市場の抑制要因/課題の分析
- 市場機会分析
- ビジネス環境分析ツール
- ポーターのファイブフォース分析
- PEST分析
- COVID-19の影響分析
第4章 電子設計自動化(EDA)ソフトウェア市場:製品別展望
- 電子設計自動化
- コンピュータ支援エンジニアリング(CAE)
- ICの物理設計と検証
- プリント基板およびマルチチップモジュール(PCBおよびMCM)
- 半導体知的財産(SIP)
- サービス
第5章 電子設計自動化(EDA)ソフトウェア市場:展開別見通し
- 電子設計自動化
- クラウド
- オンプレミス
第6章 電子設計自動化(EDA)ソフトウェア市場:用途別展望
- 電子設計自動化
- 航空宇宙と防衛
- 自動車
- ヘルスケア
- 産業用
- その他
第7章 電子設計自動化(EDA)ソフトウェア市場:最終用途別見通し
- 電子設計自動化
- マイクロプロセッサーとコントローラー
- メモリ管理ユニット(MMU)
- その他
第8章 電子設計自動化(EDA)ソフトウェア市場:地域別展望
- 電子設計の自動化
- 北米
- 市場推計・予測、2018~2030年
- 製品別、2018~2030年
- 展開別、2018~2030年
- 用途別、2018年~2030年
- 最終用途別、2018~2030年
- 米国
- カナダ
- 欧州
- 市場推計・予測、2018~2030年
- 製品別、2018~2030年
- 展開別、2018~2030年
- 用途別、2018年~2030年
- 最終用途別、2018~2030年
- 英国
- ドイツ
- フランス
- イタリア
- スペイン
- アジア太平洋地域
- 市場推計・予測、2018~2030年
- 製品別、2018~2030年
- 展開別、2018~2030年
- 用途別、2018年~2030年
- 最終用途別、2018~2030年
- 中国
- インド
- 日本
- オーストラリア
- 韓国
- ラテンアメリカ
- 市場推計・予測、2018~2030年
- 製品別、2018~2030年
- 展開別、2018~2030年
- 用途別、2018年~2030年
- 最終用途別、2018~2030年
- ブラジル
- メキシコ
- アルゼンチン
- 中東とアフリカ
- 市場推計・予測、2018~2030年
- 製品別、2018~2030年
- 展開別、2018~2030年
- 用途別、2018年~2030年
- 最終用途別、2018~2030年
- アラブ首長国連邦
- サウジアラビア
- 南アフリカ
第9章 競合情勢
- 企業の分類(成熟企業、新興企業)
- 企業ランキング/シェア分析、2022年
- 戦略マッピング
- 企業プロファイル(会社概要、業績、製品概要、戦略的取り組み)
- Advanced Micro Devices, Inc.
- Aldec, Inc.
- Altair Engineering Inc.
- Altium LLC
- Autodesk, Inc.
- ANSYS, Inc.
- Cadence Design Systems, Inc.
- eInfochips
- EMA Design Automation, Inc.
- Keysight Technologies
- Microsemi
- Synopsys, Inc.
- Silvaco, Inc.
- The MathWorks, Inc.
- Vennsa Technologies
- Zuken
List of Tables
- Table 1. List of Abbreviation
- Table 2. Electronic Design Automation (EDA) Software Market, 2018 - 2030 (USD Billion)
- Table 3. Electronic Design Automation (EDA) Software Market, by product, 2018 - 2030 (USD Billion)
- Table 4. Global Electronic Design Automation (EDA) Software Market, by deployment, 2018 - 2030 (USD Billion)
- Table 5. Global Electronic Design Automation (EDA) Software Market, by application, 2018 - 2030 (USD Billion)
- Table 6. Global Electronic Design Automation (EDA) Software Market, by end use, 2018 - 2030 (USD Billion)
- Table 7. North America Electronic Design Automation (EDA) Software Market, by product 2018 - 2030 (USD Billion)
- Table 8. North America Electronic Design Automation (EDA) Software Market, by deployment 2018 - 2030 (USD Billion)
- Table 9. North America Electronic Design Automation (EDA) Software Market, by application 2018 - 2030 (USD Billion)
- Table 10. North America Electronic Design Automation (EDA) Software Market, by end - use, 2018 - 2030 (USD Billion)
- Table 11. U.S. Electronic Design Automation (EDA) Software Market, by product 2018 - 2030 (USD Billion)
- Table 12. U.S. Electronic Design Automation (EDA) Software Market, by deployment 2018 - 2030 (USD Billion)
- Table 13. U.S. Electronic Design Automation (EDA) Software Market, by application 2018 - 2030 (USD Billion)
- Table 14. U.S. Electronic Design Automation (EDA) Software Market, by end use, 2018 - 2030 (USD Billion)
- Table 15. Canada Electronic Design Automation (EDA) Software Market, by product 2018 - 2030 (USD Billion)
- Table 16. Canada Electronic Design Automation (EDA) Software Market, by deployment 2018 - 2030 (USD Billion)
- Table 17. Canada Electronic Design Automation (EDA) Software Market, by application 2018 - 2030 (USD Billion)
- Table 18. Canada Electronic Design Automation (EDA) Software Market, by end use, 2018 - 2030 (USD Billion)
- Table 19. Europe Electronic Design Automation (EDA) Software Market, by product 2018 - 2030 (USD Billion)
- Table 20. Europe Electronic Design Automation (EDA) Software Market, by deployment 2018 - 2030 (USD Billion)
- Table 21. Europe Electronic Design Automation (EDA) Software Market, by application 2018 - 2030 (USD Billion)
- Table 22. Europe Electronic Design Automation (EDA) Software market, by end use, 2018 - 2030 (USD Billion)
- Table 23. U.K. Electronic Design Automation (EDA) Software Market, by product 2018 - 2030 (USD Billion)
- Table 24. U.K. Electronic Design Automation (EDA) Software Market, by deployment 2018 - 2030 (USD Billion)
- Table 25. U.K. Electronic Design Automation (EDA) Software Market, by application 2018 - 2030 (USD Billion)
- Table 26. U.K. Electronic Design Automation (EDA) Software Market, by end use, 2018 - 2030 (USD Billion)
- Table 27. Germany Electronic Design Automation (EDA) Software Market, by product 2018 - 2030 (USD Billion)
- Table 28. Germany Electronic Design Automation (EDA) Software Market, by deployment 2018 - 2030 (USD Billion)
- Table 29. Germany Electronic Design Automation (EDA) Software Market, by application 2018 - 2030 (USD Billion)
- Table 30. Germany Electronic Design Automation (EDA) Software Market, by end use, 2018 - 2030 (USD Billion)
- Table 31. France Electronic Design Automation (EDA) Software Market, by product 2018 - 2030 (USD Billion)
- Table 32. France Electronic Design Automation (EDA) Software Market, by deployment 2018 - 2030 (USD Billion)
- Table 33. France Electronic Design Automation (EDA) Software Market, by application 2018 - 2030 (USD Billion)
- Table 34. France Electronic Design Automation (EDA) Software Market, by end use, 2018 - 2030 (USD Billion)
- Table 35. Italy Electronic Design Automation (EDA) Software Market, by product 2018 - 2030 (USD Billion)
- Table 36. Italy Electronic Design Automation (EDA) Software Market, by deployment 2018 - 2030 (USD Billion)
- Table 37. Italy Electronic Design Automation (EDA) Software Market, by application 2018 - 2030 (USD Billion)
- Table 38. Italy Electronic Design Automation (EDA) Software Market, by end use, 2018 - 2030 (USD Billion)
- Table 39. Spain Electronic Design Automation (EDA) Software Market, by product 2018 - 2030 (USD Billion)
- Table 40. Spain Electronic Design Automation (EDA) Software Market, by deployment 2018 - 2030 (USD Billion)
- Table 41. Spain Electronic Design Automation (EDA) Software Market, by application 2018 - 2030 (USD Billion)
- Table 42. Spain Electronic Design Automation (EDA) Software Market, by end use, 2018 - 2030 (USD Billion)
- Table 43. Asia Pacific Electronic Design Automation (EDA) Software Market, by product 2018 - 2030 (USD Billion)
- Table 44. Asia Pacific Electronic Design Automation (EDA) Software Market, by deployment 2018 - 2030 (USD Billion)
- Table 45. Asia Pacific Electronic Design Automation (EDA) Software Market, by application 2018 - 2030 (USD Billion)
- Table 46. Asia Pacific Electronic Design Automation (EDA) Software Market, by end use, 2018 - 2030 (USD Billion)
- Table 47. China Electronic Design Automation (EDA) Software Market, by product 2018 - 2030 (USD Billion)
- Table 48. China Electronic Design Automation (EDA) Software Market, by deployment 2018 - 2030 (USD Billion)
- Table 49. China Electronic Design Automation (EDA) Software Market, by application 2018 - 2030 (USD Billion)
- Table 50. China Electronic Design Automation (EDA) Software Market, by end use, 2018 - 2030 (USD Billion)
- Table 51. India Electronic Design Automation (EDA) Software Market, by product 2018 - 2030 (USD Billion)
- Table 52. India Electronic Design Automation (EDA) Software Market, by deployment 2018 - 2030 (USD Billion)
- Table 53. India Electronic Design Automation (EDA) Software Market, by application 2018 - 2030 (USD Billion)
- Table 54. India Electronic Design Automation (EDA) Software Market, by end use, 2018 - 2030 (USD Billion)
- Table 55. Japan Electronic Design Automation (EDA) Software Market, by product 2018 - 2030 (USD Billion)
- Table 56. Japan Electronic Design Automation (EDA) Software Market, by deployment 2018 - 2030 (USD Billion)
- Table 57. Japan Electronic Design Automation (EDA) Software Market, by application 2018 - 2030 (USD Billion)
- Table 58. Japan Electronic Design Automation (EDA) Software Market, by end use, 2018 - 2030 (USD Billion)
- Table 59. Australia Electronic Design Automation (EDA) Software Market, by product 2018 - 2030 (USD Billion)
- Table 60. Australia Electronic Design Automation (EDA) Software Market, by deployment 2018 - 2030 (USD Billion)
- Table 61. Australia Electronic Design Automation (EDA) Software Market, by application 2018 - 2030 (USD Billion)
- Table 62. Australia Electronic Design Automation (EDA) Software Market, by end use, 2018 - 2030 (USD Billion)
- Table 63. South Korea Electronic Design Automation (EDA) Software Market, by product 2018 - 2030 (USD Billion)
- Table 64. South Korea Electronic Design Automation (EDA) Software Market, by deployment 2018 - 2030 (USD Billion)
- Table 65. South Korea Electronic Design Automation (EDA) Software Market, by application 2018 - 2030 (USD Billion)
- Table 66. South Korea Electronic Design Automation (EDA) Software Market, by end use, 2018 - 2030 (USD Billion)
- Table 67. Latin America Electronic Design Automation (EDA) Software Market, by product 2018 - 2030 (USD Billion)
- Table 68. Latin America Electronic Design Automation (EDA) Software Market, by deployment 2018 - 2030 (USD Billion)
- Table 69. Latin America Electronic Design Automation (EDA) Software Market, by application 2018 - 2030 (USD Billion)
- Table 70. Latin America Electronic Design Automation (EDA) Software Market, by end use, 2018 - 2030 (USD Billion)
- Table 71. Brazil Electronic Design Automation (EDA) Software Market, by product 2018 - 2030 (USD Billion)
- Table 72. Brazil Electronic Design Automation (EDA) Software Market, by deployment 2018 - 2030 (USD Billion)
- Table 73. Brazil Electronic Design Automation (EDA) Software Market, by application 2018 - 2030 (USD Billion)
- Table 74. Brazil Electronic Design Automation (EDA) Software Market, by end use, 2018 - 2030 (USD Billion)
- Table 75. Mexico Electronic Design Automation (EDA) Software Market, by product 2018 - 2030 (USD Billion)
- Table 76. Mexico Electronic Design Automation (EDA) Software Market, by deployment 2018 - 2030 (USD Billion)
- Table 77. Mexico Electronic Design Automation (EDA) Software Market, by application 2018 - 2030 (USD Billion)
- Table 78. Mexico Electronic Design Automation (EDA) Software Market, by end use, 2018 - 2030 (USD Billion)
- Table 79. Argentina Electronic Design Automation (EDA) Software Market, by product 2018 - 2030 (USD Billion)
- Table 80. Argentina Electronic Design Automation (EDA) Software Market, by deployment 2018 - 2030 (USD Billion)
- Table 81. Argentina Electronic Design Automation (EDA) Software Market, by application 2018 - 2030 (USD Billion)
- Table 82. Argentina Electronic Design Automation (EDA) Software Market, by end use, 2018 - 2030 (USD Billion)
- Table 83. MEA Electronic Design Automation (EDA) Software Market, by product 2018 - 2030 (USD Billion)
- Table 84. MEA Electronic Design Automation (EDA) Software Market, by deployment 2018 - 2030 (USD Billion)
- Table 85. MEA Electronic Design Automation (EDA) Software Market, by application 2018 - 2030 (USD Billion)
- Table 86. MEA Electronic Design Automation (EDA) Software Market, by end use, 2018 - 2030 (USD Billion)
- Table 87. UAE Electronic Design Automation (EDA) Software Market, by product 2018 - 2030 (USD Billion)
- Table 88. UAE Electronic Design Automation (EDA) Software Market, by deployment 2018 - 2030 (USD Billion)
- Table 89. UAE Electronic Design Automation (EDA) Software Market, by application 2018 - 2030 (USD Billion)
- Table 90. UAE Electronic Design Automation (EDA) Software Market, by end use, 2018 - 2030 (USD Billion)
- Table 91. Saudi Arabia Electronic Design Automation (EDA) Software Market, by product 2018 - 2030 (USD Billion)
- Table 92. Saudi Arabia Electronic Design Automation (EDA) Software Market, by deployment 2018 - 2030 (USD Billion)
- Table 93. Saudi Arabia Electronic Design Automation (EDA) Software Market, by application 2018 - 2030 (USD Billion)
- Table 94. Saudi Arabia Electronic Design Automation (EDA) Software Market, by end use, 2018 - 2030 (USD Billion)
- Table 95. South Africa Electronic Design Automation (EDA) Software Market, by product 2018 - 2030 (USD Billion)
- Table 96. South Africa Electronic Design Automation (EDA) Software Market, by deployment 2018 - 2030 (USD Billion)
- Table 97. South Africa Electronic Design Automation (EDA) Software Market, by application 2018 - 2030 (USD Billion)
- Table 98. South Africa Electronic Design Automation (EDA) Software Market, by end use, 2018 - 2030 (USD Billion)
List of Figures
- Fig. 1 Electronic Design Automation (EDA) Software Market Segmentation
- Fig. 2 Research Methodology
- Fig. 3 Primary Research Pattern
- Fig. 4 Information Analysis
- Fig. 5 Data Analysis Model
- Fig. 6 Data Validation & Publishing
- Fig. 7 Electronic Design Automation (EDA) Software: Market Snapshot
- Fig. 8 Electronic Design Automation (EDA) Software Market Penetration and Growth Prospects Mapping
- Fig. 9 Electronic Design Automation (EDA) Software Market: Value Chain Analysis
- Fig. 10 Market Driver Analysis
- Fig. 11 Market Restraint Analysis
- Fig. 12 Market Challenge Analysis
- Fig. 13 Electronic Design Automation (EDA) Software Market: Porter's Five Forces Analysis
- Fig. 14 Electronic Design Automation (EDA) Software Market: PEST Analysis
- Fig. 15 Electronic Design Automation (EDA) Software Market Analysis: Product Segment Analysis, 2022 & 2030
- Fig. 16 Electronic Design Automation (EDA) Software Market Analysis: Deployment Segment Analysis, 2022 & 2030
- Fig. 17 Electronic Design Automation (EDA) Software Market Analysis: Application Segment Analysis, 2022 & 2030
- Fig. 18 Electronic Design Automation (EDA) Software Market Analysis: End-Use Segment Analysis, 2022 & 2030
Electronic Design Automation Software Market Growth & Trends:
The global electronic design automation software market size is anticipated to reach USD 22.21 billion by 2030, expanding at a CAGR of 9.1% from 2023 to 2030, according to a new study by Grand View Research, Inc.. The growing usage of advanced electronic components across different areas of healthcare, automotive, and consumer electronic sectors is driving Electronic Design Automation (EDA) software market growth. Apart from this, the proliferation of the Internet of Things (IoT) and connected devices further promotes EDA software market advancement.
Miniaturization of devices and chips is expected to create lucrative opportunities for EDA software. This software assists chipmakers in lowering the errors in Integrated Circuit (IC) and chips, thereby driving the electronic design automation software industry growth. The exponential growth of the integrated circuits market is driving the need for electronic design automation software. The software is increasingly being adopted for designing electronic systems such as printed circuit boards and integrated circuits, supporting the growth of the EDA market.
Furthermore, developments in technology, growing digitization, growth of the electronics manufacturing industry, and increasing adoption of advanced rendering & simulation tools by hardware designers are expected to positively influence the electronic design automation software industry growth over the forecast period. Furthermore, the increasing acceptance and awareness of smart fitness devices are factors enabling electronic design companies to invest in innovative design software tools for designing enhanced & compact products, thereby propelling the EDA software market growth over the forecast period.
Growing demand for EDA software is encouraging various market players to adopt various business strategies to achieve higher profitability in the market for electronic design automation software. Market players are unveiling new solutions by partnering with technology providers to improve their brand identity, propelling the EDA software market growth. For instance, in January 2022, Altium LLC announced a partnership with MacroFab, Inc., a U.S.-based cloud platform provider for electronic production, to launch "Altimade." The new solution combines elastic manufacturing capabilities and real-time supply chain data, available on the Altium 365 electronic design platform. Altimade empowers customers to request instant quotes and place orders for manufacturing their PCB assembly without exiting the design environment.
Electronic Design Automation Software Market Report Highlights:
- The services segment is expected to register a CAGR of 10.6% from 2023 to 2030. The segment growth can be attributed to the increasing proclivity of OEMs to outsource their design needs. Furthermore, electronic circuit boards are in high demand in the industry due to their increasing importance in a variety of vital electronic products such as mobile phones and tablets
- The cloud segment is expected to register a CAGR of 10.8% from 2023 to 2030. Cloud-based deployment allows for faster distribution, less maintenance, lower costs, and more scalability
- The healthcare segment is expected to register a CAGR of 11.5% from 2023 to 2030. The segment growth can be attributed to the benefits of EDA software in healthcare, such as lower costs, improved patient outcomes, faster design & development, enabled regulatory compliance of medical devices, and simulation and testing of medical equipment
- The microprocessors & controllers segment is expected to register a CAGR of 9.5% from 2023 to 2030. The increased use of microprocessors in consumer devices such as smartphones, personal computers (PCs), and laptops is expected to drive global demand for the segment
- Asia Pacific is anticipated to emerge as the fastest-growing region over the forecast period at a CAGR of 9.6%. A surge in demand for electronic devices together with the prevalence of key electronic component manufacturers in Greater China is expected to drive regional growth
Table of Contents
Chapter 1. Methodology and Scope
- 1.1. Methodology Segmentation & Scope
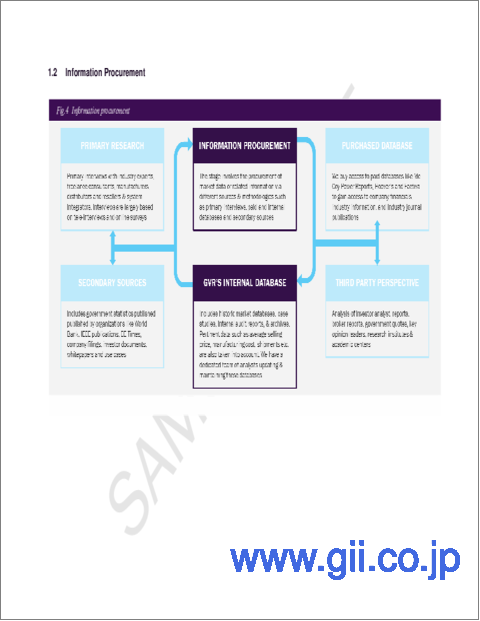
- 1.2. Information procurement
- 1.2.1. Purchased database
- 1.2.2. GVR's internal database
- 1.2.3. Secondary sources & third-party perspectives
- 1.2.4. Primary research
- 1.3. Information analysis
- 1.3.1. Data analysis models
- 1.4. Market formulation & data visualization
- 1.5. Data validation & publishing
Chapter 2. Executive Summary
- 2.1. Electronic Design Automation (EDA) Software Market - Market Snapshot, 2018 - 2030
- 2.2. Electronic Design Automation (EDA) Software Market - Product Snapshot, 2018 - 2030
- 2.3. Electronic Design Automation (EDA) Software Market - Deployment Snapshot, 2018 - 2030
- 2.4. Electronic Design Automation (EDA) Software Market - Application Snapshot, 2018 - 2030
- 2.5. Electronic Design Automation (EDA) Software Market - End-use Snapshot, 2018 - 2030
- 2.6. Electronic Design Automation (EDA) Software Market - Competitive Snapshot
Chapter 3. Electronic Design Automation Software (EDA) Market Variables, Trends & Scope
- 3.1. Market Lineage Outlook
- 3.2. Industry Value Chain Analysis
- 3.3. Market Dynamics
- 3.3.1. Market Driver Analysis
- 3.3.2. Market Restraint/Challenge Analysis
- 3.3.3. Market Opportunity Analysis
- 3.4. Business Environment Analysis Tools
- 3.4.1. Porter's Five Forces Analysis
- 3.4.2. PEST Analysis
- 3.5. COVID-19 Impact Analysis
Chapter 4. Electronic Design Automation (EDA) Software Market: Product Outlook
- 4.1. Electronic Design Automation (EDA) Software Market Share by Product, 2022 & 2030 (USD Billion)
- 4.2. Computer-aided Engineering (CAE)
- 4.2.1. Market size estimates and forecasts, 2018 - 2030 (USD Billion)
- 4.3. IC Physical Design and Verification
- 4.3.1. Market estimates and forecast, 2018 - 2030 (USD Billion)
- 4.4. Printed Circuit Board and Multi-chip Module (PCB and MCM)
- 4.4.1. Market estimates and forecast, 2018 - 2030 (USD Billion)
- 4.5. Semiconductor Intellectual Property (SIP)
- 4.5.1. Market estimates and forecast, 2018 - 2030 (USD Billion)
- 4.6. Services
- 4.6.1. Market estimates and forecast, 2018 - 2030 (USD Billion)
Chapter 5. Electronic Design Automation (EDA) Software Market: Deployment Outlook
- 5.1. Electronic Design Automation (EDA) Software Market Share by Deployment, 2022 & 2030 (USD Billion)
- 5.2. Cloud
- 5.2.1. Market size estimates and forecasts, 2018 - 2030 (USD Billion)
- 5.3. On-premise
- 5.3.1. Market estimates and forecast, 2018 - 2030 (USD Billion)
Chapter 6. Electronic Design Automation (EDA) Software Market: Application Outlook
- 6.1. Electronic Design Automation (EDA) Software Market Share by Application, 2022 & 2030 (USD Billion)
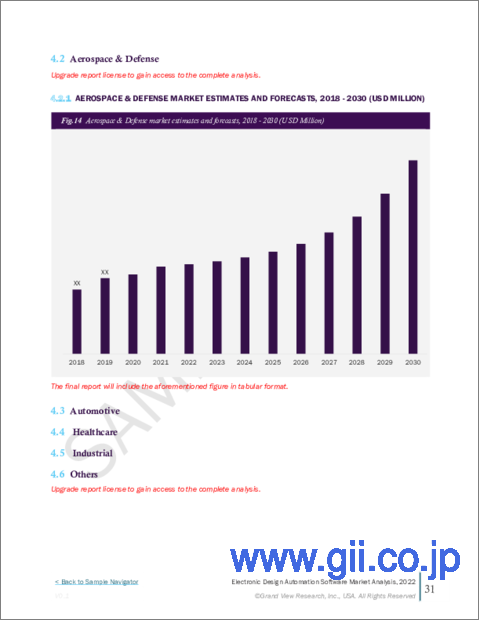
- 6.2. Aerospace and Defense
- 6.2.1. Market size estimates and forecasts, 2018 - 2030 (USD Billion)
- 6.3. Automotive
- 6.3.1. Market estimates and forecast, 2018 - 2030 (USD Billion)
- 6.4. Healthcare
- 6.4.1. Market estimates and forecast, 2018 - 2030 (USD Billion)
- 6.5. Industrial
- 6.5.1. Market estimates and forecast, 2018 - 2030 (USD Billion)
- 6.6. Others
- 6.6.1. Market estimates and forecast, 2018 - 2030 (USD Billion)
Chapter 7. Electronic Design Automation (EDA) Software Market: End-use Outlook
- 7.1. Electronic Design Automation (EDA) Software Market Share by End-use, 2022 & 2030 (USD Billion)
- 7.2. Microprocessors & Controllers
- 7.2.1. Market size estimates and forecasts, 2018 - 2030 (USD Billion)
- 7.3. Memory Management Unit (MMU)
- 7.3.1. Market estimates and forecast, 2018 - 2030 (USD Billion)
- 7.4. Others
- 7.4.1. Market estimates and forecast, 2018 - 2030 (USD Billion)
Chapter 8. Electronic Design Automation (EDA) Software Market: Regional Outlook
- 8.1. Electronic Design Automation (EDA) Software Market Share by Region, 2022 & 2030 (USD Billion)
- 8.2. North America
- 8.2.1. Market estimates and forecast, 2018 - 2030 (USD Billion)
- 8.2.2. Market estimates and forecast by product, 2018 - 2030 (USD Billion)
- 8.2.3. Market estimates and forecast by deployment, 2018 - 2030 (USD Billion)
- 8.2.4. Market estimates and forecast by application, 2018 - 2030 (USD Billion)
- 8.2.5. Market estimates and forecast by end-use, 2018 - 2030 (USD Billion)
- 8.2.6. U.S.
- 8.2.6.1. Market estimates and forecast, 2018 - 2030 (USD Billion)
- 8.2.6.2. Market estimates and forecast by product, 2018 - 2030 (USD Billion)
- 8.2.6.3. Market estimates and forecast by deployment, 2018 - 2030 (USD Billion)
- 8.2.6.4. Market estimates and forecast by application, 2018 - 2030 (USD Billion)
- 8.2.6.5. Market estimates and forecast by end-use, 2018 - 2030 (USD Billion)
- 8.2.7. Canada
- 8.2.7.1. Market estimates and forecast, 2018 - 2030 (USD Billion)
- 8.2.7.2. Market estimates and forecast by product, 2018 - 2030 (USD Billion)
- 8.2.7.3. Market estimates and forecast by deployment, 2018 - 2030 (USD Billion)
- 8.2.7.4. Market estimates and forecast by application, 2018 - 2030 (USD Billion)
- 8.2.7.5. Market estimates and forecast by end-use, 2018 - 2030 (USD Billion)
- 8.3. Europe
- 8.3.1. Market estimates and forecast, 2018 - 2030 (USD Billion)
- 8.3.2. Market estimates and forecast by product, 2018 - 2030 (USD Billion)
- 8.3.3. Market estimates and forecast by deployment, 2018 - 2030 (USD Billion)
- 8.3.4. Market estimates and forecast by application, 2018 - 2030 (USD Billion)
- 8.3.5. Market estimates and forecast by end-use, 2018 - 2030 (USD Billion)
- 8.3.6. U.K.
- 8.3.6.1. Market estimates and forecast, 2018 - 2030 (USD Billion)
- 8.3.6.2. Market estimates and forecast by product, 2018 - 2030 (USD Billion)
- 8.3.6.3. Market estimates and forecast by deployment, 2018 - 2030 (USD Billion)
- 8.3.6.4. Market estimates and forecast by application, 2018 - 2030 (USD Billion)
- 8.3.6.5. Market estimates and forecast by end-use, 2018 - 2030 (USD Billion)
- 8.3.7. Germany
- 8.3.7.1. Market estimates and forecast, 2018 - 2030 (USD Billion)
- 8.3.7.2. Market estimates and forecast by product, 2018 - 2030 (USD Billion)
- 8.3.7.3. Market estimates and forecast by deployment, 2018 - 2030 (USD Billion)
- 8.3.7.4. Market estimates and forecast by application, 2018 - 2030 (USD Billion)
- 8.3.7.5. Market estimates and forecast by end-use, 2018 - 2030 (USD Billion)
- 8.3.8. France
- 8.3.8.1. Market estimates and forecast, 2018 - 2030 (USD Billion)
- 8.3.8.2. Market estimates and forecast by product, 2018 - 2030 (USD Billion)
- 8.3.8.3. Market estimates and forecast by deployment, 2018 - 2030 (USD Billion)
- 8.3.8.4. Market estimates and forecast by application, 2018 - 2030 (USD Billion)
- 8.3.8.5. Market estimates and forecast by end-use, 2018 - 2030 (USD Billion)
- 8.3.9. Italy
- 8.3.9.1. Market estimates and forecast, 2018 - 2030 (USD Billion)
- 8.3.9.2. Market estimates and forecast by product, 2018 - 2030 (USD Billion)
- 8.3.9.3. Market estimates and forecast by deployment, 2018 - 2030 (USD Billion)
- 8.3.9.4. Market estimates and forecast by application, 2018 - 2030 (USD Billion)
- 8.3.9.5. Market estimates and forecast by end-use, 2018 - 2030 (USD Billion)
- 8.3.10. Spain
- 8.3.10.1. Market estimates and forecast, 2018 - 2030 (USD Billion)
- 8.3.10.2. Market estimates and forecast by product, 2018 - 2030 (USD Billion)
- 8.3.10.3. Market estimates and forecast by deployment, 2018 - 2030 (USD Billion)
- 8.3.10.4. Market estimates and forecast by application, 2018 - 2030 (USD Billion)
- 8.3.10.5. Market estimates and forecast by end-use, 2018 - 2030 (USD Billion)
- 8.4. Asia Pacific
- 8.4.1. Market estimates and forecast, 2018 - 2030 (USD Billion)
- 8.4.2. Market estimates and forecast by product, 2018 - 2030 (USD Billion)
- 8.4.3. Market estimates and forecast by deployment, 2018 - 2030 (USD Billion)
- 8.4.4. Market estimates and forecast by application, 2018 - 2030 (USD Billion)
- 8.4.5. Market estimates and forecast by end-use, 2018 - 2030 (USD Billion)
- 8.4.6. China
- 8.4.6.1. Market estimates and forecast, 2018 - 2030 (USD Billion)
- 8.4.6.2. Market estimates and forecast by product, 2018 - 2030 (USD Billion)
- 8.4.6.3. Market estimates and forecast by deployment, 2018 - 2030 (USD Billion)
- 8.4.6.4. Market estimates and forecast by application, 2018 - 2030 (USD Billion)
- 8.4.6.5. Market estimates and forecast by end-use, 2018 - 2030 (USD Billion)
- 8.4.7. India
- 8.4.7.1. Market estimates and forecast, 2018 - 2030 (USD Billion)
- 8.4.7.2. Market estimates and forecast by product, 2018 - 2030 (USD Billion)
- 8.4.7.3. Market estimates and forecast by deployment, 2018 - 2030 (USD Billion)
- 8.4.7.4. Market estimates and forecast by application, 2018 - 2030 (USD Billion)
- 8.4.7.5. Market estimates and forecast by end-use, 2018 - 2030 (USD Billion)
- 8.4.8. Japan
- 8.4.8.1. Market estimates and forecast, 2018 - 2030 (USD Billion)
- 8.4.8.2. Market estimates and forecast by product, 2018 - 2030 (USD Billion)
- 8.4.8.3. Market estimates and forecast by deployment, 2018 - 2030 (USD Billion)
- 8.4.8.4. Market estimates and forecast by application, 2018 - 2030 (USD Billion)
- 8.4.8.5. Market estimates and forecast by end-use, 2018 - 2030 (USD Billion)
- 8.4.9. Australia
- 8.4.9.1. Market estimates and forecast, 2018 - 2030 (USD Billion)
- 8.4.9.2. Market estimates and forecast by product, 2018 - 2030 (USD Billion)
- 8.4.9.3. Market estimates and forecast by deployment, 2018 - 2030 (USD Billion)
- 8.4.9.4. Market estimates and forecast by application, 2018 - 2030 (USD Billion)
- 8.4.9.5. Market estimates and forecast by end-use, 2018 - 2030 (USD Billion)
- 8.4.10. South Korea
- 8.4.10.1. Market estimates and forecast, 2018 - 2030 (USD Billion)
- 8.4.10.2. Market estimates and forecast by product, 2018 - 2030 (USD Billion)
- 8.4.10.3. Market estimates and forecast by deployment, 2018 - 2030 (USD Billion)
- 8.4.10.4. Market estimates and forecast by application, 2018 - 2030 (USD Billion)
- 8.4.10.5. Market estimates and forecast by end-use, 2018 - 2030 (USD Billion)
- 8.5. Latin America
- 8.5.1. Market estimates and forecast, 2018 - 2030 (USD Billion)
- 8.5.2. Market estimates and forecast by product, 2018 - 2030 (USD Billion)
- 8.5.3. Market estimates and forecast by deployment, 2018 - 2030 (USD Billion)
- 8.5.4. Market estimates and forecast by application, 2018 - 2030 (USD Billion)
- 8.5.5. Market estimates and forecast by end-use, 2018 - 2030 (USD Billion)
- 8.5.6. Brazil
- 8.5.6.1. Market estimates and forecast, 2018 - 2030 (USD Billion)
- 8.5.6.2. Market estimates and forecast by product, 2018 - 2030 (USD Billion)
- 8.5.6.3. Market estimates and forecast by deployment, 2018 - 2030 (USD Billion)
- 8.5.6.4. Market estimates and forecast by application, 2018 - 2030 (USD Billion)
- 8.5.6.5. Market estimates and forecast by end-use, 2018 - 2030 (USD Billion)
- 8.5.7. Mexico
- 8.5.7.1. Market estimates and forecast, 2018 - 2030 (USD Billion)
- 8.5.7.2. Market estimates and forecast by product, 2018 - 2030 (USD Billion)
- 8.5.7.3. Market estimates and forecast by deployment, 2018 - 2030 (USD Billion)
- 8.5.7.4. Market estimates and forecast by application, 2018 - 2030 (USD Billion)
- 8.5.7.5. Market estimates and forecast by end-use, 2018 - 2030 (USD Billion)
- 8.5.8. Argentina
- 8.5.8.1. Market estimates and forecast, 2018 - 2030 (USD Billion)
- 8.5.8.2. Market estimates and forecast by product, 2018 - 2030 (USD Billion)
- 8.5.8.3. Market estimates and forecast by deployment, 2018 - 2030 (USD Billion)
- 8.5.8.4. Market estimates and forecast by application, 2018 - 2030 (USD Billion)
- 8.5.8.5. Market estimates and forecast by end-use, 2018 - 2030 (USD Billion)
- 8.6. Middle East & Africa
- 8.6.1. Market estimates and forecast, 2018 - 2030 (USD Billion)
- 8.6.2. Market estimates and forecast by product, 2018 - 2030 (USD Billion)
- 8.6.3. Market estimates and forecast by deployment, 2018 - 2030 (USD Billion)
- 8.6.4. Market estimates and forecast by application, 2018 - 2030 (USD Billion)
- 8.6.5. Market estimates and forecast by end-use, 2018 - 2030 (USD Billion)
- 8.6.6. UAE
- 8.6.6.1. Market estimates and forecast, 2018 - 2030 (USD Billion)
- 8.6.6.2. Market estimates and forecast by product, 2018 - 2030 (USD Billion)
- 8.6.6.3. Market estimates and forecast by deployment, 2018 - 2030 (USD Billion)
- 8.6.6.4. Market estimates and forecast by application, 2018 - 2030 (USD Billion)
- 8.6.6.5. Market estimates and forecast by end-use, 2018 - 2030 (USD Billion)
- 8.6.7. Saudi Arabia
- 8.6.7.1. Market estimates and forecast, 2018 - 2030 (USD Billion)
- 8.6.7.2. Market estimates and forecast by product, 2018 - 2030 (USD Billion)
- 8.6.7.3. Market estimates and forecast by deployment, 2018 - 2030 (USD Billion)
- 8.6.7.4. Market estimates and forecast by application, 2018 - 2030 (USD Billion)
- 8.6.7.5. Market estimates and forecast by end-use, 2018 - 2030 (USD Billion)
- 8.6.8. South Africa
- 8.6.8.1. Market estimates and forecast, 2018 - 2030 (USD Billion)
- 8.6.8.2. Market estimates and forecast by product, 2018 - 2030 (USD Billion)
- 8.6.8.3. Market estimates and forecast by deployment, 2018 - 2030 (USD Billion)
- 8.6.8.4. Market estimates and forecast by application, 2018 - 2030 (USD Billion)
- 8.6.8.5. Market estimates and forecast by end-use, 2018 - 2030 (USD Billion)
Chapter 9. Competitive Landscape
- 9.1. Company Categorization (Mature Players, Emerging Players)
- 9.2. Company Ranking/Share Analysis, 2022
- 9.3. Strategy Mapping
- 9.4. Company Profiles (Overview, Financial Performance, Product Overview, Strategic Initiatives)
- 9.4.1. Advanced Micro Devices, Inc.
- 9.4.2. Aldec, Inc.
- 9.4.3. Altair Engineering Inc.
- 9.4.4. Altium LLC
- 9.4.5. Autodesk, Inc.
- 9.4.6. ANSYS, Inc.
- 9.4.7. Cadence Design Systems, Inc.
- 9.4.8. eInfochips
- 9.4.9. EMA Design Automation, Inc.
- 9.4.10. Keysight Technologies
- 9.4.11. Microsemi
- 9.4.12. Synopsys, Inc.
- 9.4.13. Silvaco, Inc.
- 9.4.14. The MathWorks, Inc.
- 9.4.15. Vennsa Technologies
- 9.4.16. Zuken