|
|
市場調査レポート
商品コード
1701597
5Gエッジコンピューティングの市場規模、シェア、動向分析レポート:ソリューション別、最終用途別、地域別、セグメント予測、2025年~2030年5G Edge Computing Market Size, Share & Trends Analysis Report By Solution (Hardware, Software, Services), By End-use (IT & Telecom, Datacenters, Energy & Utilities), By Region, And Segment Forecasts, 2025 - 2030 |
||||||
|
|||||||
カスタマイズ可能
|
|||||||

| 5Gエッジコンピューティングの市場規模、シェア、動向分析レポート:ソリューション別、最終用途別、地域別、セグメント予測、2025年~2030年 |
|
出版日: 2025年03月18日
発行: Grand View Research
ページ情報: 英文 150 Pages
納期: 2~10営業日
|

全表示
- 概要
- 図表
- 目次
5Gエッジコンピューティング市場の成長と動向:
Grand View Research, Incの最新調査によると、世界の5Gエッジコンピューティング市場規模は2030年までに515億7,000万米ドルに達し、2025年から2030年までのCAGRは47.8%で成長すると予測されています。
エッジコンピューティングアーキテクチャの主な特徴は、バックエンド機能をユーザーネットワークに近づけることです。これは、消費者の期待に応え、それを上回るために、クラウドで送信・処理されるデータ量を最小限に抑えることで、リアルタイムの待ち時間を短縮し、セキュリティを強化する上で重要な役割を果たすと期待されており、予測期間中、市場の拡大をさらに後押しすると見られています。
この技術は、自動車、IT、通信、データセンターなどの業界で採用が拡大しています。また、マルチアクセス・エッジコンピューティング(MEC)技術と5G接続の統合により、小売業界は大きな混乱に見舞われると予測されています。MEC技術の利用は、データ処理時間を最小化し、店舗内システムの有効性を高め、消費者からの苦情をよりよく解決することを可能にすると予測されます。さらに、この技術の導入は、外部のメガサイトの負担を軽減し、よりシームレスな店舗体験をユーザーに提供することを意図しています。ネットワーク・システムにおける5Gエッジコンピューティングの統合は、レガシー・システムと比較して総所有コストを削減し、投資に対する迅速なリターンを生み出すため、小規模な小売チェーンが5Gエッジコンピューティング技術を採用することを促す可能性があります。
人工知能や機械学習技術の採用が増加し、エッジ・ハードウェアやソフトウェア・ソリューションに組み込まれることで、市場リーダーは、さまざまな業種からの刻々と変化する需要に対応する新製品を発売する必要に迫られています。例えば、2023年6月、モバイル通信会社のT-MobileはGoogle Cloudと提携し、5G接続とエッジコンピューティング技術を統合しました。この協業により、製造、小売、物流などさまざまな業界のユーザーがエッジコンピューティングと5Gのメリットを活用し、デジタルトランスフォーメーションを実現する強力なソリューションが誕生しました。主要企業によるこのような開発は、予測期間における5Gエッジコンピューティング産業の成長を促進すると期待されています。
5Gエッジコンピューティング市場のレポートハイライト
- ソリューション別では、ソフトウェア分野が2024年の世界市場で47.7%超と最も高い収益シェアを占めています。仮想化ソフトウェアにより、事業者は仮想化ネットワーク機能(VNF)の導入と管理が可能になり、これがセグメントの成長を牽引しています。
- 最終用途別では、2024年にIT&テレコム部門が収益シェア19.7%で市場を独占し、エネルギー&ユーティリティ部門は予測期間中に55%以上の最速CAGRで成長すると予測されています。
- アジア太平洋地域市場は、予測期間中に53.9%以上のCAGRで成長するとみられます。この地域の企業は、5Gエッジコンピューティングアーキテクチャを商用サービス向けに拡張するために、クラウドコンピューティングとエッジコンピューティングソリューションの組み合わせ機能を提供しています。
目次
第1章 調査手法と範囲
第2章 エグゼクティブサマリー
第3章 5Gエッジコンピューティング市場- 業界展望
- 市場系統の見通し
- 業界バリューチェーン分析
- 市場力学
- 業界分析ツール
第4章 5Gエッジコンピューティング市場:ソリューションの推定・動向分析
- セグメントダッシュボード
- 5Gエッジコンピューティング市場:ソリューションの変動分析、2024年および2030年
- ハードウェア
- ソフトウェア
- サービス
第5章 5Gエッジコンピューティング市場:最終用途の推定・動向分析
- セグメントダッシュボード
- 5Gエッジコンピューティング市場:最終用途の変動分析、2024年および2030年
- IT・通信
- スマート、スマートシティ、スマートビルディング
- データセンター
- エネルギー・公益事業
- 自動車
- ヘルスケア
- その他
第6章 地域の推定・動向分析
- 5Gエッジコンピューティング市場(地域別、2024年および2030年)
- 北米
- 北米5Gエッジコンピューティング市場の推定と予測、2018年~2030年
- 米国
- カナダ
- メキシコ
- 欧州
- 欧州5Gエッジコンピューティング市場推計・予測、2018年~2030年
- 英国
- ドイツ
- フランス
- アジア太平洋
- アジア太平洋地域の5Gエッジコンピューティング市場推計・予測、2018年~2030年
- 中国
- 日本
- インド
- 韓国
- オーストラリア
- ラテンアメリカ
- ラテンアメリカ5Gエッジコンピューティング市場推計・予測、2018年~2030年
- ブラジル
- 中東およびアフリカ
- 中東およびアフリカの5Gエッジコンピューティング市場推計・予測、2018年~2030年
- アラブ首長国連邦
- サウジアラビア
- 南アフリカ
第7章 5Gエッジコンピューティング市場-競合情勢
- 主要市場参入企業による最近の動向と影響分析
- 企業分類
- 参入企業の概要
- 財務実績
- 製品ベンチマーク
- 企業の市場ポジショニング
- 企業ヒートマップ分析
- 戦略マッピング
- パートナーシップ
- 新製品の発売
- 合併と買収
- 拡大
- 企業プロファイル
- ADLINK Technology Inc.
- Amazon Web Services, Inc.
- Advantech Co., Ltd.
- EdgeConneX, Inc.
- Hewlett Packard Enterprise Development LP
- Huawei Technologies Co., Ltd.
- Juniper Networks Inc.
- Saguna Network Ltd
- Vapor IO
- Johnson Controls International
List of Tables
- Table 1 5G edge computing market 2018 - 2030 (USD Million)
- Table 2 5G edge computing market, by region, 2018 - 2030 (USD Million)
- Table 3 5G edge computing market, by solution, 2018 - 2030 (USD Million)
- Table 4 5G edge computing market, by end use, 2018 - 2030 (USD Million)
- Table 5 Hardware market by region, 2018 - 2030 (USD Million)
- Table 6 Software market by region, 2018 - 2030 (USD Million)
- Table 7 It & telecom market by region, 2018 - 2030 (USD Million)
- Table 8 Smart, smart cities, and smart buildings market by region, 2018 - 2030 (USD Million)
- Table 9 Datacenters market by region, 2018 - 2030 (USD Million)
- Table 10 Energy & utilities market by region, 2018 - 2030 (USD Million)
- Table 11 Automotive market by region, 2018 - 2030 (USD Million)
- Table 12 Healthcare market by region, 2018 - 2030 (USD Million)
- Table 13 Others market by region, 2018 - 2030 (USD Million)
- Table 14 North America 5G edge computing market by solution, 2018 - 2030 (USD Million)
- Table 15 North America 5G edge computing market by end use, 2018 - 2030 (USD Million)
- Table 16 U.S. 5G edge computing market by solution, 2018 - 2030 (USD Million)
- Table 17 U.S. 5G edge computing market by end use, 2018 - 2030 (USD Million)
- Table 18 Canada 5G edge computing market by solution, 2018 - 2030 (USD Million)
- Table 19 Canada 5G edge computing market by end use, 2018 - 2030 (USD Million)
- Table 20 Mexico 5G edge computing market by solution, 2018 - 2030 (USD Million)
- Table 21 Mexico 5G edge computing market by end use, 2018 - 2030 (USD Million)
- Table 22 Europe 5G edge computing market by solution, 2018 - 2030 (USD Million)
- Table 23 Europe 5G edge computing market by end use, 2018 - 2030 (USD Million)
- Table 24 Germany 5G edge computing market by solution, 2018 - 2030 (USD Million)
- Table 25 Germany 5G edge computing market by end use, 2018 - 2030 (USD Million)
- Table 26 U.K. 5G edge computing market by solution, 2018 - 2030 (USD Million)
- Table 27 U.K. 5G edge computing market by end use, 2018 - 2030 (USD Million)
- Table 28 France 5G edge computing market by solution, 2018 - 2030 (USD Million)
- Table 29 France 5G edge computing market by end use, 2018 - 2030 (USD Million)
- Table 30 Asia Pacific 5G edge computing market by solution, 2018 - 2030 (USD Million)
- Table 31 Asia Pacific 5G edge computing market by end use, 2018 - 2030 (USD Million)
- Table 32 China 5G edge computing market by solution, 2018 - 2030 (USD Million)
- Table 33 China 5G edge computing market by end use, 2018 - 2030 (USD Million)
- Table 34 Japan 5G edge computing market by solution, 2018 - 2030 (USD Million)
- Table 35 Japan 5G edge computing market by end use, 2018 - 2030 (USD Million)
- Table 36 India 5G edge computing market by solution, 2018 - 2030 (USD Million)
- Table 37 India 5G edge computing market by end use, 2018 - 2030 (USD Million)
- Table 38 South Korea 5G edge computing market by solution, 2018 - 2030 (USD Million)
- Table 39 South Korea 5G edge computing market by end use, 2018 - 2030 (USD Million)
- Table 40 Australia 5G edge computing market by solution, 2018 - 2030 (USD Million)
- Table 41 Australia 5G edge computing market by end use, 2018 - 2030 (USD Million)
- Table 42 Latin America 5G edge computing market by solution, 2018 - 2030 (USD Million)
- Table 43 Latin America 5G edge computing market by end use, 2018 - 2030 (USD Million)
- Table 44 Brazil 5G edge computing market by solution, 2018 - 2030 (USD Million)
- Table 45 Brazil 5G edge computing market by end use, 2018 - 2030 (USD Million)
- Table 46 Middle East & Africa 5G edge computing market by solution, 2018 - 2030 (USD Million)
- Table 47 Middle East & Africa 5G edge computing market by end use, 2018 - 2030 (USD Million)
- Table 48 South Africa 5G edge computing market by solution, 2018 - 2030 (USD Million)
- Table 49 South Africa 5G edge computing market by end use, 2018 - 2030 (USD Million)
- Table 50 UAE 5G edge computing market by solution, 2018 - 2030 (USD Million)
- Table 51 UAE 5G edge computing market by end use, 2018 - 2030 (USD Million)
- Table 52 Saudi Arabia 5G edge computing market by solution, 2018 - 2030 (USD Million)
- Table 53 Saudi Arabia 5G edge computing market by end use, 2018 - 2030 (USD Million)
List of Figures
- Fig. 1 5G edge computing market segmentation
- Fig. 2 Information Procurement
- Fig. 3 Data analysis models
- Fig. 4 Market formulation and validation
- Fig. 5 Data validating & publishing
- Fig. 6 Market snapshot
- Fig. 7 Segment snapshot (1/2)
- Fig. 8 Segment snapshot (2/2)
- Fig. 9 Competitive landscape snapshot
- Fig. 10 5G edge computing market value, 2024 (USD million)
- Fig. 11 5G edge computing market - end use value chain analysis
- Fig. 12 5G edge computing market dynamics
- Fig. 13 5G edge computing market: Porter's five forces analysis
- Fig. 14 5G edge computing market: PESTEL analysis
- Fig. 15 5G Edge Computing Market Share by Solution, 2024 & 2030 (USD million)
- Fig. 16 5G Edge Computing Market, by Solution: Market Share, 2024 & 2030
- Fig. 17 Hardware market estimates & forecasts, 2018 - 2030 (revenue, USD Million)
- Fig. 18 Software market estimates & forecasts, 2018 - 2030 (revenue, USD Million)
- Fig. 19 Service market estimates & forecasts, 2018 - 2030 (revenue, USD Million)
- Fig. 20 5G edge computing market share by end use, 2024 & 2030 (USD million)
- Fig. 21 5G edge computing market, by end use: market share, 2024 & 2030
- Fig. 22 IT & telecom market estimates & forecasts, 2018 - 2030 (revenue, USD Million)
- Fig. 23 Smart, smart cities, and smart buildings market estimates & forecasts, 2018 - 2030 (revenue, USD Million)
- Fig. 24 Datacenters market estimates & forecasts, 2018 - 2030 (revenue, USD Million)
- Fig. 25 Energy & utilities market estimates & forecasts, 2018 - 2030 (revenue, USD Million)
- Fig. 26 Automotive market estimates & forecasts, 2018 - 2030 (revenue, USD Million)
- Fig. 27 Healthcare market estimates & forecasts, 2018 - 2030 (revenue, USD Million)
- Fig. 28 Others market estimates & forecasts, 2018 - 2030 (revenue, USD Million)
- Fig. 29 5G edge computing market revenue, by region, 2024 & 2030 (USD Million)
- Fig. 30 Regional marketplace: key takeaways (1/2)
- Fig. 31 Regional marketplace: key takeaways (2/2)
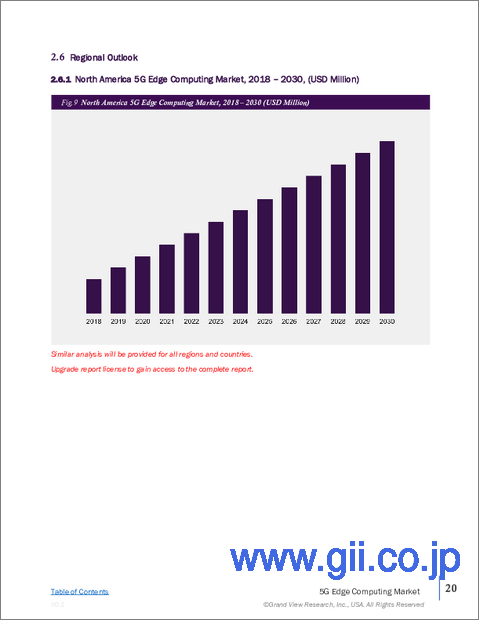
- Fig. 32 North America 5g edge computing market estimates and forecast, 2018 - 2030 (USD Million)
- Fig. 33 U.S. 5G edge computing market estimates and forecast, 2018 - 2030 (USD Million)
- Fig. 34 Canada 5G edge computing market estimates and forecast, 2018 - 2030 (USD Million)
- Fig. 35 Mexico 5G edge computing market estimates and forecast, 2018 - 2030 (USD Million)
- Fig. 36 Europe 5G edge computing market estimates and forecast, 2018 - 2030 (USD Million)
- Fig. 37 Germany 5G edge computing market estimates and forecast, 2018 - 2030 (USD million)
- Fig. 38 U.K. 5G edge computing market estimates and forecast,2018 - 2030 (USD million)
- Fig. 39 France 5G edge computing market estimates and forecast, 2018 - 2030 (USD million)
- Fig. 40 Asia Pacific 5G edge computing market estimates and forecast, 2018 - 2030 (USD million)
- Fig. 41 China 5G edge computing market estimates and forecast, 2018 - 2030 (USD Million)
- Fig. 42 Japan 5G edge computing market estimates and forecast, 2018 - 2030 (USD Million)
- Fig. 43 India 5G edge computing market estimates and forecast, 2018 - 2030 (USD Million)
- Fig. 44 South Korea 5G edge computing market estimates and forecast, 2018 - 2030 (USD Million)
- Fig. 45 Australia 5G edge computing market estimates and forecast, 2018 - 2030 (USD Million)
- Fig. 46 Latin America 5G edge computing market estimates and forecast, 2018 - 2030 (USD Million)
- Fig. 47 Brazil 5G edge computing market estimates and forecast, 2018 - 2030 (USD Million)
- Fig. 48 MEA 5G edge computing market estimates and forecast, 2018 - 2030 (USD million)
- Fig. 49 UAE 5G edge computing market estimates and forecast, 2018 - 2030 (USD Million)
- Fig. 50 South Africa 5G edge computing market estimates and forecast, 2018 - 2030 (USD Million)
- Fig. 51 Saudi Arabia 5G edge computing market estimates and forecast, 2018 - 2030 (USD Million)
- Fig. 52 Key company categorization
- Fig. 53 Company market positioning
- Fig. 54 Strategic framework
5G Edge Computing Market Growth & Trends:
The global 5G edge computing market size is expected to reach USD 51.57 billion by 2030, growing at a CAGR of 47.8% from 2025 to 2030, according to a new study by Grand View Research, Inc. The key feature of edge computing architecture is bringing backend functions closer to the user network. This is expected to play a crucial role in reducing real-time latency and enhancing security by minimizing the amount of data transmitted and processed in the cloud to meet and exceed consumer expectations, which is expected to boost the expansion of the market further over the forecast period.
Technology is observing increased adoption across industries such as automotive, IT, telecom, and data center. The retail sector is also projected to experience substantial disruption due to the integration of multi-access edge computing (MEC) technology with 5G connectivity. The use of MEC technology is projected to minimize data processing time and increase the effectiveness of in-store systems, allowing for better resolution of consumer complaints. Additionally, the implementation of this technology is intended to reduce the burden of external mega sites, providing users with a more seamless in-store experience. 5G edge computing integration in network systems reduces the total cost of ownership and creates quick returns on investment compared to legacy systems, which could encourage smaller retail chains to adopt 5G edge computing technology.
The rise in the adoption of artificial intelligence and machine learning technologies and their incorporation in edge hardware and software solutions are compelling the market leaders to launch new products, catering to everchanging demands from different industry verticals. For instance, in June 2023, T-Mobile, a mobile telecommunication company, partnered with Google Cloud to integrate their 5G connectivity and edge computing technologies. This collaboration has resulted in a powerful solution that empowers users across industries like manufacturing, retail, and logistics to harness the benefits of edge computing and 5G as they undergo digital transformation. Such development by key players is expected to drive the 5G edge computing industry growth over the forecast period.
5G Edge Computing Market Report Highlights:
- In terms of solution, the software segment accounted for the highest revenue share of more than 47.7% of the global market in 2024. Virtualization software enables operators to deploy and manage virtualized network functions (VNF), which is driving the segment growth
- Based on end-use, the IT & Telecom segment dominated the market in 2024 with revenue share 19.7%, while the Energy & Utilities category is anticipated to grow at the fastest CAGR of more than 55% over the forecast period
- The Asia Pacific regional market is likely to grow at a CAGR of more than 53.9% over the forecast period. Companies in the region are offering the combined functionality of cloud computing and edge computing solutions to extend 5G edge computing architecture for commercial services
Table of Contents
Chapter 1. Methodology and Scope
- 1.1. Market Segmentation & Scope
- 1.2. Market Definitions
- 1.3. Information Procurement
- 1.3.1. Information analysis
- 1.3.2. Market formulation & data visualization
- 1.3.3. Data validation & publishing
- 1.4. 1.4 Research Scope and Assumptions
- 1.4.1. List of Data Sources
Chapter 2. Executive Summary
- 2.1. 5G Edge Computing Market Snapshot
- 2.2. 5G Edge Computing Market- Segment Snapshot (1/2)
- 2.3. 5G Edge Computing Market- Segment Snapshot (2/2)
- 2.4. 5G Edge Computing Market- Competitive Landscape Snapshot
Chapter 3. 5G Edge Computing Market - Industry Outlook
- 3.1. Market Lineage Outlook
- 3.2. Industry Value Chain Analysis
- 3.3. Market Dynamics
- 3.3.1. Market Driver Analysis
- 3.3.2. Market Restraint Analysis
- 3.3.3. Industry Challenges
- 3.3.4. Industry Opportunities
- 3.4. Industry Analysis Tools
- 3.4.1. Porter's five forces analysis
- 3.4.2. Macroeconomic analysis
Chapter 4. 5G Edge Computing Market: Solution Estimates & Trend Analysis
- 4.1. Segment Dashboard
- 4.2. 5G Edge Computing Market: Solution Movement Analysis, 2024 & 2030 (USD Million)
- 4.3. Hardware
- 4.3.1. Hardware Market Revenue Estimates and Forecasts, 2018 - 2030 (USD Million)
- 4.4. Software
- 4.4.1. Software Market Revenue Estimates and Forecasts, 2018 - 2030 (USD Million)
- 4.5. Services
- 4.5.1. Services Market Revenue Estimates and Forecasts, 2018 - 2030 (USD Million)
Chapter 5. 5G Edge Computing Market: End Use Estimates & Trend Analysis
- 5.1. Segment Dashboard
- 5.2. 5G Edge Computing Market: End Use Movement Analysis, 2024 & 2030 (USD Million)
- 5.3. IT & Telecom
- 5.3.1. IT & Telecom Market Revenue Estimates and Forecasts, 2018 - 2030 (USD Million)
- 5.4. Smart, Smart Cities, and Smart Buildings
- 5.4.1. Smart, Smart Cities, and Smart Buildings Market Revenue Estimates and Forecasts, 2018 - 2030 (USD Million)
- 5.5. Datacenters
- 5.5.1. Datacenters Market Revenue Estimates and Forecasts, 2018 - 2030 (USD Million)
- 5.6. Energy & Utilities
- 5.6.1. Energy & Utilities Market Revenue Estimates and Forecasts, 2018 - 2030 (USD Million)
- 5.7. Automotive
- 5.7.1. Automotive Market Revenue Estimates and Forecasts, 2018 - 2030 (USD Million)
- 5.8. Healthcare
- 5.8.1. Healthcare Market Revenue Estimates and Forecasts, 2018 - 2030 (USD Million)
- 5.9. Others
- 5.9.1. Others Market Revenue Estimates and Forecasts, 2018 - 2030 (USD Million)
Chapter 6. Regional Estimates & Trend Analysis
- 6.1. 5G Edge Computing Market by Region, 2024 & 2030
- 6.2. North America
- 6.2.1. North America 5G Edge Computing Market Estimates & Forecasts, 2018 - 2030 (USD Million)
- 6.2.2. U.S.
- 6.2.2.1. U.S. 5G Edge Computing Market Estimates and Forecasts, 2018 - 2030 (USD Million)
- 6.2.3. Canada
- 6.2.3.1. Canada 5G Edge Computing Market Estimates and Forecasts, 2018 - 2030 (USD Million)
- 6.2.4. Mexico
- 6.2.4.1. Mexico 5G Edge Computing Market Estimates and Forecasts, 2018 - 2030 (USD Million)
- 6.3. Europe
- 6.3.1. Europe 5G Edge Computing Market Estimates and Forecasts, 2018 - 2030 (USD Million)
- 6.3.2. U.K.
- 6.3.2.1. U.K. 5G Edge Computing Market Estimates and Forecasts, 2018 - 2030 (USD Million)
- 6.3.3. Germany
- 6.3.3.1. Germany 5G Edge Computing Market Estimates and Forecasts, 2018 - 2030 (USD Million)
- 6.3.4. France
- 6.3.4.1. France 5G Edge Computing Market Estimates and Forecasts, 2018 - 2030 (USD Million)
- 6.4. Asia Pacific
- 6.4.1. Asia Pacific 5G Edge Computing Market Estimates and Forecasts, 2018 - 2030 (USD Million)
- 6.4.2. China
- 6.4.2.1. China 5G Edge Computing Market Estimates and Forecasts, 2018 - 2030 (USD Million)
- 6.4.3. Japan
- 6.4.3.1. Japan 5G Edge Computing Market Estimates and Forecasts, 2018 - 2030 (USD Million)
- 6.4.4. India
- 6.4.4.1. India 5G Edge Computing Market Estimates and Forecasts, 2018 - 2030 (USD Million)
- 6.4.5. South Korea
- 6.4.5.1. South Korea 5G Edge Computing Market Estimates and Forecasts, 2018 - 2030 (USD Million)
- 6.4.6. Australia
- 6.4.6.1. Australia 5G Edge Computing Market Estimates and Forecasts, 2018 - 2030 (USD Million)
- 6.5. Latin America
- 6.5.1. Latin America 5G Edge Computing Market Estimates and Forecasts, 2018 - 2030 (USD Million)
- 6.5.2. Brazil
- 6.5.2.1. Brazil 5G Edge Computing Market Estimates and Forecasts, 2018 - 2030 (USD Million)
- 6.6. Middle East and Africa
- 6.6.1. Middle East and Africa 5G Edge Computing Market Estimates and Forecasts, 2018 - 2030 (USD Million)
- 6.6.2. UAE
- 6.6.2.1. UAE 5G Edge Computing Market Estimates and Forecasts, 2018 - 2030 (USD Million)
- 6.6.3. Saudi Arabia
- 6.6.3.1. Saudi Arabia 5G Edge Computing Market Estimates and Forecasts, 2018 - 2030 (USD Million)
- 6.6.4. South Africa
- 6.6.4.1. South Africa 5G Edge Computing Market Estimates and Forecasts, 2018 - 2030 (USD Million)
Chapter 7. 5G Edge Computing Market - Competitive Landscape
- 7.1. Recent Developments & Impact Analysis, By Key Market Participants
- 7.2. Company Categorization
- 7.3. Participant's Overview
- 7.4. Financial Performance
- 7.5. Product Benchmarking
- 7.6. Company Market Positioning
- 7.7. Company Heat Map Analysis
- 7.8. Strategy Mapping
- 7.8.1. Partnerships
- 7.8.2. New Product Launches
- 7.8.3. Merger & Acquisition
- 7.8.4. Expansion
- 7.9. Company Profiles
- 7.9.1. ADLINK Technology Inc.
- 7.9.1.1. Participant's Overview
- 7.9.1.2. Financial Performance
- 7.9.1.3. Product Benchmarking
- 7.9.1.4. Recent Developments
- 7.9.2. Amazon Web Services, Inc.
- 7.9.2.1. Participant's Overview
- 7.9.2.2. Financial Performance
- 7.9.2.3. Product Benchmarking
- 7.9.2.4. Recent Developments
- 7.9.3. Advantech Co., Ltd.
- 7.9.3.1. Participant's Overview
- 7.9.3.2. Financial Performance
- 7.9.3.3. Product Benchmarking
- 7.9.3.4. Recent Developments
- 7.9.4. EdgeConneX, Inc.
- 7.9.4.1. Participant's Overview
- 7.9.4.2. Financial Performance
- 7.9.4.3. Product Benchmarking
- 7.9.4.4. Recent Developments
- 7.9.5. Hewlett Packard Enterprise Development LP
- 7.9.5.1. Participant's Overview
- 7.9.5.2. Financial Performance
- 7.9.5.3. Product Benchmarking
- 7.9.5.4. Recent Developments
- 7.9.6. Huawei Technologies Co., Ltd.
- 7.9.6.1. Participant's Overview
- 7.9.6.2. Financial Performance
- 7.9.6.3. Product Benchmarking
- 7.9.6.4. Recent Developments
- 7.9.7. Juniper Networks Inc.
- 7.9.7.1. Participant's Overview
- 7.9.7.2. Financial Performance
- 7.9.7.3. Product Benchmarking
- 7.9.7.4. Recent Developments
- 7.9.8. Saguna Network Ltd
- 7.9.8.1. Participant's Overview
- 7.9.8.2. Financial Performance
- 7.9.8.3. Product Benchmarking
- 7.9.8.4. Recent Developments
- 7.9.9. Vapor IO
- 7.9.9.1. Participant's Overview
- 7.9.9.2. Financial Performance
- 7.9.9.3. Product Benchmarking
- 7.9.9.4. Recent Developments
- 7.9.10. Johnson Controls International
- 7.9.10.1. Participant's Overview
- 7.9.10.2. Financial Performance
- 7.9.10.3. Product Benchmarking
- 7.9.10.4. Recent Developments
- 7.9.1. ADLINK Technology Inc.
