|
|
市場調査レポート
商品コード
1701389
OT(オペレーショナルテクノロジー)の市場規模、シェア、動向分析レポート:コンポーネント別、コネクティビティ別、展開別、企業規模別、産業別、地域別、セグメント予測、2025~2030年Operational Technology Market Size, Share & Trends Analysis Report By Component, By Connectivity, By Deployment, By Enterprise Size, By Industry, By Region, And Segment Forecasts, 2025 - 2030 |
||||||

|
|||||||
カスタマイズ可能
|
|||||||

| OT(オペレーショナルテクノロジー)の市場規模、シェア、動向分析レポート:コンポーネント別、コネクティビティ別、展開別、企業規模別、産業別、地域別、セグメント予測、2025~2030年 |
|
出版日: 2025年03月26日
発行: Grand View Research
ページ情報: 英文 118 Pages
納期: 2~10営業日
|

全表示
- 概要
- 図表
- 目次
OT(オペレーショナルテクノロジー)市場の成長と動向:
Grand View Research, Inc.の最新レポートによると、世界のOT(オペレーショナルテクノロジー)市場規模は2025年から2030年にかけてCAGR 9.6%を記録し、2030年には3,647億4,000万米ドルに達すると予測されています。
OT(オペレーショナルテクノロジー)セキュリティソリューションの需要増加は、産業システム内のデジタル技術への依存度が高まり、OTシステムのサイバー脅威に対する脆弱性が高まったことに起因しています。さらに、産業制御システム(ICS)を強化することを目的としたサイバーセキュリティフレームワークのような厳しい政府規制の賦課により、組織は広範なOTセキュリティプロトコルを実装することを余儀なくされています。さらに、ITシステムとOTシステムの統合は相互接続性の増大につながり、それによってOTシステムはITネットワークから発生するサイバー脅威にさらされることになります。その結果、潜在的なサイバーリスクから重要な産業プロセスを保護する、弾力性のあるOTソリューションの必要性が高まっています。
OT(オペレーショナルテクノロジー)は、物理環境内のデバイス、プロセス、イベントの直接的な制御と監視を可能にします。例えば、DCS、SCADA、PLC、BMS、CNCシステムなどがあります。これらの技術は、製造工場、発電所、水処理施設などの重要なインフラを運用し、産業プロセスの効率的で安全な管理を保証します。これらは、現代社会における様々な重要システムの不可欠な構成要素であり、潜在的な混乱や危険から保護しながら、機能性と信頼性を維持する上で重要な役割を果たしています。
ダイナミックなOT(オペレーショナルテクノロジー)市場では、競合環境が常に流動的であるため、各社は絶えず技術革新を行い、市場でのリーダーシップを維持するために新たな成長戦略を開発する必要に迫られています。主な企業は、AIや機械学習を取り入れた高度なセキュリティ・ソリューションを構築するための研究開発を優先しています。例えば、ファーウェイ・テクノロジーズ(Huawei Technologies Co., Ltd.)は、情報通信技術(ICT)とOT(オペレーショナルテクノロジー)の統合を先導し、よりスマートな生産プロセスを実現することで、製造業を変革する構えです。ドイツのインダストリー4.0、中国のメイド・イン・チャイナ2025、米国のインダストリアル・インターネットといった世界のイニシアティブと歩調を合わせ、ファーウェイはあらゆる製造業のデジタル化を推進する最前線にいます。
北米では、OT(オペレーショナルテクノロジー)が産業運営の要として、製造、輸送・物流、ヘルスケアなどの分野を支えています。効率性と信頼性に重点を置く北米のOTシステムは、重要なインフラを維持し、円滑な生産プロセスを確保するために不可欠です。自動車、航空宇宙、エネルギーなどの分野の企業は、業務を合理化し、ダウンタイムを最小限に抑えるために、OTに大きく依存しています。技術の進歩が北米の産業を再構築し続ける中、OTとAIやオートメーションなどの新興技術との統合は、パフォーマンスをさらに最適化し、イノベーションを促進することが期待されています。一方、アジア太平洋地域では、OT(オペレーショナルテクノロジー)が、新興国の急速な産業化と経済成長を促進する上で中心的な役割を果たしています。
オペレーション技術市場レポートハイライト
- コンピュータ数値制御(CNC)分野が2024年の世界売上高シェア33%以上を占め、市場をリード。ビル管理システム分野は予測期間中に最も速いCAGRで成長すると予測されます。
- 2024年には有線セグメントが市場をリードしました。この成長の要因は、無線に比べ信頼性と安全性が高く、重要なインフラ用途に不可欠であることです。無線セグメントは、予測期間中に最も速いCAGRで成長すると予測されています。
- 2024年には、オンプレミス部門がOT(オペレーショナルテクノロジー)業界をリードしています。クラウドセグメントは予測期間中に最も速いCAGRで成長すると予測されています。
- 2024年は大企業セグメントが市場をリード。中小企業セグメントは予測期間中に最も速いCAGRで成長すると予測されています。
- ディスクリート産業セグメントは、2024年に最大の収益シェアを占めました。プロセス産業セグメントは予測期間中最も速いCAGRで成長すると予測されています。
- 北米のOT(オペレーショナルテクノロジー)市場は2024年に36%以上の収益シェアを占め、優位を占める。アジア太平洋のOT(オペレーショナルテクノロジー)産業は予測期間中に最も高いCAGRを記録すると予測されています。
目次
第1章 調査手法と範囲
第2章 エグゼクティブサマリー
第3章 OT(オペレーショナルテクノロジー)市場の変数、動向、範囲
- 市場イントロダクション/系統展望
- 業界バリューチェーン分析
- 市場力学
- 市場促進要因分析
- 市場抑制要因分析
- 業界の機会
- 業界の課題
- OT(オペレーショナルテクノロジー)市場分析ツール
- ポーター分析
- PESTEL分析
第4章 OT(オペレーショナルテクノロジー)市場:コンポーネントの推定・動向分析
- セグメントダッシュボード
- OT(オペレーショナルテクノロジー)市場:コンポーネントの変動分析、2024年および2030年
- 監視制御およびデータ収集(SCADA)
- プログラマブルロジックコントローラ(PLC)
- リモートターミナルユニット(RTU)
- ヒューマンマシンインターフェース(HMI)
- その他
- 分散制御システム(DCS)
- 製造実行システム市場
- 機能安全
- ビル管理システム
- プラント資産管理(PAM)
- 可変周波数ドライブ(VFD)
- コンピュータ数値制御(CNC)
- その他
第5章 OT(オペレーショナルテクノロジー)市場:コネクティビティの推定・動向分析
- セグメントダッシュボード
- OT(オペレーショナルテクノロジー)市場:コネクティビティの変動分析、2024年および2030年
- 有線
- 無線
第6章 OT(オペレーショナルテクノロジー)市場:展開の推定・動向分析
- セグメントダッシュボード
- OT(オペレーショナルテクノロジー)市場:展開の変動分析、2024年および2030年
- クラウド
- オンプレミス
第7章 OT(オペレーショナルテクノロジー)市場:企業規模の推定・動向分析
- セグメントダッシュボード
- OT(オペレーショナルテクノロジー)市場:企業規模の変動分析、2024年および2030年
- 中小企業
- 大企業
第8章 OT(オペレーショナルテクノロジー)市場:産業の推定・動向分析
- セグメントダッシュボード
- OT(オペレーショナルテクノロジー)市場:産業の変動分析、2024年および2030年
- プロセス産業
- 石油・ガス
- 化学薬品
- パルプ・紙
- 医薬品
- 鉱業・金属
- エネルギーと電力
- その他
- ディスクリート産業
- 自動車
- 半導体およびエレクトロニクス
- 航空宇宙および防衛
- 重工業
- その他
第9章 OT(オペレーショナルテクノロジー)市場:地域の推定・動向分析
- OT(オペレーショナルテクノロジー)市場シェア(地域別、2024年および2030年)
- 北米
- コンポーネント別、2017年~2030年
- 展開別、2017年~2030年
- コネクティビティ別、2017年~2030年
- 企業規模別、2017年~2030年
- 業界別、2017年~2030年
- 米国
- カナダ
- メキシコ
- 欧州
- コンポーネント別、2017年~2030年
- 展開別、2017年~2030年
- コネクティビティ別、2017年~2030年
- 企業規模別、2017年~2030年
- 業界別、2017年~2030年
- 英国
- ドイツ
- フランス
- アジア太平洋
- コンポーネント別、2017年~2030年
- 展開別、2017年~2030年
- コネクティビティ別、2017年~2030年
- 企業規模別、2017年~2030年
- 業界別、2017年~2030年
- 中国
- 日本
- インド
- 韓国
- オーストラリア
- ラテンアメリカ
- コンポーネント別、2017年~2030年
- 展開別、2017年~2030年
- コネクティビティ別、2017年~2030年
- 企業規模別、2017年~2030年
- 業界別、2017年~2030年
- ブラジル
- 中東およびアフリカ
- コンポーネント別、2017年~2030年
- 展開別、2017年~2030年
- コネクティビティ別、2017年~2030年
- 企業規模別、2017年~2030年
- 業界別、2017年~2030年
- サウジアラビア
- アラブ首長国連邦
- 南アフリカ
第10章 競合情勢
- 主要市場参入企業による最近の動向と影響分析
- 企業分類
- 企業の市場ポジショニング
- 企業ヒートマップ分析
- 戦略マッピング
- 企業プロファイル
- ABB.
- Emerson Electric Co.
- General Electric
- Hitachi, Ltd.
- IBM Corporation
- Honeywell International Inc.
- OMRON Corporation
- Rockwell Automation
- Siemens
- Schneider Electric
List of Tables
- Table 1. Operational technology - Industry snapshot & key buying criteria, 2017 - 2030
- Table 2. Global operational technology market, 2017 - 2030 (USD Billion)
- Table 3. Global operational technology market estimates and forecast by component, 2017 - 2030 (USD Billion)
- Table 4. Global operational technology market estimates and forecast by connectivity, 2017 - 2030 (USD Billion)
- Table 5. Global operational technology market estimates and forecast by deployment, 2017 - 2030 (USD Billion)
- Table 6. Global operational technology market estimates and forecast by enterprise size, 2017 - 2030 (USD Billion)
- Table 7. Global operational technology market estimates and forecast by industry, 2017 - 2030 (USD Billion)
- Table 8. Global operational technology market estimates and forecasts by region, 2017 - 2030 (USD Billion)
- Table 9. Operational technology market estimates and forecast by supervisory control and data acquisition (SCADA), 2017 - 2030 (USD Billion)
- Table 10. Operational technology market estimates and forecast, by programmable logic controller (PLC), 2017 - 2030 (USD Billion)
- Table 11. Operational technology market estimates and forecast by remote terminal units (RTU), 2017 - 2030 (USD Billion)
- Table 12. Operational technology market estimates and forecast by human-machine interface (HMI), 2017 - 2030 (USD Billion)
- Table 13. Operational technology market estimates and forecast by others, 2017 - 2030 (USD Billion)
- Table 14. Operational technology market estimates and forecast by distributed control system (DCS), 2017 - 2030 (USD Billion)
- Table 15. Operational technology market estimates and forecast, by manufacturing execution system, 2017 - 2030 (USD Billion)
- Table 16. Operational technology market estimates and forecast by functional safety, 2017 - 2030 (USD Billion)
- Table 17. Operational technology market estimates and forecast by building management system, 2017 - 2030 (USD Billion)
- Table 18. Operational technology market estimates and forecast by plant asset management (PAM), 2017 - 2030 (USD Billion)
- Table 19. Operational technology market estimates and forecast, by variable frequency drives (VFD), 2017 - 2030 (USD Billion)
- Table 20. Operational technology market estimates and forecast by computer numerical control (CNC), 2017 - 2030 (USD Billion)
- Table 21. Operational technology market estimates and forecast by others, 2017 - 2030 (USD Billion)
- Table 22. Operational technology market estimates and forecast, by wired, 2017 - 2030 (USD Billion)
- Table 23. Operational technology market estimates and forecast by wireless, 2017 - 2030 (USD Billion)
- Table 24. Operational technology market estimates and forecast by cloud, 2017 - 2030 (USD Billion)
- Table 25. Operational technology market estimates and forecast by on-premises, 2017 - 2030 (USD Billion)
- Table 26. Operational technology market estimates and forecast by SMEs, 2017 - 2030 (USD Billion)
- Table 27. Operational technology market estimates and forecast, by large enterprises, 2017 - 2030 (USD Billion)
- Table 28. Operational technology market estimates and forecast by process industry, 2017 - 2030 (USD Billion)
- Table 29. Operational technology market estimates and forecast by oil & gas, 2017 - 2030 (USD Billion)
- Table 30. Operational technology market estimates and forecast, by chemicals, 2017 - 2030 (USD Billion)
- Table 31. Operational technology market estimates and forecast by pulp & paper, 2017 - 2030 (USD Billion)
- Table 32. Operational technology market estimates and forecast by pharmaceuticals, 2017 - 2030 (USD Billion)
- Table 33. Operational technology market estimates and forecast, by mining & metals, 2017 - 2030 (USD Billion)
- Table 34. Operational technology market estimates and forecast by energy & power, 2017 - 2030 (USD Billion)
- Table 35. Operational technology market estimates and forecast by others, 2017 - 2030 (USD Billion)
- Table 36. Operational technology market estimates and forecast by discrete industry, 2017 - 2030 (USD Billion)
- Table 37. Operational technology market estimates and forecast by automotive, 2017 - 2030 (USD Billion)
- Table 38. Operational technology market estimates and forecast, by semiconductor & electronics, 2017 - 2030 (USD Billion)
- Table 39. Operational technology market estimates and forecast by aerospace & defense, 2017 - 2030 (USD Billion)
- Table 40. Operational technology market estimates and forecast by heavy manufacturing, 2017 - 2030 (USD Billion)
- Table 41. Operational technology market estimates and forecast by others, 2017 - 2030 (USD Billion)
- Table 42. North America Operational Technology Market Estimates and Forecast, 2017 - 2030 (USD Billion)
- Table 43. North America operational technology market estimates and forecast, by component, 2017 - 2030 (USD Billion)
- Table 44. North America operational technology market estimates and forecast, by connectivity, 2017 - 2030 (USD Billion)
- Table 45. North America operational technology market estimates and forecast, by deployment, 2017 - 2030 (USD Billion)
- Table 46. North America operational technology market estimates and forecast, by enterprise size, 2017 - 2030 (USD Billion)
- Table 47. North America operational technology market estimates and forecast, by industry, 2017 - 2030 (USD Billion)
- Table 48. U.S. Operational Technology Market Estimates and Forecast, 2017 - 2030 (USD Billion)
- Table 49. U.S. operational technology market estimates and forecast, by component, 2017 - 2030 (USD Billion)
- Table 50. U.S. operational technology market estimates and forecast, by connectivity, 2017 - 2030 (USD Billion)
- Table 51. U.S. operational technology market estimates and forecast, by deployment, 2017 - 2030 (USD Billion)
- Table 52. U.S. operational technology market estimates and forecast, by enterprise size, 2017 - 2030 (USD Billion)
- Table 53. U.S. operational technology market estimates and forecast, by industry, 2017 - 2030 (USD Billion)
- Table 54. Canada Operational Technology Market Estimates and Forecast, 2017 - 2030 (USD Billion)
- Table 55. Canada operational technology market estimates and forecast, by component, 2017 - 2030 (USD Billion)
- Table 56. Canada operational technology market estimates and forecast, by connectivity, 2017 - 2030 (USD Billion)
- Table 57. Canada operational technology market estimates and forecast, by deployment, 2017 - 2030 (USD Billion)
- Table 58. Canada operational technology market estimates and forecast, by enterprise size, 2017 - 2030 (USD Billion)
- Table 59. Canada operational technology market estimates and forecast, by industry, 2017 - 2030 (USD Billion)
- Table 60. Europe Operational Technology Market Estimates and Forecast, 2017 - 2030 (USD Billion)
- Table 61. Europe operational technology market estimates and forecast, by component, 2017 - 2030 (USD Billion)
- Table 62. Europe operational technology market estimates and forecast, by connectivity, 2017 - 2030 (USD Billion)
- Table 63. Europe operational technology market estimates and forecast, by deployment, 2017 - 2030 (USD Billion)
- Table 64. Europe operational technology market estimates and forecast, by enterprise size, 2017 - 2030 (USD Billion)
- Table 65. Europe operational technology market estimates and forecast, by industry, 2017 - 2030 (USD Billion)
- Table 66. UK Operational Technology Market Estimates and Forecast, 2017 - 2030 (USD Billion)
- Table 67. UK operational technology market estimates and forecast, by component, 2017 - 2030 (USD Billion)
- Table 68. UK operational technology market estimates and forecast, by connectivity, 2017 - 2030 (USD Billion)
- Table 69. UK operational technology market estimates and forecast, by deployment, 2017 - 2030 (USD Billion)
- Table 70. UK operational technology market estimates and forecast, by enterprise size, 2017 - 2030 (USD Billion)
- Table 71. UK operational technology market estimates and forecast, by industry, 2017 - 2030 (USD Billion)
- Table 72. Germany Operational Technology Market Estimates and Forecast, 2017 - 2030 (USD Billion)
- Table 73. Germany operational technology market estimates and forecast, by component, 2017 - 2030 (USD Billion)
- Table 74. Germany operational technology market estimates and forecast, by connectivity, 2017 - 2030 (USD Billion)
- Table 75. Germany operational technology market estimates and forecast, by deployment, 2017 - 2030 (USD Billion)
- Table 76. Germany operational technology market estimates and forecast, by enterprise size, 2017 - 2030 (USD Billion)
- Table 77. Germany operational technology market estimates and forecast, by industry, 2017 - 2030 (USD Billion)
- Table 78. France Operational Technology Market Estimates and Forecast, 2017 - 2030 (USD Billion)
- Table 79. France operational technology market estimates and forecast, by component, 2017 - 2030 (USD Billion)
- Table 80. France operational technology market estimates and forecast, by connectivity, 2017 - 2030 (USD Billion)
- Table 81. France operational technology market estimates and forecast, by deployment, 2017 - 2030 (USD Billion)
- Table 82. France operational technology market estimates and forecast, by enterprise size, 2017 - 2030 (USD Billion)
- Table 83. France operational technology market estimates and forecast, by industry, 2017 - 2030 (USD Billion)
- Table 84. Asia Pacific Operational Technology Market Estimates and Forecast, 2017 - 2030 (USD Billion)
- Table 85. Asia Pacific operational technology market estimates and forecast, by component, 2017 - 2030 (USD Billion)
- Table 86. Asia Pacific operational technology market estimates and forecast, by connectivity, 2017 - 2030 (USD Billion)
- Table 87. Asia Pacific operational technology market estimates and forecast, by deployment, 2017 - 2030 (USD Billion)
- Table 88. Asia Pacific operational technology market estimates and forecast, by enterprise size, 2017 - 2030 (USD Billion)
- Table 89. Asia Pacific operational technology market estimates and forecast, by industry, 2017 - 2030 (USD Billion)
- Table 90. China Operational technology Market Estimates and Forecast, 2017 - 2030 (USD Billion)
- Table 91. China operational technology market estimates and forecast, by component, 2017 - 2030 (USD Billion)
- Table 92. China operational technology market estimates and forecast, by connectivity, 2017 - 2030 (USD Billion)
- Table 93. China operational technology market estimates and forecast, by deployment, 2017 - 2030 (USD Billion)
- Table 94. China operational technology market estimates and forecast, by enterprise size, 2017 - 2030 (USD Billion)
- Table 95. China operational technology market estimates and forecast, by industry, 2017 - 2030 (USD Billion)
- Table 96. Japan Operational Technology Market Estimates and Forecast, 2017 - 2030 (USD Billion)
- Table 97. Japan operational technology market estimates and forecast, by component, 2017 - 2030 (USD Billion)
- Table 98. Japan operational technology market estimates and forecast, by connectivity, 2017 - 2030 (USD Billion)
- Table 99. Japan operational technology market estimates and forecast, by deployment, 2017 - 2030 (USD Billion)
- Table 100. Japan operational technology market estimates and forecast, by enterprise size, 2017 - 2030 (USD Billion)
- Table 101. Japan operational technology market estimates and forecast, by industry, 2017 - 2030 (USD Billion)
- Table 102. India Operational Technology Market Estimates and Forecast, 2017 - 2030 (USD Billion)
- Table 103. India operational technology market estimates and forecast, by component, 2017 - 2030 (USD Billion)
- Table 104. India operational technology market estimates and forecast, by connectivity, 2017 - 2030 (USD Billion)
- Table 105. India operational technology market estimates and forecast, by deployment, 2017 - 2030 (USD Billion)
- Table 106. India operational technology market estimates and forecast, by enterprise size, 2017 - 2030 (USD Billion)
- Table 107. India operational technology market estimates and forecast, by industry, 2017 - 2030 (USD Billion)
- Table 108. South Korea Operational Technology Market Estimates and Forecast, 2017 - 2030 (USD Billion)
- Table 109. South Korea operational technology market estimates and forecast, by component, 2017 - 2030 (USD Billion)
- Table 110. South Korea operational technology market estimates and forecast, by connectivity, 2017 - 2030 (USD Billion)
- Table 111. South Korea operational technology market estimates and forecast, by deployment, 2017 - 2030 (USD Billion)
- Table 112. South Korea operational technology market estimates and forecast, by enterprise size, 2017 - 2030 (USD Billion)
- Table 113. South Korea operational technology market estimates and forecast, by industry, 2017 - 2030 (USD Billion)
- Table 114. Australia Operational Technology Market Estimates and Forecast, 2017 - 2030 (USD Billion)
- Table 115. Australia operational technology market estimates and forecast, by component, 2017 - 2030 (USD Billion)
- Table 116. Australia operational technology market estimates and forecast, by connectivity, 2017 - 2030 (USD Billion)
- Table 117. Australia operational technology market estimates and forecast, by deployment, 2017 - 2030 (USD Billion)
- Table 118. Australia operational technology market estimates and forecast, by enterprise size, 2017 - 2030 (USD Billion)
- Table 119. Australia operational technology market estimates and forecast, by industry, 2017 - 2030 (USD Billion)
- Table 120. Latin America Operational Technology Market Estimates and Forecast, 2017 - 2030 (USD Billion)
- Table 121. Latin America operational technology market estimates and forecast, by component, 2017 - 2030 (USD Billion)
- Table 122. Latin America operational technology market estimates and forecast, by connectivity, 2017 - 2030 (USD Billion)
- Table 123. Latin America operational technology market estimates and forecast, by deployment, 2017 - 2030 (USD Billion)
- Table 124. Latin America operational technology market estimates and forecast, by enterprise size, 2017 - 2030 (USD Billion)
- Table 125. Latin America operational technology market estimates and forecast, by industry, 2017 - 2030 (USD Billion)
- Table 126. Brazil Operational Technology Market Estimates and Forecast, 2017 - 2030 (USD Billion)
- Table 127. Brazil operational technology market estimates and forecast, by component, 2017 - 2030 (USD Billion)
- Table 128. Brazil operational technology market estimates and forecast, by connectivity, 2017 - 2030 (USD Billion)
- Table 129. Brazil operational technology market estimates and forecast, by deployment, 2017 - 2030 (USD Billion)
- Table 130. Brazil operational technology market estimates and forecast, by enterprise size, 2017 - 2030 (USD Billion)
- Table 131. Brazil operational technology market estimates and forecast, by industry, 2017 - 2030 (USD Billion)
- Table 132. Mexico Operational Technology Market Estimates and Forecast, 2017 - 2030 (USD Billion)
- Table 133. Mexico operational technology market estimates and forecast, by component, 2017 - 2030 (USD Billion)
- Table 134. Mexico operational technology market estimates and forecast, by connectivity, 2017 - 2030 (USD Billion)
- Table 135. Mexico operational technology market estimates and forecast, by deployment, 2017 - 2030 (USD Billion)
- Table 136. Mexico operational technology market estimates and forecast, by enterprise size, 2017 - 2030 (USD Billion)
- Table 137. Mexico operational technology market estimates and forecast, by industry, 2017 - 2030 (USD Billion)
- Table 138. Middle East & Africa Operational Technology Market Estimates and Forecast, 2017 - 2030 (USD Billion)
- Table 139. Middle East & Africa operational technology market estimates and forecast, by component, 2017 - 2030 (USD Billion)
- Table 140. Middle East & Africa operational technology market estimates and forecast, by connectivity, 2017 - 2030 (USD Billion)
- Table 141. Middle East & Africa operational technology market estimates and forecast, by deployment, 2017 - 2030 (USD Billion)
- Table 142. Middle East & Africa operational technology market estimates and forecast, by enterprise size, 2017 - 2030 (USD Billion)
- Table 143. Middle East & Africa operational technology market estimates and forecast, by industry, 2017 - 2030 (USD Billion)
- Table 144. KSA Operational Technology Market Estimates and Forecast, 2017 - 2030 (USD Billion)
- Table 145. KSA operational technology market estimates and forecast, by component, 2017 - 2030 (USD Billion)
- Table 146. KSA operational technology market estimates and forecast, by connectivity, 2017 - 2030 (USD Billion)
- Table 147. KSA operational technology market estimates and forecast, by deployment, 2017 - 2030 (USD Billion)
- Table 148. KSA operational technology market estimates and forecast, by enterprise size, 2017 - 2030 (USD Billion)
- Table 149. KSA operational technology market estimates and forecast, by industry, 2017 - 2030 (USD Billion)
- Table 150. UAE Operational Technology Market Estimates and Forecast, 2017 - 2030 (USD Billion)
- Table 151. UAE operational technology market estimates and forecast, by component, 2017 - 2030 (USD Billion)
- Table 152. UAE operational technology market estimates and forecast, by connectivity, 2017 - 2030 (USD Billion)
- Table 153. UAE operational technology market estimates and forecast, by deployment, 2017 - 2030 (USD Billion)
- Table 154. UAE operational technology market estimates and forecast, by enterprise size, 2017 - 2030 (USD Billion)
- Table 155. UAE operational technology market estimates and forecast, by industry, 2017 - 2030 (USD Billion)
- Table 156. South Africa Operational Technology Market Estimates and Forecast, 2017 - 2030 (USD Billion)
- Table 157. South Africa operational technology market estimates and forecast, by component, 2017 - 2030 (USD Billion)
- Table 158. South Africa operational technology market estimates and forecast, by connectivity, 2017 - 2030 (USD Billion)
- Table 159. South Africa operational technology market estimates and forecast, by deployment, 2017 - 2030 (USD Billion)
- Table 160. South Africa operational technology market estimates and forecast, by enterprise size, 2017 - 2030 (USD Billion)
- Table 161. South Africa operational technology market estimates and forecast, by industry, 2017 - 2030 (USD Billion)
List of Figures
- Fig. 1 Operational Technology Market Segmentation
- Fig. 2 Market Research Process
- Fig. 3 Component Landscape
- Fig. 4 Information Procurement
- Fig. 5 Primary Research Pattern
- Fig. 6 Market Research Approaches
- Fig. 7 Parent Market Analysis
- Fig. 8 Data Analysis Models
- Fig. 9 Market Formulation and Validation
- Fig. 10 Data Validating & Publishing
- Fig. 11 Market Snapshot
- Fig. 12 Competitive Landscape Snapshot
- Fig. 13 Operational Technology Market: Industry Value Chain Analysis
- Fig. 14 Market driver relevance analysis (Current & future impact)
- Fig. 15 Market restraint relevance analysis (Current & future impact)
- Fig. 16 Operational Technology Market: PORTER's Analysis
- Fig. 17 Operational Technology Market: PESTEL Analysis
- Fig. 18 Operational Technology Market: Component Outlook Key Takeaways (USD Billion)
- Fig. 19 Operational Technology Market: Component Movement Analysis 2024 & 2030 (USD Billion)
- Fig. 20 Supervisory Control and Data Acquisition (SCADA) Market Estimates & Forecasts, 2017 - 2030 (Revenue, USD Billion)
- Fig. 21 Programmable Logic Controller (PLC) Market Estimates & Forecasts, 2017 - 2030 (Revenue, USD Billion)
- Fig. 22 Remote Terminal Units (RTU) Market Estimates & Forecasts, 2017 - 2030 (Revenue, USD Billion)
- Fig. 23 Human-Machine Interface (HMI) Market Estimates & Forecasts, 2017 - 2030 (Revenue, USD Billion)
- Fig. 24 Others Market Estimates & Forecasts, 2017 - 2030 (Revenue, USD Billion)
- Fig. 25 Distributed Control System (DCS) Market Estimates & Forecasts, 2017 - 2030 (Revenue, USD Billion)
- Fig. 26 Manufacturing Execution System Market Market Estimates & Forecasts, 2017 - 2030 (Revenue, USD Billion)
- Fig. 27 Functional Safety Market Estimates & Forecasts, 2017 - 2030 (Revenue, USD Billion)
- Fig. 28 Building Management System Market Estimates & Forecasts, 2017 - 2030 (Revenue, USD Billion)
- Fig. 29 Plant Asset Management (PAM) Market Estimates & Forecasts, 2017 - 2030 (Revenue, USD Billion)
- Fig. 30 Variable Frequency Drives (VFD) Market Estimates & Forecasts, 2017 - 2030 (Revenue, USD Billion)
- Fig. 31 Computer Numerical Control (CNC) Market Estimates & Forecasts, 2017 - 2030 (Revenue, USD Billion)
- Fig. 32 Others Market Estimates & Forecasts, 2017 - 2030 (Revenue, USD Billion)
- Fig. 33 Operational Technology Market: Deployment Outlook Key Takeaways (USD Billion)
- Fig. 34 Operational Technology Market: Deployment Movement Analysis 2024 & 2030 (USD Billion)
- Fig. 35 Cloud Market Estimates & Forecasts, 2017 - 2030 (Revenue, USD Billion)
- Fig. 36 On-premises Market Estimates & Forecasts, 2017 - 2030 (Revenue, USD Billion)
- Fig. 37 Operational Technology Market: Connectivity Outlook Key Takeaways (USD Billion)
- Fig. 38 Operational Technology Market: Connectivity Movement Analysis 2024 & 2030 (USD Billion)
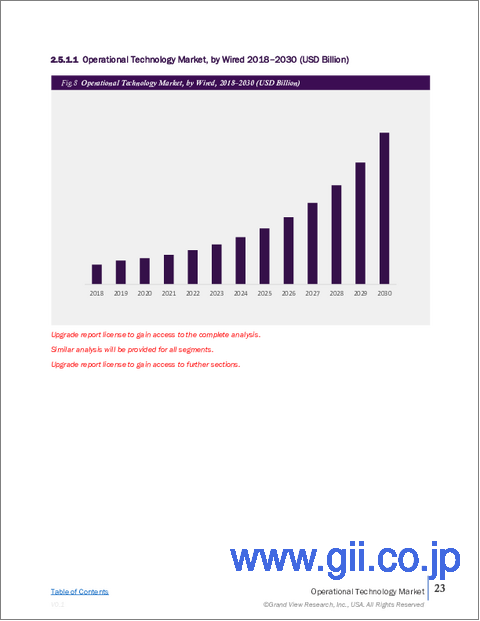
- Fig. 39 Wired Market Estimates & Forecasts, 2017 - 2030 (Revenue, USD Billion)
- Fig. 40 Wireless Market Estimates & Forecasts, 2017 - 2030 (Revenue, USD Billion)
- Fig. 41 Operational Technology Market: Enterprise Size Outlook Key Takeaways (USD Billion)
- Fig. 42 Operational Technology Market: Enterprise Size Movement Analysis 2024 & 2030 (USD Billion)
- Fig. 43 Large Enterprises Market Estimates & Forecasts, 2017 - 2030 (Revenue, USD Billion)
- Fig. 44 SMEs Market Estimates & Forecasts, 2017 - 2030 (Revenue, USD Billion)
- Fig. 45 Operational Technology Market: Industry Outlook Key Takeaways (USD Billion)
- Fig. 46 Operational Technology Market: Industry Movement Analysis 2024 & 2030 (USD Billion)
- Fig. 47 Process Industry Market Estimates & Forecasts, 2017 - 2030 (Revenue, USD Billion)
- Fig. 48 Oil & Gas Market Estimates & Forecasts, 2017 - 2030 (Revenue, USD Billion)
- Fig. 49 Chemicals Market Estimates & Forecasts, 2017 - 2030 (Revenue, USD Billion)
- Fig. 50 Pulp & Paper Market Estimates & Forecasts, 2017 - 2030 (Revenue, USD Billion)
- Fig. 51 Pharmaceuticals Market Estimates & Forecasts, 2017 - 2030 (Revenue, USD Billion)
- Fig. 52 Mining & Metals Market Estimates & Forecasts, 2017 - 2030 (Revenue, USD Billion)
- Fig. 53 Energy & Power Market Estimates & Forecasts, 2017 - 2030 (Revenue, USD Billion)
- Fig. 54 Others Market Estimates & Forecasts, 2017 - 2030 (Revenue, USD Billion)
- Fig. 55 Discrete Industry Market Estimates & Forecasts, 2017 - 2030 (Revenue, USD Billion)
- Fig. 56 Automotive Market Estimates & Forecasts, 2017 - 2030 (Revenue, USD Billion)
- Fig. 57 Semiconductor & Electronics Market Estimates & Forecasts, 2017 - 2030 (Revenue, USD Billion)
- Fig. 58 Aerospace & Defense Market Estimates & Forecasts, 2017 - 2030 (Revenue, USD Billion)
- Fig. 59 Heavy Manufacturing Market Estimates & Forecasts, 2017 - 2030 (Revenue, USD Billion)
- Fig. 60 Others Market Estimates & Forecasts, 2017 - 2030 (Revenue, USD Billion)
- Fig. 61 Operational Technology Market Revenue, by Region, 2024 & 2030 (USD Billion)
- Fig. 62 Regional Marketplace: Key Takeaways
- Fig. 63 Operational Technology market: Regional outlook, 2024 & 2030 (USD Billion)
- Fig. 64 North America Operational Technology Market Estimates and Forecasts, 2017 - 2030 (USD Billion)
- Fig. 65 US Operational Technology Market Estimates and Forecasts, 2017 - 2030 (USD Billion)
- Fig. 66 Canada Operational Technology Market Estimates and Forecasts, 2017 - 2030 (USD Billion)
- Fig. 67 Mexico Operational Technology Market Estimates and Forecasts, 2017 - 2030 (USD Billion)
- Fig. 68 Europe Operational Technology Market Estimates and Forecasts, 2017 - 2030 (USD Billion)
- Fig. 69 UK Operational Technology Market Estimates and Forecasts, 2017 - 2030 (USD Billion)
- Fig. 70 Germany Operational Technology Market Estimates and Forecasts, 2017 - 2030 (USD Billion)
- Fig. 71 France Operational Technology Market Estimates and Forecasts, 2017 - 2030 (USD Billion)
- Fig. 72 Asia Pacific Operational Technology Market Estimates and Forecast, 2017 - 2030 (USD Billion)
- Fig. 73 China Operational Technology Market Estimates and Forecasts, 2017 - 2030 (USD Billion)
- Fig. 74 Japan Operational Technology Market Estimates and Forecasts, 2017 - 2030 (USD Billion)
- Fig. 75 India Operational Technology Market Estimates and Forecasts, 2017 - 2030 (USD Billion)
- Fig. 76 Australia Operational Technology Market Estimates and Forecasts, 2017 - 2030 (USD Billion)
- Fig. 77 South Korea Operational Technology Market Estimates and Forecasts, 2017 - 2030 (USD Billion)
- Fig. 78 Latin America Operational Technology Market Estimates and Forecasts, 2017 - 2030 (USD Billion)
- Fig. 79 Brazil Operational Technology Market Estimates and Forecasts, 2017 - 2030 (USD Billion)
- Fig. 80 MEA Operational Technology Market Estimates and Forecasts, 2017 - 2030 (USD Billion)
- Fig. 81 UAE Operational Technology Market Estimates and Forecasts, 2017 - 2030 (USD Billion)
- Fig. 82 South Africa Operational Technology Market Estimates and Forecasts, 2017 - 2030 (USD Billion)
- Fig. 83 KSA Operational Technology Market Estimates and Forecasts, 2017 - 2030 (USD Billion)
- Fig. 84 Key Company Categorization
- Fig. 85 Strategic Framework
Operational Technology Market Growth & Trends:
The global operational technology market size is expected to reach USD 364.74 billion by 2030, registering a CAGR of 9.6% from 2025 to 2030, according to a new report by Grand View Research, Inc. The increased demand for operational technologies (OT) security solutions arises from the growing dependence on digital technologies within industrial systems, resulting in heightened vulnerability of OT systems to cyber threats. Furthermore, the imposition of strict government regulations, such as the cybersecurity framework aimed at enhancing industrial control systems (ICS), compels organizations to implement extensive OT security protocols. Moreover, the integration of IT and OT systems leads to increased interconnectedness, thereby exposing OT systems to cyber threats originating from IT networks. Consequently, there is an escalating need for resilient OT solutions to safeguard vital industrial processes against potential cyber risks.
Operational technologies enable direct control and monitoring of devices, processes, and events within the physical environment. Examples include DCS, SCADA, PLCs, BMS, CNC systems, and more. These technologies operate critical infrastructure such as manufacturing plants, power plants, and water treatment facilities, ensuring efficient and secure management of industrial processes. They are integral components of various essential systems in modern society, playing crucial roles in maintaining functionality and reliability while safeguarding against potential disruptions and hazards.
In the dynamic operational technology market, the competitive environment is in constant flux, prompting companies to continually innovate and develop fresh growth strategies to uphold their market leadership. Key players prioritize research and development to craft advanced security solutions infused with AI and machine learning. For instance, Huawei Technologies Co., Ltd. is poised to transform manufacturing by spearheading the integration of Information and Communications Technologies (ICT) and Operational Technologies (OT) to enable smarter production processes. In alignment with global initiatives such as Germany's Industry 4.0, China's Made in China 2025, and the US's Industrial Internet, Huawei is at the forefront of driving digitalization across every manufacturing sector.
In North America, operational technology serves as a cornerstone of industrial operations, supporting sectors including manufacturing, transportation and logistics, and healthcare. With a focus on efficiency and reliability, OT systems in North America are integral for maintaining critical infrastructure and ensuring smooth production processes. Companies in sectors such as automotive, aerospace, and energy rely heavily on OT to streamline operations and minimize downtime. As technological advancements continue to reshape industries in North America, the integration of OT with emerging technologies such as AI and automation holds the promise of further optimizing performance and driving innovation. Meanwhile, in the Asia Pacific region, operational technology plays a central role in fueling the rapid industrialization and economic growth of emerging economies.
Operational Technology Market Report Highlights:
- The Computer Numerical Control (CNC) segment led the market in 2024, accounting for over 33% share of the global revenue. The building management system segment is anticipated to grow at the fastest CAGR during the forecast period.
- The wired segment led the market in 2024. The growth is attributed to its reliability and security compared to wireless alternatives, making it indispensable for critical infrastructure applications. The wireless segment is anticipated to grow at the fastest CAGR during the forecast period.
- The on-premises segment led the operational technology industry in 2024. The cloud segment is expected to grow at the fastest CAGR during the forecast period.
- The large enterprises segment led the market in 2024. The SMEs segment is expected to grow at the fastest CAGR during the forecast period.
- The discrete industry segment held the largest revenue share in 2024. The process industry segment is estimated to grow at the fastest CAGR during the forecast period.
- North America operational technology market dominated in 2024, accounting for a revenue share of over 36%. The Asia Pacific operational technology industry is anticipated to register the highest CAGR over the forecast period.
Table of Contents
Chapter 1. Methodology and Scope
- 1.1. Market Segmentation and Scope
- 1.2. Market Definitions
- 1.3. Research Methodology
- 1.3.1. Information Procurement
- 1.3.2. Information or Data Analysis
- 1.3.3. Market Formulation & Data Visualization
- 1.3.4. Data Validation & Publishing
- 1.4. Research Scope and Assumptions
- 1.4.1. List of Data Sources
Chapter 2. Executive Summary
- 2.1. Market Outlook
- 2.2. Segment Outlook
- 2.3. Competitive Insights
Chapter 3. Operational Technology Market Variables, Trends, & Scope
- 3.1. Market Introduction/Lineage Outlook
- 3.2. Industry Value Chain Analysis
- 3.3. Market Dynamics
- 3.3.1. Market Drivers Analysis
- 3.3.2. Market Restraints Analysis
- 3.3.3. Industry Opportunities
- 3.3.4. Industry Challenges
- 3.4. Operational Technology Market Analysis Tools
- 3.4.1. Porter's Analysis
- 3.4.1.1. Bargaining power of the suppliers
- 3.4.1.2. Bargaining power of the buyers
- 3.4.1.3. Threats of substitution
- 3.4.1.4. Threats from new entrants
- 3.4.1.5. Competitive rivalry
- 3.4.2. PESTEL Analysis
- 3.4.2.1. Political landscape
- 3.4.2.2. Economic landscape
- 3.4.2.3. Social landscape
- 3.4.2.4. Technological landscape
- 3.4.2.5. Environmental landscape
- 3.4.2.6. Legal landscape
- 3.4.1. Porter's Analysis
Chapter 4. Operational Technology Market: Component Estimates & Trend Analysis
- 4.1. Segment Dashboard
- 4.2. Operational Technology Market: Component Movement Analysis, 2024 & 2030 (USD Billion)
- 4.3. Supervisory Control and Data Acquisition (SCADA)
- 4.3.1. Supervisory Control and Data Acquisition (SCADA) Market Revenue Estimates and Forecasts, 2017 - 2030 (USD Billion)
- 4.3.2. Programmable Logic Controller (PLC)
- 4.3.3. Remote Terminal Units (RTU)
- 4.3.4. Human-Machine Interface (HMI)
- 4.3.5. Others
- 4.4. Distributed Control System (DCS)
- 4.4.1. Distributed Control System (DCS) Market Revenue Estimates and Forecasts, 2017 - 2030 (USD Billion)
- 4.5. Manufacturing Execution System Market
- 4.5.1. Manufacturing Execution System Market Revenue Estimates and Forecasts, 2017 - 2030 (USD Billion)
- 4.6. Functional Safety
- 4.6.1. Functional Safety Market Revenue Estimates and Forecasts, 2017 - 2030 (USD Billion)
- 4.7. Building Management System
- 4.7.1. Building Management System Market Revenue Estimates and Forecasts, 2017 - 2030 (USD Billion)
- 4.8. Plant Asset Management (PAM)
- 4.8.1. Plant Asset Management (PAM) Market Revenue Estimates and Forecasts, 2017 - 2030 (USD Billion)
- 4.9. Variable Frequency Drives (VFD)
- 4.9.1. Variable Frequency Drives (VFD) Market Revenue Estimates and Forecasts, 2017 - 2030 (USD Billion)
- 4.10. Computer Numerical Control (CNC)
- 4.10.1. Computer Numerical Control (CNC) Market Revenue Estimates and Forecasts, 2017 - 2030 (USD Billion)
- 4.11. Others
- 4.11.1. Others Market Revenue Estimates and Forecasts, 2017 - 2030 (USD Billion)
Chapter 5. Operational Technology Market: Connectivity Estimates & Trend Analysis
- 5.1. Segment Dashboard
- 5.2. Operational Technology Market: Connectivity Movement Analysis, 2024 & 2030 (USD Billion)
- 5.3. Wired
- 5.3.1. Wired Market Revenue Estimates and Forecasts, 2017 - 2030 (USD Billion)
- 5.4. Wireless
- 5.4.1. Wireless Market Revenue Estimates and Forecasts, 2017 - 2030 (USD Billion)
Chapter 6. Operational Technology Market: Deployment Estimates & Trend Analysis
- 6.1. Segment Dashboard
- 6.2. Operational Technology Market: Deployment Movement Analysis, 2024 & 2030 (USD Billion)
- 6.3. Cloud
- 6.3.1. Cloud Market Revenue Estimates and Forecasts, 2017 - 2030 (USD Billion)
- 6.4. On-premises
- 6.4.1. On-premises Market Revenue Estimates and Forecasts, 2017 - 2030 (USD Billion)
Chapter 7. Operational Technology Market: Enterprise Size Estimates & Trend Analysis
- 7.1. Segment Dashboard
- 7.2. Operational Technology Market: Enterprise Size Movement Analysis, 2024 & 2030 (USD Billion)
- 7.3. SMEs
- 7.3.1. SMEs Market Revenue Estimates and Forecasts, 2017 - 2030 (USD Billion)
- 7.4. Large Enterprises
- 7.4.1. Large Enterprises Market Revenue Estimates and Forecasts, 2017 - 2030 (USD Billion)
Chapter 8. Operational Technology Market: Industry Estimates & Trend Analysis
- 8.1. Segment Dashboard
- 8.2. Operational Technology Market: Industry Movement Analysis, 2024 & 2030 (USD Billion)
- 8.3. Process Industry
- 8.3.1. Process Industry Market Revenue Estimates and Forecasts, 2017 - 2030 (USD Billion)
- 8.3.2. Oil & Gas
- 8.3.3. Chemicals
- 8.3.4. Pulp & Paper
- 8.3.5. Pharmaceuticals
- 8.3.6. Mining & Metals
- 8.3.7. Energy & Power
- 8.3.8. Others
- 8.4. Discrete Industry
- 8.4.1. Discrete Industry Market Revenue Estimates and Forecasts, 2017 - 2030 (USD Billion)
- 8.4.2. Automotive
- 8.4.3. Semiconductor & Electronics
- 8.4.4. Aerospace & Defense
- 8.4.5. Heavy Manufacturing
- 8.4.6. Others
Chapter 9. Operational Technology Market: Regional Estimates & Trend Analysis
- 9.1. Operational Technology Market Share, By Region, 2024 & 2030 (USD Billion)
- 9.2. North America
- 9.2.1. North America Operational Technology Market Estimates and Forecasts, 2017 - 2030 (USD Billion)
- 9.2.2. North America Operational Technology Market Estimates and Forecasts, by Component, 2017 - 2030 (USD Billion)
- 9.2.3. North America Operational Technology Market Estimates and Forecasts, by Deployment, 2017 - 2030 (USD Billion)
- 9.2.4. North America Operational Technology Market Estimates and Forecasts, by Connectivity, 2017 - 2030 (USD Billion)
- 9.2.5. North America Operational Technology Market Estimates and Forecasts, by Enterprise Size, 2017 - 2030 (USD Billion)
- 9.2.6. North America Operational Technology Market Estimates and Forecasts, by Industry, 2017 - 2030 (USD Billion)
- 9.2.7. U.S.
- 9.2.7.1. U.S. Operational Technology Market Estimates and Forecasts, 2017 - 2030 (USD Billion)
- 9.2.7.2. U.S. Operational Technology Market Estimates and Forecasts, by Component, 2017 - 2030 (USD Billion)
- 9.2.7.3. U.S. Operational Technology Market Estimates and Forecasts, by Deployment, 2017 - 2030 (USD Billion)
- 9.2.7.4. U.S. Operational Technology Market Estimates and Forecasts, by Connectivity, 2017 - 2030 (USD Billion)
- 9.2.7.5. U.S. Operational Technology Market Estimates and Forecasts, by Enterprise Size, 2017 - 2030 (USD Billion)
- 9.2.7.6. U.S. Operational Technology Market Estimates and Forecasts, by Industry, 2017 - 2030 (USD Billion)
- 9.2.8. Canada
- 9.2.8.1. Canada Operational Technology Market Estimates and Forecasts, 2017 - 2030 (USD Billion)
- 9.2.8.2. Canada Operational Technology Market Estimates and Forecasts, by Component, 2017 - 2030 (USD Billion)
- 9.2.8.3. Canada Operational Technology Market Estimates and Forecasts, by Deployment, 2017 - 2030 (USD Billion)
- 9.2.8.4. Canada Operational Technology Market Estimates and Forecasts, by Connectivity, 2017 - 2030 (USD Billion)
- 9.2.8.5. Canada Operational Technology Market Estimates and Forecasts, by Enterprise Size, 2017 - 2030 (USD Billion)
- 9.2.8.6. Canada Operational Technology Market Estimates and Forecasts, by Industry, 2017 - 2030 (USD Billion)
- 9.2.9. Mexico
- 9.2.9.1. Mexico Operational Technology Market Estimates and Forecasts, 2017 - 2030 (USD Billion)
- 9.2.9.2. Mexico Operational Technology Market Estimates and Forecasts, by Component, 2017 - 2030 (USD Billion)
- 9.2.9.3. Mexico Operational Technology Market Estimates and Forecasts, by Deployment, 2017 - 2030 (USD Billion)
- 9.2.9.4. Mexico Operational Technology Market Estimates and Forecasts, by Connectivity, 2017 - 2030 (USD Billion)
- 9.2.9.5. Mexico Operational Technology Market Estimates and Forecasts, by Enterprise Size, 2017 - 2030 (USD Billion)
- 9.2.9.6. Mexico Operational Technology Market Estimates and Forecasts, by Industry, 2017 - 2030 (USD Billion)
- 9.3. Europe
- 9.3.1. Europe Operational Technology Market Estimates and Forecasts, 2017 - 2030 (USD Billion)
- 9.3.2. Europe Operational Technology Market Estimates and Forecasts, by Component, 2017 - 2030 (USD Billion)
- 9.3.3. Europe Operational Technology Market Estimates and Forecasts, by Deployment, 2017 - 2030 (USD Billion)
- 9.3.4. Europe Operational Technology Market Estimates and Forecasts, by Connectivity, 2017 - 2030 (USD Billion)
- 9.3.5. Europe Operational Technology Market Estimates and Forecasts, by Enterprise Size, 2017 - 2030 (USD Billion)
- 9.3.6. Europe Operational Technology Market Estimates and Forecasts, by Industry, 2017 - 2030 (USD Billion)
- 9.3.7. UK
- 9.3.7.1. UK Operational Technology Market Estimates and Forecasts, 2017 - 2030 (USD Billion)
- 9.3.7.2. UK Operational Technology Market Estimates and Forecasts, by Component, 2017 - 2030 (USD Billion)
- 9.3.7.3. UK Operational Technology Market Estimates and Forecasts, by Deployment, 2017 - 2030 (USD Billion)
- 9.3.7.4. UK Operational Technology Market Estimates and Forecasts, by Connectivity, 2017 - 2030 (USD Billion)
- 9.3.7.5. UK Operational Technology Market Estimates and Forecasts, by Enterprise Size, 2017 - 2030 (USD Billion)
- 9.3.7.6. UK Operational Technology Market Estimates and Forecasts, by Industry, 2017 - 2030 (USD Billion)
- 9.3.8. Germany
- 9.3.8.1. Germany Operational Technology Market Estimates and Forecasts, 2017 - 2030 (USD Billion)
- 9.3.8.2. Germany Operational Technology Market Estimates and Forecasts, by Component, 2017 - 2030 (USD Billion)
- 9.3.8.3. Germany Operational Technology Market Estimates and Forecasts, by Deployment, 2017 - 2030 (USD Billion)
- 9.3.8.4. Germany Operational Technology Market Estimates and Forecasts, by Connectivity, 2017 - 2030 (USD Billion)
- 9.3.8.5. Germany Operational Technology Market Estimates and Forecasts, by Enterprise Size, 2017 - 2030 (USD Billion)
- 9.3.8.6. Germany Operational Technology Market Estimates and Forecasts, by Industry, 2017 - 2030 (USD Billion)
- 9.3.9. France
- 9.3.9.1. France Operational Technology Market Estimates and Forecasts, 2017 - 2030 (USD Billion)
- 9.3.9.2. France Operational Technology Market Estimates and Forecasts, by Component, 2017 - 2030 (USD Billion)
- 9.3.9.3. France Operational Technology Market Estimates and Forecasts, by Deployment, 2017 - 2030 (USD Billion)
- 9.3.9.4. France Operational Technology Market Estimates and Forecasts, by Connectivity, 2017 - 2030 (USD Billion)
- 9.3.9.5. Frace Operational Technology Market Estimates and Forecasts, by Enterprise Size, 2017 - 2030 (USD Billion)
- 9.3.9.6. Frace Operational Technology Market Estimates and Forecasts, by Industry, 2017 - 2030 (USD Billion)
- 9.4. Asia Pacific
- 9.4.1. Asia Pacific Operational Technology Market Estimates and Forecasts, 2017 - 2030 (USD Billion)
- 9.4.2. Asia Pacific Operational Technology Market Estimates and Forecasts, by Component, 2017 - 2030 (USD Billion)
- 9.4.3. Asia Pacific Operational Technology Market Estimates and Forecasts, by Deployment, 2017 - 2030 (USD Billion)
- 9.4.4. Asia Pacific Operational Technology Market Estimates and Forecasts, by Connectivity, 2017 - 2030 (USD Billion)
- 9.4.5. Asia Pacific Operational Technology Market Estimates and Forecasts, by Enterprise Size, 2017 - 2030 (USD Billion)
- 9.4.6. Asia Pacific Operational Technology Market Estimates and Forecasts, by Industry, 2017 - 2030 (USD Billion)
- 9.4.7. China
- 9.4.7.1. China Operational Technology Market Estimates and Forecasts, 2017 - 2030 (USD Billion)
- 9.4.7.2. China Operational Technology Market Estimates and Forecasts, by Component, 2017 - 2030 (USD Billion)
- 9.4.7.3. China Operational Technology Market Estimates and Forecasts, by Deployment, 2017 - 2030 (USD Billion)
- 9.4.7.4. China Operational Technology Market Estimates and Forecasts, by Connectivity, 2017 - 2030 (USD Billion)
- 9.4.7.5. China Operational Technology Market Estimates and Forecasts, by Enterprise Size, 2017 - 2030 (USD Billion)
- 9.4.7.6. China Operational Technology Market Estimates and Forecasts, by Industry, 2017 - 2030 (USD Billion)
- 9.4.8. Japan
- 9.4.8.1. Japan Operational Technology Market Estimates and Forecasts, 2017 - 2030 (USD Billion)
- 9.4.8.2. Japan Operational Technology Market Estimates and Forecasts, by Component, 2017 - 2030 (USD Billion)
- 9.4.8.3. Japan Operational Technology Market Estimates and Forecasts, by Deployment, 2017 - 2030 (USD Billion)
- 9.4.8.4. Japan Operational Technology Market Estimates and Forecasts, by Connectivity, 2017 - 2030 (USD Billion)
- 9.4.8.5. Japan Operational Technology Market Estimates and Forecasts, by Enterprise Size, 2017 - 2030 (USD Billion)
- 9.4.8.6. Japan Operational Technology Market Estimates and Forecasts, by Industry, 2017 - 2030 (USD Billion)
- 9.4.9. India
- 9.4.9.1. India Operational Technology Market Estimates and Forecasts, 2017 - 2030 (USD Billion)
- 9.4.9.2. India Operational Technology Market Estimates and Forecasts, by Component, 2017 - 2030 (USD Billion)
- 9.4.9.3. India Operational Technology Market Estimates and Forecasts, by Deployment, 2017 - 2030 (USD Billion)
- 9.4.9.4. India Operational Technology Market Estimates and Forecasts, by Connectivity, 2017 - 2030 (USD Billion)
- 9.4.9.5. India Operational Technology Market Estimates and Forecasts, by Enterprise Size, 2017 - 2030 (USD Billion)
- 9.4.9.6. India Operational Technology Market Estimates and Forecasts, by Industry, 2017 - 2030 (USD Billion)
- 9.4.10. South Korea
- 9.4.10.1. South Korea Operational Technology Market Estimates and Forecasts, 2017 - 2030 (USD Billion)
- 9.4.10.2. South Korea Operational Technology Market Estimates and Forecasts, by Component, 2017 - 2030 (USD Billion)
- 9.4.10.3. South Korea Operational Technology Market Estimates and Forecasts, by Deployment, 2017 - 2030 (USD Billion)
- 9.4.10.4. South Korea Operational Technology Market Estimates and Forecasts, by Connectivity, 2017 - 2030 (USD Billion)
- 9.4.10.5. South Korea Operational Technology Market Estimates and Forecasts, by Enterprise Size, 2017 - 2030 (USD Billion)
- 9.4.10.6. South Korea Operational Technology Market Estimates and Forecasts, by Industry, 2017 - 2030 (USD Billion)
- 9.4.11. Australia
- 9.4.11.1. Australia Operational Technology Market Estimates and Forecasts, 2017 - 2030 (USD Billion)
- 9.4.11.2. Australia Operational Technology Market Estimates and Forecasts, by Component, 2017 - 2030 (USD Billion)
- 9.4.11.3. Australia Operational Technology Market Estimates and Forecasts, by Deployment, 2017 - 2030 (USD Billion)
- 9.4.11.4. Australia Operational Technology Market Estimates and Forecasts, by Connectivity, 2017 - 2030 (USD Billion)
- 9.4.11.5. Australia Operational Technology Market Estimates and Forecasts, by Enterprise Size, 2017 - 2030 (USD Billion)
- 9.4.11.6. Australia Operational Technology Market Estimates and Forecasts, by Industry, 2017 - 2030 (USD Billion)
- 9.5. Latin America
- 9.5.1. Latin America Operational Technology Market Estimates and Forecasts, 2017 - 2030 (USD Billion)
- 9.5.2. Latin America Operational Technology Market Estimates and Forecasts, by Component, 2017 - 2030 (USD Billion)
- 9.5.3. Latin America Operational Technology Market Estimates and Forecasts, by Deployment, 2017 - 2030 (USD Billion)
- 9.5.4. Latin America Operational Technology Market Estimates and Forecasts, by Connectivity, 2017 - 2030 (USD Billion)
- 9.5.5. Latin America Operational Technology Market Estimates and Forecasts, by Enterprise Size, 2017 - 2030 (USD Billion)
- 9.5.6. Latin America Operational Technology Market Estimates and Forecasts, by Industry, 2017 - 2030 (USD Billion)
- 9.5.7. Brazil
- 9.5.7.1. Brazil Operational Technology Market Estimates and Forecasts, 2017 - 2030 (USD Billion)
- 9.5.7.2. Brazil Operational Technology Market Estimates and Forecasts, by Component, 2017 - 2030 (USD Billion)
- 9.5.7.3. Brazil Operational Technology Market Estimates and Forecasts, by Deployment, 2017 - 2030 (USD Billion)
- 9.5.7.4. Brazil Operational Technology Market Estimates and Forecasts, by Connectivity, 2017 - 2030 (USD Billion)
- 9.5.7.5. Brazil Operational Technology Market Estimates and Forecasts, by Enterprise Size, 2017 - 2030 (USD Billion)
- 9.5.7.6. Brazil Operational Technology Market Estimates and Forecasts, by Industry, 2017 - 2030 (USD Billion)
- 9.6. Middle East and Africa
- 9.6.1. Middle East and Africa Operational Technology Market Estimates and Forecasts, 2017 - 2030 (USD Billion)
- 9.6.2. Middle East and Africa Operational Technology Market Estimates and Forecasts, by Component, 2017 - 2030 (USD Billion)
- 9.6.3. Middle East and Africa Operational Technology Market Estimates and Forecasts, by Deployment, 2017 - 2030 (USD Billion)
- 9.6.4. Middle East and Africa Operational Technology Market Estimates and Forecasts, by Connectivity, 2017 - 2030 (USD Billion)
- 9.6.5. Middle East and Africa Operational Technology Market Estimates and Forecasts, by Enterprise Size, 2017 - 2030 (USD Billion)
- 9.6.6. Middle East and Africa Operational Technology Market Estimates and Forecasts, by Industry, 2017 - 2030 (USD Billion)
- 9.6.7. KSA
- 9.6.7.1. KSA Operational Technology Market Estimates and Forecasts, 2017 - 2030 (USD Billion)
- 9.6.7.2. KSA Operational Technology Market Estimates and Forecasts, by Component, 2017 - 2030 (USD Billion)
- 9.6.7.3. KSA Operational Technology Market Estimates and Forecasts, by Deployment, 2017 - 2030 (USD Billion)
- 9.6.7.4. KSA Operational Technology Market Estimates and Forecasts, by Connectivity, 2017 - 2030 (USD Billion)
- 9.6.7.5. KSA Operational Technology Market Estimates and Forecasts, by Enterprise Size, 2017 - 2030 (USD Billion)
- 9.6.7.6. KSA Operational Technology Market Estimates and Forecasts, by Industry, 2017 - 2030 (USD Billion)
- 9.6.8. UAE
- 9.6.8.1. UAE Operational Technology Market Estimates and Forecasts, 2017 - 2030 (USD Billion)
- 9.6.8.2. UAE Operational Technology Market Estimates and Forecasts, by Component, 2017 - 2030 (USD Billion)
- 9.6.8.3. UAE Operational Technology Market Estimates and Forecasts, by Deployment, 2017 - 2030 (USD Billion)
- 9.6.8.4. UAE Operational Technology Market Estimates and Forecasts, by Connectivity, 2017 - 2030 (USD Billion)
- 9.6.8.5. UAE Operational Technology Market Estimates and Forecasts, by Enterprise Size, 2017 - 2030 (USD Billion)
- 9.6.8.6. UAE Operational Technology Market Estimates and Forecasts, by Industry, 2017 - 2030 (USD Billion)
- 9.6.9. South Africa
- 9.6.9.1. South Africa Operational Technology Market Estimates and Forecasts, 2017 - 2030 (USD Billion)
- 9.6.9.2. South Africa Operational Technology Market Estimates and Forecasts, by Component, 2017 - 2030 (USD Billion)
- 9.6.9.3. South Africa Operational Technology Market Estimates and Forecasts, by Deployment, 2017 - 2030 (USD Billion)
- 9.6.9.4. South Africa Operational Technology Market Estimates and Forecasts, by Connectivity, 2017 - 2030 (USD Billion)
- 9.6.9.5. South Africa Operational Technology Market Estimates and Forecasts, by Enterprise Size, 2017 - 2030 (USD Billion)
- 9.6.9.6. South Africa Operational Technology Market Estimates and Forecasts, by Industry, 2017 - 2030 (USD Billion)
Chapter 10. Competitive Landscape
- 10.1. Recent Developments & Impact Analysis by Key Market Participants
- 10.2. Company Categorization
- 10.3. Company Market Positioning
- 10.4. Company Heat Map Analysis
- 10.5. Strategy Mapping
- 10.6. Company Profiles
- 10.6.1. ABB.
- 10.6.1.1. Participant's Overview
- 10.6.1.2. Financial Performance
- 10.6.1.3. Product Benchmarking
- 10.6.1.4. Recent Developments
- 10.6.2. Emerson Electric Co.
- 10.6.2.1. Participant's Overview
- 10.6.2.2. Financial Performance
- 10.6.2.3. Product Benchmarking
- 10.6.2.4. Recent Developments
- 10.6.3. General Electric
- 10.6.3.1. Participant's Overview
- 10.6.3.2. Financial Performance
- 10.6.3.3. Product Benchmarking
- 10.6.3.4. Recent Developments
- 10.6.4. Hitachi, Ltd.
- 10.6.4.1. Participant's Overview
- 10.6.4.2. Financial Performance
- 10.6.4.3. Product Benchmarking
- 10.6.4.4. Recent Developments
- 10.6.5. IBM Corporation
- 10.6.5.1. Participant's Overview
- 10.6.5.2. Financial Performance
- 10.6.5.3. Product Benchmarking
- 10.6.5.4. Recent Developments
- 10.6.6. Honeywell International Inc.
- 10.6.6.1. Participant's Overview
- 10.6.6.2. Financial Performance
- 10.6.6.3. Product Benchmarking
- 10.6.6.4. Recent Developments
- 10.6.7. OMRON Corporation
- 10.6.7.1. Participant's Overview
- 10.6.7.2. Financial Performance
- 10.6.7.3. Product Benchmarking
- 10.6.7.4. Recent Developments
- 10.6.8. Rockwell Automation
- 10.6.8.1. Participant's Overview
- 10.6.8.2. Financial Performance
- 10.6.8.3. Product Benchmarking
- 10.6.8.4. Recent Developments
- 10.6.9. Siemens
- 10.6.9.1. Participant's Overview
- 10.6.9.2. Financial Performance
- 10.6.9.3. Product Benchmarking
- 10.6.9.4. Recent Developments
- 10.6.10. Schneider Electric
- 10.6.10.1. Participant's Overview
- 10.6.10.2. Financial Performance
- 10.6.10.3. Product Benchmarking
- 10.6.10.4. Recent Developments
- 10.6.1. ABB.

