|
|
市場調査レポート
商品コード
1363348
多形膠芽腫治療の市場規模、シェア、動向分析レポート:治療別、薬剤クラス別、最終用途別、地域別、セグメント別予測、2023年~2030年Glioblastoma Multiforme Treatment Market Size, Share & Trends Analysis Report By Treatment (Radiation Therapy, Immunotherapy), By Drug Class, By End-use, By Region, And Segment Forecasts, 2023 - 2030 |
||||||
|
|
|||||||
カスタマイズ可能
|
|||||||


| 多形膠芽腫治療の市場規模、シェア、動向分析レポート:治療別、薬剤クラス別、最終用途別、地域別、セグメント別予測、2023年~2030年 |
|
出版日: 2023年09月28日
発行: Grand View Research
ページ情報: 英文 110 Pages
納期: 2~10営業日
|

- 全表示
- 概要
- 図表
- 目次
多形膠芽腫治療市場の成長と動向:
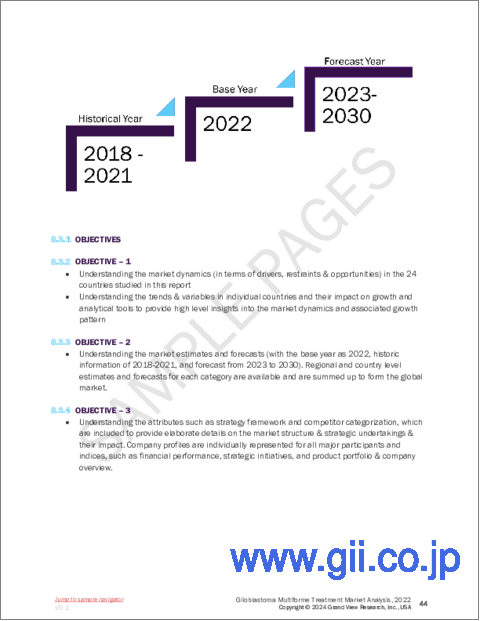
Grand View Research, Inc.の最新レポートによると、世界の多形膠芽腫治療市場規模は2030年までに51億米ドルに達する見込みです。
2023年から2030年までのCAGRは9.7%で拡大する見込みです。この市場を牽引しているのは、有病率の上昇と、新規治療や併用療法の承認の増加です。
近年では、革新的な製品のイントロダクションや、ガイドラインの好意的な内容や罹患率の上昇を背景とした大手製薬企業の同市場に対する関心の高まりにより、同産業は急成長を遂げています。例えば、ブリストル・マイヤーズスクイブ社、CNSファーマシューティカルズ社、バイエル社などは、多形性膠芽腫に対する新製品を開発中です。これらの製品は、今後数年間、市場における競争企業間の敵対関係を高める可能性が高いです。
さらに、企業は新規治療法を開発するために共同研究を行っています。例えば、2019年10月、臨床段階のバイオテクノロジー企業であるAdvaxis, Inc.は、多形性膠芽腫のマウス腫瘍モデルで同社のLmテクノロジーを使用することによる新規免疫療法の研究開発と商業化のためのカリフォルニア大学との共同研究契約を発表しました。研究者と市場プレイヤーの共同研究の増加は、多形性膠芽腫に対する新規かつ効果的な治療オプションの開発を後押しすると予想されます。
既存企業は、製品ポートフォリオを多様化するために、パイプライン製品を有する新規企業の買収に積極的です。例えば、2019年5月、メルクはPeloton Therapeuticsの11億米ドルの先行買収を発表し、これにより試験中の膠芽腫治療薬PT2977へのアクセスが認められました。この買収により、パイプラインが強化され、将来の収益創出能力が向上すると思われます。
多形性膠芽腫に罹患している人々を教育し、研究開発活動や治療のための資金を調達することで認知度を高めるために、世界中の政府や非政府機関が行っている様々な取り組みが、予測期間中の多形性膠芽腫(GBM)治療市場の成長を促進すると予想されています。例えば、モバイル・メッセージング・プラットフォームのPing Mobile社は、脳腫瘍に関する認識を高めるためのモバイル・キャンペーンを開始しました。これは、多形性膠芽腫に関する認知度を高め、多形性膠芽腫の研究活動への寄付を動機付けるのに役立ちます。
また、全米脳腫瘍協会、カナダ脳腫瘍財団、Cure Brain Cancer Foundationなどの団体も、脳腫瘍に対する人々の意識を高めるため、多くの啓発キャンペーンに取り組んでいます。英国では、3月を脳腫瘍啓発月間とし、脳腫瘍調査の加盟団体によってキャンペーンが実施されています。このキャンペーンの主な目的は、脳腫瘍研究のための資金が不足していることに対する認識を広めることであり、脳腫瘍とその治療に対する人々の理解を助けることです。さらに、ノボキュアは脳腫瘍啓発月間に、多形膠芽腫についての認識を広めるために多くの活動を行いました。
多形膠芽腫治療市場レポートのハイライト
- 治療法別では、放射線療法が2022年に37.0%の売上シェアを占め、市場を独占しました。これは、放射線療法が治療の第一選択として、または化学療法や手術との併用で推奨されることが最も多いため、生存率が改善したことによる。
- 薬剤クラス別では、その他セグメントが2022年に最大の売上シェアを占めました。このセグメントには、エベロリムス、コルチコステロイド、5-アミノレブリン酸(5-ALA)が含まれます。
- 病院セグメントは、2022年に多形性膠芽腫治療市場で最大の収益シェアを占め、予測期間中も主導的地位を維持すると予測されています。患者は、治療へのアクセスや利便性の観点から病院を好みます。
- アジア太平洋地域は、テモゾロミドのジェネリック医薬品の市場参入、経済の改善、高齢者人口の増加、ヘルスケア分野への投資の増加など様々な要因により、予測期間中に11.1%という最も速い成長率を記録すると予想されます。
- 北米は2022年に43.4%の最大シェアを占めました。ヘルスケア分野の発展に対する政府の支援、希少疾患に対する高い認識、質の高い医療施設への容易なアクセス、有利な償還政策などが、この地域の市場成長の主な要因となっています。
目次
第1章 調査手法と範囲
第2章 エグゼクティブサマリー
第3章 多形膠芽腫治療市場の変数、動向および範囲
- 市場系統の見通し
- 親市場の見通し
- 関連/付随市場の見通し
- 普及と成長の見通しマッピング
- 業界のバリューチェーン分析
- 償還の枠組み
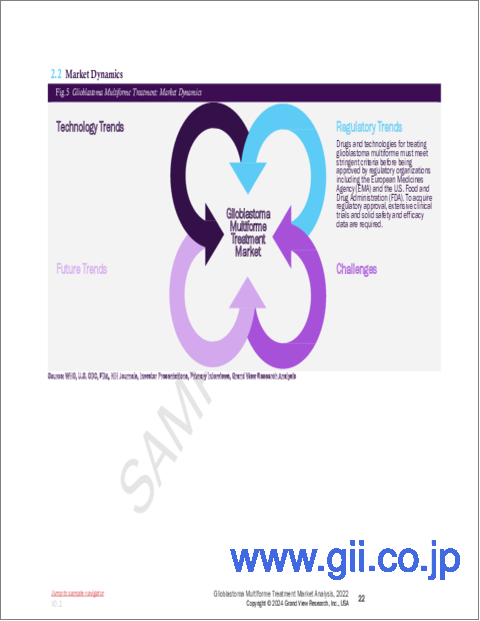
- 市場力学
- 市場促進要因の分析
- 市場抑制要因分析
- 多形膠芽腫治療市場分析ツール
- 業界分析- ポーターのファイブフォース分析
- PESTEL分析
第4章 多形膠芽腫治療市場:治療別推定・動向分析
- 多形膠芽腫治療市場:重要なポイント
- 多形膠芽腫治療市場:治療動向と市場シェア分析、2022年および2030年
- 手術
- 放射線治療
- 化学療法
- 標的療法
- 腫瘍治療領域(TTF)療法
- 免疫療法
第5章 多形膠芽腫治療市場:薬剤クラス別推定・動向分析
- 多形膠芽腫治療市場:重要なポイント
- 多形膠芽腫治療市場:薬剤クラスの動向と市場シェア分析、2022年と2030年
- テモゾロミド
- ベバシズマブ
- ロムスチン
- カルムスチンウエハース
- その他
第6章 多形膠芽腫治療市場:最終用途別推定・動向分析
- 多形膠芽腫治療市場:重要なポイント
- 多形膠芽腫治療市場:エンドユース動向と市場シェア分析、2022年および2030年
- 病院
- クリニック
- 外来手術センター
第7章 多形膠芽腫治療市場:地域別推定・動向分析
- 地域別の見通し
- 地域別の多形膠芽腫治療市場:重要なポイント
- 北米
- 市場推計・予測、2018~2030年
- 米国
- カナダ
- 欧州
- 英国
- ドイツ
- フランス
- イタリア
- スペイン
- スウェーデン
- ノルウェー
- デンマーク
- アジア太平洋地域
- 日本
- 中国
- インド
- オーストラリア
- タイ
- 韓国
- ラテンアメリカ
- ブラジル
- メキシコ
- アルゼンチン
- 中東・アフリカ
- サウジアラビア
- 南アフリカ
- アラブ首長国連邦
- クウェート
第8章 競合情勢
- 主要市場参入企業による最近の動向と影響分析
- 市場参入企業の分類
- Merck & Co., Inc.
- Sumitomo Dainippon Pharma Oncology, Inc. (Boston Biomedical, Inc.)
- Teva Pharmaceutical Industries Ltd.
- Sun Pharmaceutical Industries Ltd.
- Hoffmann-La Roche Ltd.
- Pfizer, Inc.
- Amgen, Inc.
- Arbor Pharmaceuticals, LLC
- Amneal Pharmaceuticals
- Karyopharm Therapeutics, Inc.
List of Tables
- Table 1 List of Abbreviations
- Table 2 North America glioblastoma multiforme treatments market, by treatment, 2018 - 2030 (USD Million)
- Table 3 North America glioblastoma multiforme treatments market, by drug class, 2018 - 2030 (USD Million)
- Table 4 North America glioblastoma multiforme treatments market, by end-use, 2018 - 2030 (USD Million)
- Table 5 North America glioblastoma multiforme treatments market, by region, 2018 - 2030 (USD Million)
- Table 6 U.S. glioblastoma multiforme treatments market, by treatment, 2018 - 2030 (USD Million)
- Table 7 U.S. glioblastoma multiforme treatments market, by drug class, 2018 - 2030 (USD Million)
- Table 8 U.S. glioblastoma multiforme treatments market, by end-use, 2018 - 2030 (USD Million)
- Table 9 Canada glioblastoma multiforme treatments market, by treatment, 2018 - 2030 (USD Million)
- Table 10 Canada glioblastoma multiforme treatments market, by drug class, 2018 - 2030 (USD Million)
- Table 11 Canada glioblastoma multiforme treatments market, by end-use, 2018 - 2030 (USD Million)
- Table 12 Europe glioblastoma multiforme treatments market, by treatment, 2018 - 2030 (USD Million)
- Table 13 Europe glioblastoma multiforme treatments market, by drug class, 2018 - 2030 (USD Million)
- Table 14 Europe glioblastoma multiforme treatments market, by end-use, 2018 - 2030 (USD Million)
- Table 15 Europe glioblastoma multiforme treatments market, by region, 2018 - 2030 (USD Million)
- Table 16 Germany glioblastoma multiforme treatments market, by treatment, 2018 - 2030 (USD Million)
- Table 17 Germany glioblastoma multiforme treatments market, by drug class, 2018 - 2030 (USD Million)
- Table 18 Germany glioblastoma multiforme treatments market, by end-use, 2018 - 2030 (USD Million)
- Table 19 UK glioblastoma multiforme treatments market, by treatment, 2018 - 2030 (USD Million)
- Table 20 UK glioblastoma multiforme treatments market, by drug class, 2018 - 2030 (USD Million)
- Table 21 UK glioblastoma multiforme treatments market, by end-use, 2018 - 2030 (USD Million)
- Table 22 France glioblastoma multiforme treatments market, by treatment, 2018 - 2030 (USD Million)
- Table 23 France glioblastoma multiforme treatments market, by drug class, 2018 - 2030 (USD Million)
- Table 24 France glioblastoma multiforme treatments market, by end-use, 2018 - 2030 (USD Million)
- Table 25 Italy glioblastoma multiforme treatments market, by treatment, 2018 - 2030 (USD Million)
- Table 26 Italy glioblastoma multiforme treatments market, by drug class, 2018 - 2030 (USD Million)
- Table 27 Italy glioblastoma multiforme treatments market, by end-use, 2018 - 2030 (USD Million)
- Table 28 Spain glioblastoma multiforme treatments market, by treatment, 2018 - 2030 (USD Million)
- Table 29 Spain glioblastoma multiforme treatments market, by drug class, 2018 - 2030 (USD Million)
- Table 30 Spain glioblastoma multiforme treatments market, by end-use, 2018 - 2030 (USD Million)
- Table 31 Sweden glioblastoma multiforme treatments market, by treatment, 2018 - 2030 (USD Million)
- Table 32 Sweden glioblastoma multiforme treatments market, by drug class, 2018 - 2030 (USD Million)
- Table 33 Sweden glioblastoma multiforme treatments market, by end-use, 2018 - 2030 (USD Million)
- Table 34 Norway glioblastoma multiforme treatments market, by treatment, 2018 - 2030 (USD Million)
- Table 35 Norway glioblastoma multiforme treatments market, by drug class, 2018 - 2030 (USD Million)
- Table 36 Norway glioblastoma multiforme treatments market, by end-use, 2018 - 2030 (USD Million)
- Table 37 Denmark glioblastoma multiforme treatments market, by treatment, 2018 - 2030 (USD Million)
- Table 38 Denmark glioblastoma multiforme treatments market, by drug class, 2018 - 2030 (USD Million)
- Table 39 Denmark glioblastoma multiforme treatments market, by end-use, 2018 - 2030 (USD Million)
- Table 40 Asia Pacific glioblastoma multiforme treatments market, by treatment, 2018 - 2030 (USD Million)
- Table 41 Asia Pacific glioblastoma multiforme treatments market, by drug class, 2018 - 2030 (USD Million)
- Table 42 Asia Pacific glioblastoma multiforme treatments market, by end-use, 2018 - 2030 (USD Million)
- Table 43 Asia Pacific glioblastoma multiforme treatments market, by region, 2018 - 2030 (USD Million)
- Table 44 China glioblastoma multiforme treatments market, by treatment, 2018 - 2030 (USD Million)
- Table 45 China glioblastoma multiforme treatments market, by drug class, 2018 - 2030 (USD Million)
- Table 46 China glioblastoma multiforme treatments market, by end-use, 2018 - 2030 (USD Million)
- Table 47 Japan glioblastoma multiforme treatments market, by treatment, 2018 - 2030 (USD Million)
- Table 48 Japan glioblastoma multiforme treatments market, by drug class, 2018 - 2030 (USD Million)
- Table 49 Japan glioblastoma multiforme treatments market, by end-use, 2018 - 2030 (USD Million)
- Table 50 India glioblastoma multiforme treatments market, by treatment, 2018 - 2030 (USD Million)
- Table 51 India glioblastoma multiforme treatments market, by drug class, 2018 - 2030 (USD Million)
- Table 52 India glioblastoma multiforme treatments market, by end-use, 2018 - 2030 (USD Million)
- Table 53 Thailand glioblastoma multiforme treatments market, by treatment, 2018 - 2030 (USD Million)
- Table 54 Thailand glioblastoma multiforme treatments market, by drug class, 2018 - 2030 (USD Million)
- Table 55 Thailand glioblastoma multiforme treatments market, by end-use, 2018 - 2030 (USD Million)
- Table 56 South Korea glioblastoma multiforme treatments market, by treatment, 2018 - 2030 (USD Million)
- Table 57 South Korea glioblastoma multiforme treatments market, by drug class, 2018 - 2030 (USD Million)
- Table 58 South Korea glioblastoma multiforme treatments market, by end-use, 2018 - 2030 (USD Million)
- Table 59 Australia glioblastoma multiforme treatments market, by treatment, 2018 - 2030 (USD Million)
- Table 60 Australia glioblastoma multiforme treatments market, by drug class, 2018 - 2030 (USD Million)
- Table 61 Australia glioblastoma multiforme treatments market, by end-use, 2018 - 2030 (USD Million)
- Table 62 Latin America glioblastoma multiforme treatments market, by treatment, 2018 - 2030 (USD Million)
- Table 63 Latin America glioblastoma multiforme treatments market, by drug class, 2018 - 2030 (USD Million)
- Table 64 Latin America glioblastoma multiforme treatments market, by end-use, 2018 - 2030 (USD Million)
- Table 65 Latin America glioblastoma multiforme treatments market, by region, 2018 - 2030 (USD Million)
- Table 66 Brazil glioblastoma multiforme treatments market, by treatment, 2018 - 2030 (USD Million)
- Table 67 Brazil glioblastoma multiforme treatments market, by drug class, 2018 - 2030 (USD Million)
- Table 68 Brazil glioblastoma multiforme treatments market, by end-use, 2018 - 2030 (USD Million)
- Table 69 Mexico glioblastoma multiforme treatments market, by treatment, 2018 - 2030 (USD Million)
- Table 70 Mexico glioblastoma multiforme treatments market, by drug class, 2018 - 2030 (USD Million)
- Table 71 Mexico glioblastoma multiforme treatments market, by end-use, 2018 - 2030 (USD Million)
- Table 72 Argentina glioblastoma multiforme treatments market, by treatment, 2018 - 2030 (USD Million)
- Table 73 Argentina glioblastoma multiforme treatments market, by drug class, 2018 - 2030 (USD Million)
- Table 74 Argentina glioblastoma multiforme treatments market, by end-use, 2018 - 2030 (USD Million)
- Table 75 Middle East and Africa glioblastoma multiforme treatments market, by treatment, 2018 - 2030 (USD Million)
- Table 76 Middle East and Africa glioblastoma multiforme treatments market, by drug class, 2018 - 2030 (USD Million)
- Table 77 Middle East and Africa glioblastoma multiforme treatments market, by end-use, 2018 - 2030 (USD Million)
- Table 78 Middle East and Africa glioblastoma multiforme treatments market, by region, 2018 - 2030 (USD Million)
- Table 79 South Africa glioblastoma multiforme treatments market, by treatment, 2018 - 2030 (USD Million)
- Table 80 South Africa glioblastoma multiforme treatments market, by drug class, 2018 - 2030 (USD Million)
- Table 81 South Africa glioblastoma multiforme treatments market, by end-use, 2018 - 2030 (USD Million)
- Table 82 Saudi Arabia glioblastoma multiforme treatments market, by treatment, 2018 - 2030 (USD Million)
- Table 83 Saudi Arabia glioblastoma multiforme treatments market, by drug class, 2018 - 2030 (USD Million)
- Table 84 Saudi Arabia glioblastoma multiforme treatments market, by end-use, 2018 - 2030 (USD Million)
- Table 85 UAE glioblastoma multiforme treatments market, by treatment, 2018 - 2030 (USD Million)
- Table 86 UAE glioblastoma multiforme treatments market, by drug class, 2018 - 2030 (USD Million)
- Table 87 UAE glioblastoma multiforme treatments market, by end-use, 2018 - 2030 (USD Million)
- Table 88 Kuwait glioblastoma multiforme treatments market, by treatment, 2018 - 2030 (USD Million)
- Table 89 Kuwait glioblastoma multiforme treatments market, by drug class, 2018 - 2030 (USD Million)
- Table 90 Kuwait glioblastoma multiforme treatments market, by end-use, 2018 - 2030 (USD Million)
List of Figures
- Fig. 1 Market research process
- Fig. 2 Data triangulation techniques
- Fig. 3 Primary research pattern
- Fig. 4 Market research approaches
- Fig. 5 Value-chain-based sizing & forecasting
- Fig. 6 QFD modeling for market share assessment
- Fig. 7 Market formulation & validation
- Fig. 8 Glioblastoma multiforme treatments: Market outlook
- Fig. 9 Glioblastoma multiforme treatments: Competitive insights
- Fig. 10 Parent market outlook
- Fig. 11 Related/ancillary market outlook
- Fig. 12 Penetration and growth prospect mapping
- Fig. 13 Industry value chain analysis
- Fig. 14 Glioblastoma multiforme treatments market driver impact
- Fig. 15 Glioblastoma multiforme treatments market restraint impact
- Fig. 16 Glioblastoma multiforme treatments market strategic initiatives analysis
- Fig. 17 Glioblastoma multiforme treatments market: Treatment movement analysis
- Fig. 18 Glioblastoma multiforme treatments market: Treatment outlook and key takeaways
- Fig. 19 Surgery market estimates and forecasts, 2018 - 2030 (USD Million)
- Fig. 20 Radiation therapy market estimates and forecasts, 2018 - 2030 (USD Million)
- Fig. 21 Chemotherapy market estimates and forecasts, 2018 - 2030 (USD Million)
- Fig. 22 Targeted therapy market estimates and forecasts, 2018 - 2030 (USD Million)
- Fig. 23 Tumor treating field (TTF) therapy market estimates and forecasts, 2018 - 2030 (USD Million)
- Fig. 24 Immunotherapy therapy market estimates and forecasts, 2018 - 2030 (USD Million)
- Fig. 25 Glioblastoma multiforme treatments market: Drug class movement analysis
- Fig. 26 Glioblastoma multiforme treatments market: Drug class outlook and key takeaways
- Fig. 27 Temozolomide market estimates and forecasts, 2018 - 2030 (USD Million)
- Fig. 28 Bevacizumab market estimates and forecasts, 2018 - 2030 (USD Million)
- Fig. 29 Lomustine market estimates and forecasts, 2018 - 2030 (USD Million)
- Fig. 30 Carmustine wafers market estimates and forecasts, 2018 - 2030 (USD Million)
- Fig. 31 Others market estimates and forecasts, 2018 - 2030 (USD Million)
- Fig. 32 Glioblastoma multiforme treatments market: End-use movement analysis
- Fig. 33 Glioblastoma multiforme treatments market: End-use outlook and key takeaways
- Fig. 34 Hospitals market estimates and forecasts, 2018 - 2030 (USD Million)
- Fig. 35 Clinics market estimates and forecasts, 2018 - 2030 (USD Million)
- Fig. 36 Ambulatory Surgical Centers market estimates and Forecasts, 2018 - 2030 (USD Million)
- Fig. 37 Global glioblastoma multiforme treatments market: Regional movement analysis
- Fig. 38 Global glioblastoma multiforme treatments market: Regional outlook and key takeaways
- Fig. 39 North America market estimates and forecasts, 2018 - 2030 (USD Million)
- Fig. 40 U.S. market estimates and forecasts, 2018 - 2030 (USD Million)
- Fig. 41 Canada market estimates and forecasts, 2018 - 2030 (USD Million)
- Fig. 42 Europe market estimates and forecasts, 2018 - 2030 (USD Million)
- Fig. 43 UK market estimates and forecasts, 2018 - 2030 (USD Million)
- Fig. 44 Germany market estimates and forecasts, 2018 - 2030 (USD Million)
- Fig. 45 France market estimates and forecasts, 2018 - 2030 (USD Million)
- Fig. 46 Italy market estimates and forecasts, 2018 - 2030 (USD Million)
- Fig. 47 Spain market estimates and forecasts, 2018 - 2030 (USD Million)
- Fig. 48 Sweden market estimates and forecasts, 2018 - 2030 (USD Million)
- Fig. 49 Norway market estimates and forecasts, 2018 - 2030 (USD Million)
- Fig. 50 Denmark market estimates and forecasts, 2018 - 2030 (USD Million)
- Fig. 51 Asia Pacific market estimates and forecasts, 2018 - 2030 (USD Million)
- Fig. 52 Japan market estimates and forecasts, 2018 - 2030 (USD Million)
- Fig. 53 China market estimates and forecasts, 2018 - 2030 (USD Million)
- Fig. 54 India market estimates and forecasts, 2018 - 2030 (USD Million)
- Fig. 55 Australia market estimates and forecasts, 2018 - 2030 (USD Million)
- Fig. 56 Thailand market estimates and forecasts, 2018 - 2030 (USD Million)
- Fig. 57 South Korea market estimates and forecasts, 2018 - 2030 (USD Million)
- Fig. 58 Latin America market estimates and forecasts, 2018 - 2030 (USD Million)
- Fig. 59 Brazil market estimates and forecasts, 2018 - 2030 (USD Million)
- Fig. 60 Mexico market estimates and forecasts, 2018 - 2030 (USD Million)
- Fig. 61 Argentina market estimates and forecasts, 2018 - 2030 (USD Million)
- Fig. 62 Middle East and Africa market estimates and forecasts, 2018 - 2030 (USD Million)
- Fig. 63 Saudi Arabia market estimates and forecasts, 2018 - 2030 (USD Million)
- Fig. 64 South Africa market estimates and forecasts, 2018 - 2030 (USD Million)
- Fig. 65 UAE market estimates and forecasts, 2018 - 2030 (USD Million)
- Fig. 66 Kuwait market estimates and forecasts, 2018 - 2030 (USD Million)
Glioblastoma Multiforme Treatment Market Growth & Trends:
The global glioblastoma multiforme treatment market size is expected to reach USD 5.10 billion by 2030, according to a new report by Grand View Research, Inc.. It is expected to expand at a CAGR of 9.7% from 2023 to 2030. The market is driven by the rising prevalence of the disease and increasing approval for novel therapy and combination therapy.
In recent years, the industry has been growing rapidly owing to the introduction of innovative products and rising interest of major pharmaceutical companies in the market due to favorable guidelines and rising incidence of the disease. For instance, companies such as Bristol Myers Squibb; CNS Pharmaceuticals, Inc.; and Bayer have novel products in the pipeline for glioblastoma multiforme. These products are likely to boost competitive rivalry in the market in the coming years.
Moreover, companies are collaborating to develop novel treatments. For instance, in October 2019, Advaxis, Inc., a clinical-stage biotechnology company, announced a research collaboration agreement with the University of California for the development and commercialization of novel immunotherapy by using the company's Lm Technology in mouse tumor models of glioblastoma multiforme. An increase in collaborations between researchers and market players is expected to boost the development of novel and effective treatment options for glioblastoma multiforme.
Existing companies are willing to acquire new companies with pipeline products to diversify their product portfolio. For instance, in May 2019, Merck announced the upfront USD 1.1 billion acquisition of Peloton Therapeutics, which grants it access to the PT2977 under trial glioblastoma drug. This acquisition is likely to strengthen its pipeline and improve its future revenue-generation ability.
Various initiatives undertaken by the governments and non-government bodies across the globe to increase awareness by educating people living with glioblastoma multiforme and raising funds for R&D activities and treatment are expected to fuel the glioblastoma multiforme (GBM) treatment market growth during the forecast period. For instance, Ping Mobile, a mobile messaging platform, has launched a mobile campaign to increase awareness about brain cancer. This helps in raising awareness about glioblastoma multiforme and motivating people to donate money for glioblastoma multiforme research activities.
Organizations such as the National Brain Tumor Society, Brain Tumour Foundation of Canada, and Cure Brain Cancer Foundation are also involved in many awareness campaigns to raise awareness among people about the condition. In the U.K., March is Brain Tumor Awareness month, a campaign established by member charities of Brain Tumor Research. The main aim of the campaign is to spread awareness about the lack of funding for brain tumor research, and it helps people understand brain tumors and their treatment. Moreover, Novocure undertook many activities to spread awareness about glioblastoma multiforme during Brain Tumor Awareness Month.
Glioblastoma Multiforme Treatment Market Report Highlights:
- Based on treatment, in 2020, radiation therapy dominated the market with a revenue share of 37.0% in 2022, owing to improved survival rates, as radiation therapy is most often recommended as the first line of treatment or in combination with chemotherapy and surgery
- By drug class, the others segment accounted for the largest revenue share in 2022. The segment includes everolimus, corticosteroids, and 5-aminolevulinic acid (5-ALA)
- The hospital segment held the largest revenue share in the glioblastoma multiforme treatment market in 2022 and is anticipated to maintain its leading position during the forecast period. Patients prefer hospitals in terms of treatment accessibility and convenience
- Asia Pacific is expected to register the fastest growth rate of 11.1% over the forecast period, owing to various factors such as the entry of generics of temozolomide in the market, improving economy, rising geriatric population, and growing investments in the healthcare sector
- North America accounted for the largest share of 43.4% in 2022. Government support for the development of the healthcare sector, high awareness about rare disorders, easy accessibility to quality medical facilities, and favorable reimbursement policies are among the key factors responsible for the regional market growth
Table of Contents
Chapter 1. Methodology and Scope
- 1.1. Market Segmentation & Scope
- 1.1.1. Treatment
- 1.1.2. Drug class
- 1.1.3. End Use
- 1.1.4. Regional scope
- 1.1.5. Estimates and forecast timeline
- 1.2. Research Methodology
- 1.3. Information Procurement
- 1.3.1. Purchased database
- 1.3.2. GVR's internal database
- 1.3.3. Secondary sources
- 1.3.4. Primary research
- 1.3.5. Details of primary research
- 1.4. Information or Data Analysis
- 1.5. Market Formulation & Validation
- 1.6. Model Details
- 1.7. List of Secondary Sources
- 1.8. List of Primary Sources
- 1.9. Objectives
Chapter 2. Executive Summary
- 2.1. Market Outlook
- 2.2. Segment Outlook
- 2.2.1. Treatment outlook
- 2.2.2. Drug class outlook
- 2.2.3. End-use outlook
- 2.2.4. Regional outlook
- 2.3. Competitive Insights
Chapter 3. Glioblastoma Multiforme Treatment Market Variables, Trends & Scope
- 3.1. Market Lineage Outlook
- 3.1.1. Parent market outlook
- 3.1.2. Related/ancillary market outlook
- 3.2. Penetration & Growth Prospect Mapping
- 3.3. Industry Value Chain Analysis
- 3.3.1. Reimbursement framework
- 3.4. Market Dynamics
- 3.4.1. Market Driver Analysis
- 3.4.2. Market Restraint Analysis
- 3.5. Glioblastoma Multiforme Treatment Market Analysis Tools
- 3.5.1. Industry Analysis - Porter's Five Forces
- 3.5.1.1. Supplier power
- 3.5.1.2. Buyer power
- 3.5.1.3. Substitution threat
- 3.5.1.4. Threat of new entrant
- 3.5.1.5. Competitive rivalry
- 3.5.2. PESTEL Analysis
- 3.5.2.1. Political landscape
- 3.5.2.2. Technological landscape
- 3.5.2.3. Economic Landscape
- 3.5.1. Industry Analysis - Porter's Five Forces
Chapter 4. Glioblastoma Multiforme Treatment Market: Treatment Estimates & Trend Analysis
- 4.1. Glioblastoma Multiforme Treatment Market: Key Takeaways
- 4.2. Glioblastoma Multiforme Treatment Market: Treatment Movement & Market Share Analysis, 2022 & 2030
- 4.3. Surgery
- 4.3.1. Surgery market estimates and forecasts, 2018 to 2030 (USD Million)
- 4.4. Radiation Therapy
- 4.4.1. Radiation therapy market estimates and forecasts, 2018 to 2030 (USD Million)
- 4.5. Chemotherapy
- 4.5.1. Chemotherapy market estimates and forecasts, 2018 to 2030 (USD Million)
- 4.6. Targeted Therapy
- 4.6.1. Targeted Therapy market estimates and forecasts, 2018 to 2030 (USD Million)
- 4.7. Tumor Treating Field (TTF) Therapy
- 4.7.1. Tumor treating field (TTF) therapy market estimates and forecasts, 2018 to 2030 (USD Million)
- 4.8. Immunotherapy
- 4.8.1. Immunotherapy market estimates and forecasts, 2018 to 2030 (USD Million)
Chapter 5. Glioblastoma Multiforme Treatment Market: Drug Class Estimates & Trend Analysis
- 5.1. Glioblastoma Multiforme Treatment Market: Key Takeaways
- 5.2. Glioblastoma Multiforme Treatment Market: Drug Class Movement & Market Share Analysis, 2022 & 2030
- 5.3. Temozolomide
- 5.3.1. Temozolomide market estimates and forecasts, 2018 to 2030 (USD Million)
- 5.4. Bevacizumab
- 5.4.1. Bevacizumab market estimates and forecasts, 2018 to 2030 (USD Million)
- 5.5. Lomustine
- 5.5.1. Lomustine market estimates and forecasts, 2018 to 2030 (USD Million)
- 5.6. Carmustine Wafers
- 5.6.1. Carmustine Wafers market estimates and forecasts, 2018 to 2030 (USD Million)
- 5.7. Others
- 5.7.1. Others market estimates and forecasts, 2018 to 2030 (USD Million)
Chapter 6. Glioblastoma Multiforme Treatment Market: End Use Estimates & Trend Analysis
- 6.1. Glioblastoma Multiforme Treatment Market: Key Takeaways
- 6.2. Glioblastoma Multiforme Treatment Market: End-use Movement & Market Share Analysis, 2022 & 2030
- 6.3. Hospitals
- 6.3.1. Hospitals market estimates and forecasts, 2018 to 2030 (USD Million)
- 6.4. Clinics
- 6.4.1. Clinics market estimates and forecasts, 2018 to 2030 (USD Million)
- 6.5. Ambulatory Surgical Centers
- 6.5.1. Ambulatory Surgical Centers market estimates and forecasts, 2018 to 2030 (USD Million)
Chapter 7. Glioblastoma Multiforme Treatment Market: Regional Estimates & Trend Analysis
- 7.1. Regional Outlook
- 7.2. Glioblastoma Multiforme Treatment Market by Region: Key Takeaway
- 7.3. North America
- 7.3.1. Market estimates and forecasts, 2018 - 2030 (Revenue, USD Million)
- 7.3.2. U.S.
- 7.3.2.1. Market estimates and forecasts, 2018 - 2030 (Revenue, USD Million)
- 7.3.3. Canada
- 7.3.3.1. Market estimates and forecasts, 2018 - 2030 (Revenue, USD Million)
- 7.4. Europe
- 7.4.1. UK
- 7.4.1.1. Market estimates and forecasts, 2018 - 2030 (Revenue, USD Million)
- 7.4.2. Germany
- 7.4.2.1. Market estimates and forecasts, 2018 - 2030 (Revenue, USD Million)
- 7.4.3. France
- 7.4.3.1. Market estimates and forecasts, 2018 - 2030 (Revenue, USD Million)
- 7.4.4. Italy
- 7.4.4.1. Market estimates and forecasts, 2018 - 2030 (Revenue, USD Million)
- 7.4.5. Spain
- 7.4.5.1. Market estimates and forecasts, 2018 - 2030 (Revenue, USD Million)
- 7.4.6. Sweden
- 7.4.6.1. Market estimates and forecasts, 2018 - 2030 (Revenue, USD Million)
- 7.4.7. Norway
- 7.4.7.1. Market estimates and forecasts, 2018 - 2030 (Revenue, USD Million)
- 7.4.8. Denmark
- 7.4.8.1. Market estimates and forecasts, 2018 - 2030 (Revenue, USD Million)
- 7.4.1. UK
- 7.5. Asia Pacific
- 7.5.1. Japan
- 7.5.1.1. Market estimates and forecasts, 2018 - 2030 (Revenue, USD Million)
- 7.5.2. China
- 7.5.2.1. Market estimates and forecasts, 2018 - 2030 (Revenue, USD Million)
- 7.5.3. India
- 7.5.3.1. Market estimates and forecasts, 2018 - 2030 (Revenue, USD Million)
- 7.5.4. Australia
- 7.5.4.1. Market estimates and forecasts, 2018 - 2030 (Revenue, USD Million)
- 7.5.5. Thailand
- 7.5.5.1. Market estimates and forecasts, 2018 - 2030 (Revenue, USD Million)
- 7.5.6. South Korea
- 7.5.6.1. Market estimates and forecasts, 2018 - 2030 (Revenue, USD Million)
- 7.5.1. Japan
- 7.6. Latin America
- 7.6.1. Brazil
- 7.6.1.1. Market estimates and forecasts, 2018 - 2030 (Revenue, USD Million)
- 7.6.2. Mexico
- 7.6.2.1. Market estimates and forecasts, 2018 - 2030 (Revenue, USD Million)
- 7.6.3. Argentina
- 7.6.3.1. Market estimates and forecasts, 2018 - 2030 (Revenue, USD Million)
- 7.6.1. Brazil
- 7.7. MEA
- 7.7.1. Saudi Arabia
- 7.7.1.1. Market estimates and forecasts, 2018 - 2030 (Revenue, USD Million)
- 7.7.2. South Africa
- 7.7.2.1. Market estimates and forecasts, 2018 - 2030 (Revenue, USD Million)
- 7.7.3. UAE
- 7.7.3.1. Market estimates and forecasts, 2018 - 2030 (Revenue, USD Million)
- 7.7.4. Kuwait
- 7.7.4.1. Market estimates and forecasts, 2018 - 2030 (Revenue, USD Million)
- 7.7.1. Saudi Arabia
Chapter 8. Competitive Landscape
- 8.1. Recent Developments & Impact Analysis, By Key Market Participants
- 8.2. Market Participant Categorization
- 8.2.1. Merck & Co., Inc.
- 8.2.1.1. Company overview
- 8.2.1.2. Financial performance
- 8.2.1.3. Product benchmarking
- 8.2.1.4. Strategic initiatives
- 8.2.2. Sumitomo Dainippon Pharma Oncology, Inc. (Boston Biomedical, Inc.)
- 8.2.2.1. Company overview
- 8.2.2.2. Financial performance
- 8.2.2.3. Product benchmarking
- 8.2.2.4. Strategic initiatives
- 8.2.3. Teva Pharmaceutical Industries Ltd.
- 8.2.3.1. Company overview
- 8.2.3.2. Financial performance
- 8.2.3.3. Product benchmarking
- 8.2.3.4. Strategic initiatives
- 8.2.4. Sun Pharmaceutical Industries Ltd.
- 8.2.4.1. Company overview
- 8.2.4.2. Financial performance
- 8.2.4.3. Product benchmarking
- 8.2.4.4. Strategic initiatives
- 8.2.5. Hoffmann-La Roche Ltd.
- 8.2.5.1. Company overview
- 8.2.5.2. Financial performance
- 8.2.5.3. Product benchmarking
- 8.2.5.4. Strategic initiatives
- 8.2.6. Pfizer, Inc.
- 8.2.6.1. Company overview
- 8.2.6.2. Financial performance
- 8.2.6.3. Product benchmarking
- 8.2.6.4. Strategic initiatives
- 8.2.7. Amgen, Inc.
- 8.2.7.1. Company overview
- 8.2.7.2. Financial performance
- 8.2.7.3. Product benchmarking
- 8.2.7.4. Strategic initiatives
- 8.2.8. Arbor Pharmaceuticals, LLC
- 8.2.8.1. Company overview
- 8.2.8.2. Financial performance
- 8.2.8.3. Product benchmarking
- 8.2.8.4. Strategic initiatives
- 8.2.9. Amneal Pharmaceuticals
- 8.2.9.1. Company overview
- 8.2.9.2. Financial performance
- 8.2.9.3. Product benchmarking
- 8.2.9.4. Strategic initiatives
- 8.2.10. Karyopharm Therapeutics, Inc.
- 8.2.10.1. Company overview
- 8.2.10.2. Financial performance
- 8.2.10.3. Product benchmarking
- 8.2.10.4. Strategic initiatives
- 8.2.1. Merck & Co., Inc.
