|
|
市場調査レポート
商品コード
1363222
臨床微生物市場の市場規模、シェア、動向分析レポート:製品別、疾患別、地域別、セグメント予測、2023年~2030年Clinical Microbiology Market Size, Share & Trends Analysis Report By Product, By Disease (Bloodstream, Respiratory, Gastrointestinal, Periodontal, STD, UTI), By Region, And Segment Forecasts, 2023 - 2030 |
||||||
カスタマイズ可能
|
|||||||


| 臨床微生物市場の市場規模、シェア、動向分析レポート:製品別、疾患別、地域別、セグメント予測、2023年~2030年 |
|
出版日: 2023年09月25日
発行: Grand View Research
ページ情報: 英文 94 Pages
納期: 2~10営業日
|

- 全表示
- 概要
- 図表
- 目次
臨床微生物市場の成長と動向:
Grand View Research, Inc.の最新レポートによると、世界の臨床微生物市場規模は、予測期間中にCAGR 7.1%を記録し、2030年までに76億米ドルに達すると予測されています。
予測期間中のCAGRは6.7%で拡大すると予測されています。臨床微生物は、臨床検体の処理と結果の解釈のために技術的かつ熟練した労働力に依存しています。臨床スタッフは、検査のターンアラウンドタイム(TAT)の悪さに不満を抱いてきました。しかし、技術の進歩に伴い、多くの検査機器や装置が自動化された装置に置き換えられ、人的エラーや熟練労働者への依存を最小限に抑えています。
さらに、自動化には、TATの短縮、労働力とラボスペースの使用削減などの特典があり、それによってこれらの検査に関連する全体的なコストを削減することができます。各メーカーは、自動検体処理、プレート読み取り、生物同定のイントロダクション注力しています。GE Healthcare、PerkinElmer、Thermo Fisherは、診断業界で自動化システムを提供している主要企業の一部です。
院内感染(HAI)の増加も、診断とモニタリングのための臨床微生物への需要を促進しています。高所得国が院内感染対策を強化する中、中低所得国もその脅威を認識しています。自動化システムと革新的な設計のイントロダクションは、市場競争を激化させ、予測期間中に市場力学を変化させると予想されます。
世界保健機関(WHO)は、エチオピア、ブルキナファソ、ナイジェリア、アルジェリア、セネガルなど、HAIの発生率が2.5%~14.8%の国々で特に積極的に活動しています。このため、これらの国々ではHAI診断薬に対する需要が高まっています。インド、スリランカ、パキスタン、ブータンなどの国々も、HAI啓発プログラムに積極的に参加しています。インドと中国は、今後HAI診断機器と検査の需要を牽引する主要国になると予測されています。
臨床微生物市場レポートハイライト
- 予測期間中、分子診断機器分野が最も速い成長率を示すと予測されます。この成長は、がんや感染症の早期発見における分子診断の重要性が高まっていることに起因しています。
- 試薬は、試薬の繰り返し購入により、2022年に最大の収益シェアを獲得しました。
- 2022年には、北米が世界市場を独占しました。感染症治療に関する継続的な研究と、それに続く政府ヘルスケア機関からの助成金が、この地域における強力なエコシステムの発展に寄与しています。
- アジア太平洋地域は、インド、中国、日本における高齢者人口の増加により、予測期間中に最も急成長する地域となる見込みです。その結果、結核、コレラ、腸チフスなどの再興感染症が多発しています。
目次
第1章 調査手法と範囲
第2章 エグゼクティブサマリー
第3章 臨床微生物市場の変数、動向、範囲
- 市場系統の見通し
- 親市場の見通し
- 関連/付随市場の見通し
- 普及と成長の見通しマッピング
- 市場力学
- 市場促進要因の分析
- 市場抑制要因分析
- 臨床微生物市場分析ツール
- 業界分析- ポーターのファイブフォース分析
- PESTEL分析
第4章 臨床微生物:製品別推定・動向分析
- 臨床微生物市場:重要なポイント
- 臨床微生物市場:動向と市場シェア分析、2022年および2030年
- ラボ用器具
- インキュベーター
- グラム染色剤
- 細菌コロニーカウンター
- オートクレーブ滅菌器
- ペトリ皿フィラー
- 自動化培養
- 微生物分析装置
- 分子診断機器
- 顕微鏡
- 質量分析計
- 試薬
第5章 臨床微生物:疾患別推定・動向分析
- 臨床微生物市場:重要なポイント
- 臨床微生物市場:動向と市場シェア分析、2022年および2030年
- 呼吸器疾患
- 血流感染症
- 消化器疾患
- 性感染症
- 尿路感染症
- 歯周病
- その他の病気
第6章 臨床微生物市場:地域別推定・動向分析
- 地域別の展望
- 地域別の臨床微生物市場:重要なポイント
- 北米
- 市場推計・予測、2018~2030年
- 米国
- カナダ
- 欧州
- 英国
- ドイツ
- フランス
- イタリア
- スペイン
- デンマーク
- スウェーデン
- ノルウェー
- アジア太平洋地域
- 日本
- 中国
- インド
- オーストラリア
- タイ
- 韓国
- ラテンアメリカ
- ブラジル
- メキシコ
- アルゼンチン
- 中東・アフリカ
- 南アフリカ
- サウジアラビア
- アラブ首長国連邦
- クウェート
第7章 競合情勢
- 主要市場参入企業による最近の動向と影響分析
- 市場参入企業の分類
- BIOMERIEUX
- Cepheid.
- Danaher Corporation
- Bruker Corporation
- BD
- Hologic, Inc.
- F. Hoffmann-La Roche Ltd
- Alere, Inc.
List of Tables
- Table 1 List of Abbreviation
- Table 2 North America clinical microbiology market, by product, 2018 - 2030 (USD Million)
- Table 3 North America clinical microbiology market, by disease, 2018 - 2030 (USD Million)
- Table 4 North America clinical microbiology market, by region, 2018 - 2030 (USD Million)
- Table 5 U.S. clinical microbiology market, by product, 2018 - 2030 (USD Million)
- Table 6 U.S. clinical microbiology market, by disease, 2018 - 2030 (USD Million)
- Table 7 Canada clinical microbiology market, by product, 2018 - 2030 (USD Million)
- Table 8 Canada clinical microbiology market, by disease, 2018 - 2030 (USD Million)
- Table 9 Europe clinical microbiology market, by product, 2018 - 2030 (USD Million)
- Table 10 Europe clinical microbiology market, by disease, 2018 - 2030 (USD Million)
- Table 11 Europe clinical microbiology market, by region, 2018 - 2030 (USD Million)
- Table 12 Germany clinical microbiology market, by product, 2018 - 2030 (USD Million)
- Table 13 Germany clinical microbiology market, by disease, 2018 - 2030 (USD Million)
- Table 14 UK clinical microbiology market, by product, 2018 - 2030 (USD Million)
- Table 15 UK clinical microbiology market, by disease, 2018 - 2030 (USD Million)
- Table 16 France clinical microbiology market, by product, 2018 - 2030 (USD Million)
- Table 17 France clinical microbiology market, by disease, 2018 - 2030 (USD Million)
- Table 18 Italy clinical microbiology market, by product, 2018 - 2030 (USD Million)
- Table 19 Italy clinical microbiology market, by disease, 2018 - 2030 (USD Million)
- Table 20 Spain clinical microbiology market, by product, 2018 - 2030 (USD Million)
- Table 21 Spain clinical microbiology market, by disease, 2018 - 2030 (USD Million)
- Table 22 Denmark clinical microbiology market, by product, 2018 - 2030 (USD Million)
- Table 23 Denmark clinical microbiology market, by disease, 2018 - 2030 (USD Million)
- Table 24 Sweden clinical microbiology market, by product, 2018 - 2030 (USD Million)
- Table 25 Sweden clinical microbiology market, by disease, 2018 - 2030 (USD Million)
- Table 26 Norway clinical microbiology market, by product, 2018 - 2030 (USD Million)
- Table 27 Norway clinical microbiology market, by disease, 2018 - 2030 (USD Million)
- Table 28 Asia Pacific clinical microbiology market, by product, 2018 - 2030 (USD Million)
- Table 29 Asia Pacific clinical microbiology market, by disease, 2018 - 2030 (USD Million)
- Table 30 Asia Pacific clinical microbiology market, by region, 2018 - 2030 (USD Million)
- Table 31 Japan clinical microbiology market, by product, 2018 - 2030 (USD Million)
- Table 32 Japan clinical microbiology market, by disease, 2018 - 2030 (USD Million)
- Table 33 China clinical microbiology market, by product, 2018 - 2030 (USD Million)
- Table 34 China clinical microbiology market, by disease, 2018 - 2030 (USD Million)
- Table 35 India clinical microbiology market, by product, 2018 - 2030 (USD Million)
- Table 36 India clinical microbiology market, by disease, 2018 - 2030 (USD Million)
- Table 37 Australia clinical microbiology market, by product, 2018 - 2030 (USD Million)
- Table 38 Australia clinical microbiology market, by disease, 2018 - 2030 (USD Million)
- Table 39 Thailand clinical microbiology market, by product, 2018 - 2030 (USD Million)
- Table 40 Thailand clinical microbiology market, by disease, 2018 - 2030 (USD Million)
- Table 41 South Korea clinical microbiology market, by product, 2018 - 2030 (USD Million)
- Table 42 South Korea clinical microbiology market, by disease, 2018 - 2030 (USD Million)
- Table 43 Latin America clinical microbiology market, by product, 2018 - 2030 (USD Million)
- Table 44 Latin America clinical microbiology market, by disease, 2018 - 2030 (USD Million)
- Table 45 Latin America clinical microbiology market, by region, 2018 - 2030 (USD Million)
- Table 46 Brazil clinical microbiology market, by product, 2018 - 2030 (USD Million)
- Table 47 Brazil clinical microbiology market, by disease, 2018 - 2030 (USD Million)
- Table 48 Mexico clinical microbiology market, by product, 2018 - 2030 (USD Million)
- Table 49 Mexico clinical microbiology market, by disease, 2018 - 2030 (USD Million)
- Table 50 Argentina clinical microbiology market, by product, 2018 - 2030 (USD Million)
- Table 51 Argentina clinical microbiology market, by disease, 2018 - 2030 (USD Million)
- Table 52 Middle East and Africa clinical microbiology market, by product, 2018 - 2030 (USD Million)
- Table 53 Middle East and Africa clinical microbiology market, by disease, 2018 - 2030 (USD Million)
- Table 54 Middle East and Africa clinical microbiology market, by region, 2018 - 2030 (USD Million)
- Table 55 South Africa clinical microbiology market, by product, 2018 - 2030 (USD Million)
- Table 56 South Africa clinical microbiology market, by disease, 2018 - 2030 (USD Million)
- Table 57 Saudi Arabia clinical microbiology market, by product, 2018 - 2030 (USD Million)
- Table 58 Saudi Arabia clinical microbiology market, by disease, 2018 - 2030 (USD Million)
- Table 59 UAE clinical microbiology market, by product, 2018 - 2030 (USD Million)
- Table 60 UAE clinical microbiology market, by disease, 2018 - 2030 (USD Million)
- Table 61 Kuwait clinical microbiology market, by product, 2018 - 2030 (USD Million)
- Table 62 Kuwait clinical microbiology market, by disease, 2018 - 2030 (USD Million)
List of Figures
- Fig. 1 Market research process
- Fig. 2 Data triangulation techniques
- Fig. 3 Primary research pattern
- Fig. 4 Market research approaches
- Fig. 5 Value-chain-based sizing & forecasting
- Fig. 6 QFD modeling for market share assessment
- Fig. 7 Market formulation & validation
- Fig. 8 Clinical Microbiology: Market outlook
- Fig. 9 Clinical Microbiology: Competitive insights
- Fig. 10 Parent market outlook
- Fig. 11 Related/ancillary market outlook
- Fig. 12 Penetration and growth prospect mapping
- Fig. 13 Industry value chain analysis
- Fig. 14 Clinical microbiology market driver impact
- Fig. 15 Clinical microbiology market restraint impact
- Fig. 16 Clinical microbiology market strategic initiatives analysis
- Fig. 17 Clinical microbiology market: Product movement analysis
- Fig. 18 Clinical microbiology market: product outlook and key takeaways
- Fig. 19 Laboratory instruments market estimates and forecasts, 2018 - 2030 (USD Million)
- Fig. 20 Incubators market estimates and forecasts, 2018 - 2030 (USD Million)
- Fig. 21 Gram stainers market estimates and forecasts, 2018 - 2030 (USD Million)
- Fig. 22 Bacterial colony counters market estimates and forecasts, 2018 - 2030 (USD Million)
- Fig. 23 Autoclave sterilizers market estimates and forecasts, 2018 - 2030 (USD Million)
- Fig. 24 Petri dish fillers market estimates and forecasts, 2018 - 2030 (USD Million)
- Fig. 25 Automated culture systems market estimates and forecasts, 2018 - 2030 (USD Million)
- Fig. 26 Microbiology analyzers market estimates and forecasts, 2018 - 2030 (USD Million)
- Fig. 27 Molecular diagnostic instruments market estimates and forecasts, 2018 - 2030 (USD Million)
- Fig. 28 Microscopes market estimates and forecasts, 2018 - 2030 (USD Million)
- Fig. 29 Mass spectrometers market estimates and forecasts, 2018 - 2030 (USD Million)
- Fig. 30 Reagents market estimates and forecasts, 2018 - 2030 (USD Million)
- Fig. 31 Clinical microbiology market: Disease movement analysis
- Fig. 32 Clinical microbiology market: disease outlook and key takeaways
- Fig. 33 Respiratory diseases market estimates and forecasts, 2018 - 2030 (USD Million)
- Fig. 34 Bloodstream infections market estimates and forecasts, 2018 - 2030 (USD Million)
- Fig. 35 Gastrointestinal diseases market estimates and forecasts, 2018 - 2030 (USD Million)
- Fig. 36 Sexually transmitted diseases market estimates and forecasts, 2018 - 2030 (USD Million)
- Fig. 37 Urinary tract infections market estimates and forecasts, 2018 - 2030 (USD Million)
- Fig. 38 Periodontal diseases market estimates and forecasts, 2018 - 2030 (USD Million)
- Fig. 39 Other diseases market estimates and forecasts, 2018 - 2030 (USD Million)
- Fig. 40 Global clinical microbiology market: Regional movement analysis
- Fig. 41 Global clinical microbiology market: Regional outlook and key takeaways
- Fig. 42 North America market estimates and forecasts, 2018 - 2030 (USD Million)
- Fig. 43 U.S. market estimates and forecasts, 2018 - 2030 (USD Million)
- Fig. 44 Canada market estimates and forecasts, 2018 - 2030 (USD Million)
- Fig. 45 Europe market estimates and forecasts, 2018 - 2030 (USD Million)
- Fig. 46 UK market estimates and forecasts, 2018 - 2030 (USD Million)
- Fig. 47 Germany market estimates and forecasts, 2018 - 2030 (USD Million)
- Fig. 48 France market estimates and forecasts, 2018 - 2030 (USD Million)
- Fig. 49 Italy market estimates and forecasts, 2018 - 2030 (USD Million)
- Fig. 50 Spain market estimates and forecasts, 2018 - 2030 (USD Million)
- Fig. 51 Denmark market estimates and forecasts, 2018 - 2030 (USD Million)
- Fig. 52 Sweden market estimates and forecasts, 2018 - 2030 (USD Million)
- Fig. 53 Norway market estimates and forecasts, 2018 - 2030 (USD Million)
- Fig. 54 Asia Pacific market estimates and forecasts, 2018 - 2030 (USD Million)
- Fig. 55 Japan market estimates and forecasts, 2018 - 2030 (USD Million)
- Fig. 56 China market estimates and forecasts, 2018 - 2030 (USD Million)
- Fig. 57 India market estimates and forecasts, 2018 - 2030 (USD Million)
- Fig. 58 Australia market estimates and forecasts, 2018 - 2030 (USD Million)
- Fig. 59 Thailand market estimates and forecasts, 2018 - 2030 (USD Million)
- Fig. 60 South Korea market estimates and forecasts, 2018 - 2030 (USD Million)
- Fig. 61 Latin America market estimates and forecasts, 2018 - 2030 (USD Million)
- Fig. 62 Brazil market estimates and forecasts, 2018 - 2030 (USD Million)
- Fig. 63 Mexico market estimates and forecasts, 2018 - 2030 (USD Million)
- Fig. 64 Argentina market estimates and forecasts, 2018 - 2030 (USD Million)
- Fig. 65 Middle East and Africa. market estimates and forecasts, 2018 - 2030 (USD Million)
- Fig. 66 South Africa market estimates and forecasts, 2018 - 2030 (USD Million)
- Fig. 67 Saudi Arabia market estimates and forecasts, 2018 - 2030 (USD Million)
- Fig. 68 UAE market estimates and forecasts, 2018 - 2030 (USD Million)
- Fig. 69 Kuwait market estimates and forecasts, 2018 - 2030 (USD Million)
Clinical Microbiology Market Growth & Trends:
The global clinical microbiology market size is expected to reach USD 7.6 billion by 2030, registering a CAGR of 7.1% during the forecast period, according to a new report by Grand View Research, Inc.. It is projected to expand at a CAGR of 6.7% over the forecast period. Clinical microbiology depends on technical and skilled workforce to process and interpret results of clinical specimens. Clinical staff have been complaining about poor Turnaround Time (TAT) of tests. However, with technological advancements, a number of laboratory instruments and equipment are being replaced with automated devices to minimize human error and dependency on skilled workforce.
In addition, automation has benefits such as reduced TAT and use of labor and lab space, thereby reducing overall cost associated with these tests. Manufacturers are focusing on introduction of automatic specimen processing, plate reading, and organism identification. GE Healthcare, PerkinElmer, and Thermo Fisher are some of the key players offering automated systems in the diagnostics industry.
Rising cases of hospital-acquired infections (HAI) is also fueling demand for clinical microbiology for diagnosis and monitoring. As high-income countries are stepping up their pursuit of countering hospital-acquired infections, middle- and low-income countries are recognizing the threat. Introduction of automated systems and innovative designs is expected to intensify market competition and change market dynamics over the forecast period.
The World Health Organization (WHO) is particularly active in countries such as Ethiopia, Burkina Faso, Nigeria, Algeria, and Senegal, where occurrence of HAIs ranged between 2.5% and 14.8%. This has led to increased demand for HAI diagnostics in these countries. Countries such as India, Sri Lanka, Pakistan, and Bhutan are also actively participating in HAI awareness programs. India and China are projected to be the main countries driving demand for HAI diagnostics instruments and tests in future.
Clinical Microbiology Market Report Highlights:
- The molecular diagnostic instruments segment is expected to exhibit the fastest growth rate over the forecast period. This growth can be attributed to the increasing significance of molecular diagnosis in the early detection of cancer and infectious diseases.
- Reagents captured the largest revenue share in 2022 owing to repeat purchase of reagents
- In 2022, North America dominated the global market. Continuous research on infectious disease treatment and subsequent grants from government healthcare agencies are contributing to development of a strong ecosystem in the region
- Asia Pacific is expected to emerge as the fastest growing region during the forecast period owing to rising geriatric population in India, China, and Japan. This has resulted in high prevalence of re-emerging infectious diseases such as tuberculosis, cholera, and typhoid
Table of Contents
Chapter 1. Methodology and Scope
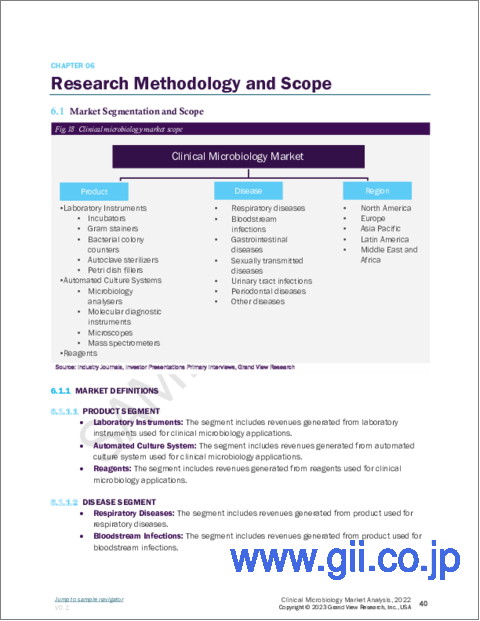
- 1.1. Market Segmentation & Scope
- 1.1.1. Product
- 1.1.2. Disease
- 1.1.3. Regional scope
- 1.1.4. Estimates and forecast timeline
- 1.2. Research Methodology
- 1.3. Information Procurement
- 1.3.1. Purchased database
- 1.3.2. GVR's internal database
- 1.3.3. Secondary sources
- 1.3.4. Primary research
- 1.3.5. Details of primary research
- 1.4. Information or Data Analysis
- 1.5. Market Formulation & Validation
- 1.6. Model Details
- 1.7. List of Secondary Sources
- 1.8. List of Primary Sources
- 1.9. Objectives
Chapter 2. Executive Summary
- 2.1. Market Outlook
- 2.2. Segment Outlook
- 2.2.1. Product outlook
- 2.2.2. Disease outlook
- 2.2.3. Regional outlook
- 2.3. Competitive Insights
Chapter 3. Clinical Microbiology Market Variables, Trends & Scope
- 3.1. Market Lineage Outlook
- 3.1.1. Parent market outlook
- 3.1.2. Related/ancillary market outlook
- 3.2. Penetration & Growth Prospect Mapping
- 3.3. Market Dynamics
- 3.3.1. Market driver analysis
- 3.3.2. Market restraint analysis
- 3.4. Clinical Microbiology Market Analysis Tools
- 3.4.1. Industry Analysis - Porter's
- 3.4.1.1. Supplier power
- 3.4.1.2. Buyer power
- 3.4.1.3. Substitution threat
- 3.4.1.4. Threat of new entrant
- 3.4.1.5. Competitive rivalry
- 3.4.2. PESTEL Analysis
- 3.4.2.1. Political landscape
- 3.4.2.2. Technological landscape
- 3.4.2.3. Economic landscape
- 3.4.1. Industry Analysis - Porter's
Chapter 4. Clinical Microbiology : Product Estimates & Trend Analysis
- 4.1. Clinical Microbiology Market: Key Takeaways
- 4.2. Clinical Microbiology Market: Movement & Market Share Analysis, 2022 & 2030
- 4.3. Laboratory Instruments
- 4.3.1. Laboratory instruments market estimates and forecasts, 2018 to 2030 (USD Million)
- 4.3.2. Incubators
- 4.3.2.1. Incubators market estimates and forecasts, 2018 to 2030 (USD Million)
- 4.3.3. Gram stainers
- 4.3.3.1. Gram stainers market estimates and forecasts, 2018 to 2030 (USD Million)
- 4.3.4. Bacterial colony counters
- 4.3.4.1. Bacterial colony counters market estimates and forecasts, 2018 to 2030 (USD Million)
- 4.3.5. Autoclave sterilizers
- 4.3.5.1. Autoclave sterilizers market estimates and forecasts, 2018 to 2030 (USD Million)
- 4.3.6. Petri dish fillers
- 4.3.6.1. Petri dish fillers market estimates and forecasts, 2018 to 2030 (USD Million)
- 4.4. Automated Culture
- 4.4.1. Automated culture market estimates and forecasts, 2018 to 2030 (USD Million)
- 4.4.2. Microbiology analyzers
- 4.4.2.1. Microbiology analyzers market estimates and forecasts, 2018 to 2030 (USD Million)
- 4.4.3. Molecular diagnostic instruments
- 4.4.3.1. Molecular diagnostic instruments market estimates and forecasts, 2018 to 2030 (USD Million)
- 4.4.4. Microscopes
- 4.4.4.1. Microscopes market estimates and forecasts, 2018 to 2030 (USD Million)
- 4.4.5. Mass spectrometers
- 4.4.5.1. Mass spectrometers market estimates and forecasts, 2018 to 2030 (USD Million)
- 4.5. Reagents
- 4.5.1. Reagents market estimates and forecasts, 2018 to 2030 (USD Million)
Chapter 5. Clinical Microbiology: Disease Estimates & Trend Analysis
- 5.1. Clinical Microbiology Market: Key Takeaways
- 5.2. Clinical Microbiology Market: Movement & Market Share Analysis, 2022 & 2030
- 5.3. Respiratory Diseases
- 5.3.1. Respiratory diseases market estimates and forecasts, 2018 to 2030 (USD Million)
- 5.4. Bloodstream Infections
- 5.4.1. Bloodstream infections market estimates and forecasts, 2018 to 2030 (USD Million)
- 5.5. Gastrointestinal Diseases
- 5.5.1. Gastrointestinal diseases market estimates and forecasts, 2018 to 2030 (USD Million)
- 5.6. Sexually Transmitted Diseases
- 5.6.1. Sexually transmitted diseases market estimates and forecasts, 2018 to 2030 (USD Million)
- 5.7. Urinary Tract Infections
- 5.7.1. Urinary tract infections market estimates and forecasts, 2018 to 2030 (USD Million)
- 5.8. Periodontal Diseases
- 5.8.1. Periodontal diseases market estimates and forecasts, 2018 to 2030 (USD Million)
- 5.9. Other Diseases
- 5.9.1. Other diseases market estimates and forecasts, 2018 to 2030 (USD Million)
Chapter 6. Clinical Microbiology Market: Regional Estimates & Trend Analysis
- 6.1. Regional Outlook
- 6.2. Clinical Microbiology Market by Region: Key Takeaways
- 6.3. North America
- 6.3.1. Market estimates and forecasts, 2018 - 2030 (Revenue, USD Million)
- 6.3.2. U.S.
- 6.3.2.1. Market estimates and forecasts, 2018 - 2030 (Revenue, USD Million)
- 6.3.3. Canada
- 6.3.3.1. Market estimates and forecasts, 2018 - 2030 (Revenue, USD Million)
- 6.4. Europe
- 6.4.1. UK
- 6.4.1.1. Market estimates and forecasts, 2018 - 2030 (Revenue, USD Million)
- 6.4.2. Germany
- 6.4.2.1. Market estimates and forecasts, 2018 - 2030 (Revenue, USD Million)
- 6.4.3. France
- 6.4.3.1. Market estimates and forecasts, 2018 - 2030 (Revenue, USD Million)
- 6.4.4. Italy
- 6.4.4.1. Market estimates and forecasts, 2018 - 2030 (Revenue, USD Million)
- 6.4.5. Spain
- 6.4.5.1. Market estimates and forecasts, 2018 - 2030 (Revenue, USD Million)
- 6.4.6. Denmark
- 6.4.6.1. Market estimates and forecasts, 2018 - 2030 (Revenue, USD Million)
- 6.4.7. Sweden
- 6.4.7.1. Market estimates and forecasts, 2018 - 2030 (Revenue, USD Million)
- 6.4.8. Norway
- 6.4.8.1. Market estimates and forecasts, 2018 - 2030 (Revenue, USD Million)
- 6.4.1. UK
- 6.5. Asia Pacific
- 6.5.1. Japan
- 6.5.1.1. Market estimates and forecasts, 2018 - 2030 (Revenue, USD Million)
- 6.5.2. China
- 6.5.2.1. Market estimates and forecasts, 2018 - 2030 (Revenue, USD Million)
- 6.5.3. India
- 6.5.3.1. Market estimates and forecasts, 2018 - 2030 (Revenue, USD Million)
- 6.5.4. Australia
- 6.5.4.1. Market estimates and forecasts, 2018 - 2030 (Revenue, USD Million)
- 6.5.5. Thailand
- 6.5.5.1. Market estimates and forecasts, 2018 - 2030 (Revenue, USD Million)
- 6.5.6. South Korea
- 6.5.6.1. Market estimates and forecasts, 2018 - 2030 (Revenue, USD Million)
- 6.5.1. Japan
- 6.6. Latin America
- 6.6.1. Brazil
- 6.6.1.1. Market estimates and forecasts, 2018 - 2030 (Revenue, USD Million)
- 6.6.2. Mexico
- 6.6.2.1. Market estimates and forecasts, 2018 - 2030 (Revenue, USD Million)
- 6.6.3. Argentina
- 6.6.3.1. Market estimates and forecasts, 2018 - 2030 (Revenue, USD Million)
- 6.6.1. Brazil
- 6.7. MEA
- 6.7.1. South Africa
- 6.7.1.1. Market estimates and forecasts, 2018 - 2030 (Revenue, USD Million)
- 6.7.2. Saudi Arabia
- 6.7.2.1. Market estimates and forecasts, 2018 - 2030 (Revenue, USD Million)
- 6.7.3. UAE
- 6.7.3.1. Market estimates and forecasts, 2018 - 2030 (Revenue, USD Million)
- 6.7.4. Kuwait
- 6.7.4.1. Market estimates and forecasts, 2018 - 2030 (Revenue, USD Million)
- 6.7.1. South Africa
Chapter 7. Competitive Landscape
- 7.1. Recent Developments & Impact Analysis, By Key Market Participants
- 7.2. Market Participant Categorization
- 7.2.1. BIOMERIEUX
- 7.2.1.1. Company overview
- 7.2.1.2. Financial performance
- 7.2.1.3. Product benchmarking
- 7.2.1.4. Strategic initiatives
- 7.2.2. Cepheid.
- 7.2.2.1. Company overview
- 7.2.2.2. Financial performance
- 7.2.2.3. Product benchmarking
- 7.2.2.4. Strategic initiatives
- 7.2.3. Danaher Corporation
- 7.2.3.1. Company overview
- 7.2.3.2. Financial performance
- 7.2.3.3. Product benchmarking
- 7.2.3.4. Strategic initiatives
- 7.2.4. Bruker Corporation
- 7.2.4.1. Company overview
- 7.2.4.2. Financial performance
- 7.2.4.3. Product benchmarking
- 7.2.4.4. Strategic initiatives
- 7.2.5. BD
- 7.2.5.1. Company overview
- 7.2.5.2. Financial performance
- 7.2.5.3. Product benchmarking
- 7.2.5.4. Strategic initiatives
- 7.2.6. Hologic, Inc.
- 7.2.6.1. Company overview
- 7.2.6.2. Financial performance
- 7.2.6.3. Product benchmarking
- 7.2.6.4. Strategic initiatives
- 7.2.7. F. Hoffmann-La Roche Ltd
- 7.2.7.1. Company overview
- 7.2.7.2. Financial performance
- 7.2.7.3. Product benchmarking
- 7.2.7.4. Strategic initiatives
- 7.2.8. Alere, Inc.
- 7.2.8.1. Company overview
- 7.2.8.2. Financial performance
- 7.2.8.3. Product benchmarking
- 7.2.8.4. Strategic initiatives
- 7.2.1. BIOMERIEUX
