|
|
市場調査レポート
商品コード
1529780
子宮マニピュレーション機器の市場規模、シェア、動向分析レポート:用途別、最終用途別、地域別、セグメント別予測、2024年~2030年Uterine Manipulation Devices Market Size, Share & Trends Analysis Report By Application (Total Laparoscopy Hysterectomy, Laparoscopic Supracervical Hysterectomy), By End-use, By Region, And Segment Forecasts, 2024 - 2030 |
||||||

|
|||||||
カスタマイズ可能
|
|||||||

| 子宮マニピュレーション機器の市場規模、シェア、動向分析レポート:用途別、最終用途別、地域別、セグメント別予測、2024年~2030年 |
|
出版日: 2024年07月17日
発行: Grand View Research
ページ情報: 英文 165 Pages
納期: 2~10営業日
|

全表示
- 概要
- 図表
- 目次
子宮マニピュレーション機器市場の成長と動向:
Grand View Research社の最新レポートによると、子宮マニピュレーション機器の世界市場規模は、2024年から2030年にかけて5.93%のCAGRを記録し、2030年には4億2,179万米ドルに達する見込みです。
婦人科疾患の有病率の急増は、低侵襲外科処置への嗜好の高まりと相まって、市場の主要な促進要因となっています。
様々な婦人科疾患の有病率の増加、使いやすさと利便性による子宮マニピュレーション機器の採用の増加は、予測期間中の市場成長を押し上げると予想される要因の1つです。UF腫瘍の有病率は女性が高齢になるにつれて増加し、40~60歳の女性の30%以上にみられます。UFは通常、40代後半から50代前半の女性に発症するが、一部の女性では若年で発症することもあります。このように、UFに悩む女性の増加により、子宮摘出手術の件数が増加し、子宮マニピュレーション機器の大きな需要につながっています。
さらに、複数の主要企業が革新的な低侵襲・非侵襲手術器具の発売に向けて研究開発に投資しています。現在、市場ではさまざまな先進的マニピュレーターが販売されています。例えば、人工肛門の手術では、通常、子宮頸部にフィットするカップ付きのマニピュレーターが好まれます。RUMIとKOHカップの組み合わせ(CooperSurgical社製)やVCare(CONMED社製)などがそれです。したがって、これらの器具が提供するさまざまな利点が、低侵襲手術の需要を押し上げ、市場の成長を促進する要因となっています。
子宮マニピュレーション機器市場レポートハイライト:
- 用途別では、腹腔鏡下子宮全摘術(TLH)が2023年の収益シェア38.33%で市場を独占しました。低侵襲手術への嗜好の高まりが、同分野の成長を後押しする主要因となっています。
- 最終用途別では、病院セグメントが2023年の売上高シェア59.37%で市場を独占しました。このセグメントの成長の主な要因は、様々な婦人科疾患を患う患者数の増加です。
- ラテンアメリカ市場は、婦人科疾患の有病率の上昇と、ブラジルやアルゼンチンのような国全体で子宮内膜症に対する認識を提供するためのイニシアチブの増加により、予測期間中に最も速い成長を示すことが期待されています。
目次
第1章 調査手法と範囲
第2章 エグゼクティブサマリー
第3章 子宮マニピュレーション機器市場の変数、動向、範囲
- 市場系統の見通し
- 補助市場の見通し
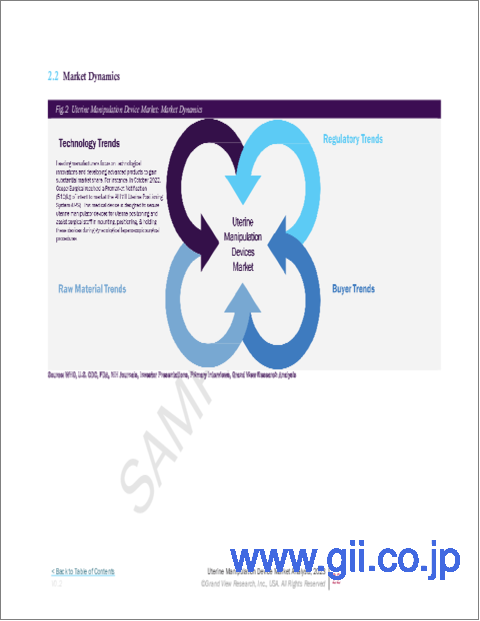
- 市場力学
- 市場 促進要因分析
- 市場抑制要因分析
- 子宮マニピュレーション機器市場分析ツール
- 業界分析- ポーターのファイブフォース分析
- PESTEL分析
第4章 子宮マニピュレーション機器市場:用途別推定・動向分析
- セグメントダッシュボード
- 世界の子宮マニピュレーション機器市場の変動分析
- 世界の子宮マニピュレーション機器市場規模と動向分析、用途別、2018~2030年
- 腹腔鏡下子宮全摘出術(TLH)
- 腹腔鏡下子宮頸部切除術(LSH)
- 腹腔鏡補助膣式子宮摘出術(LAVH)
- 仙骨膣固定術
- その他
第5章 子宮マニピュレーション機器市場:最終用途別推定・動向分析
- セグメントダッシュボード
- 世界の子宮マニピュレーション機器市場の変動分析
- 世界の子宮マニピュレーション機器市場規模と動向分析、最終用途別、2018~2030年
- 病院
- クリニック
- 外来手術センター(ASC)
第6章 子宮マニピュレーション機器市場:地域別推定・動向分析(用途別、最終用途別)
- 地域ダッシュボード
- 市場規模と予測および動向分析、2018年から2030年
- 北米
- 欧州
- アジア太平洋
- ラテンアメリカ
- 中東・アフリカ
第7章 競合情勢
- 市場参入企業の分類
- 主要企業プロファイル
- Conkin Surgical Instrument Ltd.
- CooperSurgical Inc.
- B. Braun SE
- KARL STORZ SE &Co. KG
- CONMED Corporation
- Richard Wolf GmbH
- Utah Medical Products, Inc
- Purple Surgical
- Laborie
- LSI Solutions, Inc.
- ヒートマップ分析/企業市況分析
- 2023年の企業市場シェアの推定分析
- その他の主要市場プレーヤーのリスト
List of Tables
- Table 1 List of Secondary Sources
- Table 2 List of Abbreviations
- Table 3 Global Uterine Manipulation Devices Market, by Region, 2018 - 2030 (USD Million)
- Table 4 Global Uterine Manipulation Devices Market, by Application, 2018 - 2030 (USD Million)
- Table 5 Global Uterine Manipulation Devices Market, by End Use, 2018 - 2030 (USD Million)
- Table 6 North America Uterine Manipulation Devices Market, by Country, 2018 - 2030 (USD Million)
- Table 7 North America Uterine Manipulation Devices Market, by Application, 2018 - 2030 (USD Million)
- Table 8 North America Uterine Manipulation Devices Market, by End Use, 2018 - 2030 (USD Million)
- Table 9 U.S. Uterine Manipulation Devices Market, by Application, 2018 - 2030 (USD Million)
- Table 10 U.S. Uterine Manipulation Devices Market, by End Use, 2018 - 2030 (USD Million)
- Table 11 Canada Uterine Manipulation Devices Market, by Application, 2018 - 2030 (USD Million)
- Table 12 Canada Uterine Manipulation Devices Market, by End Use, 2018 - 2030 (USD Million)
- Table 13 Mexico Uterine Manipulation Devices Market, by Application, 2018 - 2030 (USD Million)
- Table 14 Mexico Uterine Manipulation Devices Market, by End Use, 2018 - 2030 (USD Million)
- Table 15 Europe Uterine Manipulation Devices Market, by Country, 2018 - 2030 (USD Million)
- Table 16 Europe Uterine Manipulation Devices Market, by Application, 2018 - 2030 (USD Million)
- Table 17 Europe Uterine Manipulation Devices Market, by End Use, 2018 - 2030 (USD Million)
- Table 18 Germany Uterine Manipulation Devices Market, by Application, 2018 - 2030 (USD Million)
- Table 19 Germany Uterine Manipulation Devices Market, by End Use, 2018 - 2030 (USD Million)
- Table 20 UK Uterine Manipulation Devices Market, by Application, 2018 - 2030 (USD Million)
- Table 21 UK Uterine Manipulation Devices Market, by End Use, 2018 - 2030 (USD Million)
- Table 22 France Uterine Manipulation Devices Market, by Application, 2018 - 2030 (USD Million)
- Table 23 France Uterine Manipulation Devices Market, by End Use, 2018 - 2030 (USD Million)
- Table 24 Italy Uterine Manipulation Devices Market, by Application, 2018 - 2030 (USD Million)
- Table 25 Italy Uterine Manipulation Devices Market, by End Use, 2018 - 2030 (USD Million)
- Table 26 Spain Uterine Manipulation Devices Market, by Application, 2018 - 2030 (USD Million)
- Table 27 Spain Uterine Manipulation Devices Market, by End Use, 2018 - 2030 (USD Million)
- Table 28 Denmark Uterine Manipulation Devices Market, by Application, 2018 - 2030 (USD Million)
- Table 29 Denmark Uterine Manipulation Devices Market, by End Use, 2018 - 2030 (USD Million)
- Table 30 Sweden Uterine Manipulation Devices Market, by Application, 2018 - 2030 (USD Million)
- Table 31 Sweden Uterine Manipulation Devices Market, by End Use, 2018 - 2030 (USD Million)
- Table 32 Norway Uterine Manipulation Devices Market, by Application, 2018 - 2030 (USD Million)
- Table 33 Norway Uterine Manipulation Devices Market, by End Use, 2018 - 2030 (USD Million)
- Table 34 Asia Pacific Uterine Manipulation Devices Market, by Country, 2018 - 2030 (USD Million)
- Table 35 Asia Pacific Uterine Manipulation Devices Market, by Application, 2018 - 2030 (USD Million)
- Table 36 Asia Pacific Uterine Manipulation Devices Market, by End Use, 2018 - 2030 (USD Million)
- Table 37 China Uterine Manipulation Devices Market, by Application, 2018 - 2030 (USD Million)
- Table 38 China Uterine Manipulation Devices Market, by End Use, 2018 - 2030 (USD Million)
- Table 39 Japan Uterine Manipulation Devices Market, by Application, 2018 - 2030 (USD Million)
- Table 40 Japan Uterine Manipulation Devices Market, by End Use, 2018 - 2030 (USD Million)
- Table 41 India Uterine Manipulation Devices Market, by Application, 2018 - 2030 (USD Million)
- Table 42 India Uterine Manipulation Devices Market, by End Use, 2018 - 2030 (USD Million)
- Table 43 South Korea Uterine Manipulation Devices Market, by Application, 2018 - 2030 (USD Million)
- Table 44 South Korea Uterine Manipulation Devices Market, by End Use, 2018 - 2030 (USD Million)
- Table 45 Australia Uterine Manipulation Devices Market, by Application, 2018 - 2030 (USD Million)
- Table 46 Australia Uterine Manipulation Devices Market, by End Use, 2018 - 2030 (USD Million)
- Table 47 Thailand Uterine Manipulation Devices Market, by Application, 2018 - 2030 (USD Million)
- Table 48 Thailand Uterine Manipulation Devices Market, by End Use, 2018 - 2030 (USD Million)
- Table 49 Latin America Uterine Manipulation Devices Market, by Country, 2018 - 2030 (USD Million)
- Table 50 Latin America Uterine Manipulation Devices Market, by Application, 2018 - 2030 (USD Million)
- Table 51 Latin America Uterine Manipulation Devices Market, by End Use, 2018 - 2030 (USD Million)
- Table 52 Brazil Uterine Manipulation Devices Market, by Application, 2018 - 2030 (USD Million)
- Table 53 Brazil Uterine Manipulation Devices Market, by End Use, 2018 - 2030 (USD Million)
- Table 54 Argentina Uterine Manipulation Devices Market, by Application, 2018 - 2030 (USD Million)
- Table 55 Argentina Uterine Manipulation Devices Market, by End Use, 2018 - 2030 (USD Million)
- Table 56 Middle East & Africa Uterine Manipulation Devices Market, by Country, 2018 - 2030 (USD Million)
- Table 57 Middle East & Africa Uterine Manipulation Devices Market, by Application, 2018 - 2030 (USD Million)
- Table 58 Middle East & Africa Uterine Manipulation Devices Market, by End Use, 2018 - 2030 (USD Million)
- Table 59 South Africa Uterine Manipulation Devices Market, by Application, 2018 - 2030 (USD Million)
- Table 60 South Africa Uterine Manipulation Devices Market, by End Use, 2018 - 2030 (USD Million)
- Table 61 Saudi Arabia Uterine Manipulation Devices Market, by Application, 2018 - 2030 (USD Million)
- Table 62 Saudi Arabia Uterine Manipulation Devices Market, by End Use, 2018 - 2030 (USD Million)
- Table 63 UAE Uterine Manipulation Devices Market, by Application, 2018 - 2030 (USD Million)
- Table 64 UAE Uterine Manipulation Devices Market, by End Use, 2018 - 2030 (USD Million)
- Table 65 Kuwait Uterine Manipulation Devices Market, by Application, 2018 - 2030 (USD Million)
- Table 66 Kuwait Uterine Manipulation Devices Market, by End Use, 2018 - 2030 (USD Million)
- Table 67 Participant's Overview
- Table 68 Financial Performance
- Table 69 Product Benchmarking
- Table 70 Strategic Initiatives
List of Figures
- Fig. 1 Information Procurement
- Fig. 2 Primary Research Pattern
- Fig. 3 Market Research Approaches
- Fig. 4 Value Chain-Based Sizing & Forecasting
- Fig. 5 Market Formulation & Validation
- Fig. 6 Uterine Manipulation Devices Market, Market Segmentation
- Fig. 7 Market Driver Analysis (Current & Future Impact)
- Fig. 8 Market Restraint Analysis (Current & Future Impact)
- Fig. 9 Market Opportunity Analysis (Current & Future Impact)
- Fig. 10 Market Challenge Analysis (Current & Future Impact)
- Fig. 11 SWOT Analysis, By Factor (Political & Legal, Economic and Technological)
- Fig. 12 Porter's Five Forces Analysis
- Fig. 13 Regional Marketplace: Key Takeaways
- Fig. 14 Global Uterine Manipulation Devices Market, for Total Laparoscopy Hysterectomy (TLH), 2018 - 2030 (USD Million)
- Fig. 15 Global Uterine Manipulation Devices Market, for Laparoscopic Supracervical Hysterectomy (LSH), 2018 - 2030 (USD Million)
- Fig. 16 Global Uterine Manipulation Devices Market, for Laparoscopically Assisted Vaginal Hysterectomy (LAVH), 2018 - 2030 (USD Million)
- Fig. 17 Global Uterine Manipulation Devices Market, for Sacrocolpopexy, 2018 - 2030 (USD Million)
- Fig. 18 Global Uterine Manipulation Devices Market, for Others, 2018 - 2030 (USD Million)
- Fig. 19 Global Uterine Manipulation Devices Market, for Hospitals, 2018 - 2030 (USD Million)
- Fig. 20 Global Uterine Manipulation Devices Market, for Clinics, 2018 - 2030 (USD Million)
- Fig. 21 Global Uterine Manipulation Devices Market, for Ambulatory Surgery Centers (ASCs), 2018 - 2030 (USD Million)
- Fig. 22 Regional Outlook, 2023 & 2030
- Fig. 23 North America Uterine Manipulation Devices Market, 2018 - 2030 (USD Million)
- Fig. 24 U.S. Uterine Manipulation Devices Market, 2018 - 2030 (USD Million)
- Fig. 25 Canada Uterine Manipulation Devices Market, 2018 - 2030 (USD Million)
- Fig. 26 Mexico Uterine Manipulation Devices Market, 2018 - 2030 (USD Million)
- Fig. 27 Europe Uterine Manipulation Devices Market, 2018 - 2030 (USD Million)
- Fig. 28 Germany Uterine Manipulation Devices Market, 2018 - 2030 (USD Million)
- Fig. 29 UK Uterine Manipulation Devices Market, 2018 - 2030 (USD Million)
- Fig. 30 France Uterine Manipulation Devices Market, 2018 - 2030 (USD Million)
- Fig. 31 Italy Uterine Manipulation Devices Market, 2018 - 2030 (USD Million)
- Fig. 32 Spain Uterine Manipulation Devices Market, 2018 - 2030 (USD Million)
- Fig. 33 Denmark Uterine Manipulation Devices Market, 2018 - 2030 (USD Million)
- Fig. 34 Sweden Uterine Manipulation Devices Market, 2018 - 2030 (USD Million)
- Fig. 35 Norway Uterine Manipulation Devices Market, 2018 - 2030 (USD Million)
- Fig. 36 Asia Pacific Uterine Manipulation Devices Market, 2018 - 2030 (USD Million)
- Fig. 37 Japan Uterine Manipulation Devices Market, 2018 - 2030 (USD Million)
- Fig. 38 China Uterine Manipulation Devices Market, 2018 - 2030 (USD Million)
- Fig. 39 India Uterine Manipulation Devices Market, 2018 - 2030 (USD Million)
- Fig. 40 Australia Uterine Manipulation Devices Market, 2018 - 2030 (USD Million)
- Fig. 41 South Korea Uterine Manipulation Devices Market, 2018 - 2030 (USD Million)
- Fig. 42 Thailand Uterine Manipulation Devices Market, 2018 - 2030 (USD Million)
- Fig. 43 Latin America Uterine Manipulation Devices Market, 2018 - 2030 (USD Million)
- Fig. 44 Brazil Uterine Manipulation Devices Market, 2018 - 2030 (USD Million)
- Fig. 45 Argentina Uterine Manipulation Devices Market, 2018 - 2030 (USD Million)
- Fig. 46 Middle East and Africa Uterine Manipulation Devices Market, 2018 - 2030 (USD Million)
- Fig. 47 South Africa Uterine Manipulation Devices Market, 2018 - 2030 (USD Million)
- Fig. 48 Saudi Arabia Uterine Manipulation Devices Market, 2018 - 2030 (USD Million)
- Fig. 49 UAE Uterine Manipulation Devices Market, 2018 - 2030 (USD Million)
- Fig. 50 Kuwait Uterine Manipulation Devices Market, 2018 - 2030 (USD Million)
Uterine Manipulation Devices Market Growth & Trends:
The global uterine manipulation devices market size is expected to reach USD 421.79 million by 2030, registering a CAGR of 5.93% from 2024 to 2030, according to a new report by Grand View Research, Inc. A surge in the prevalence of gynecological diseases, coupled with the rising preference for minimally invasive surgical procedures, is a key driving factor for the market.
The increasing prevalence of various gynecological disorders and the growing adoption of uterine manipulation devices owing to their ease of use and convenience are among factors expected to boost the market growth during the forecast period. The prevalence of UF tumors increases as women grow older and it is prevalent in over 30% of women aged between 40 and 60. UF usually develops in women in their late 40s and early 50s, though in some women it may occur at a younger age. Thus, the increasing number of women suffering from UF has led to a rise in the number of hysterectomy procedures, leading to significant demand for uterine manipulation devices.
Moreover, several key players are investing in R&D for the launch of innovative minimally and noninvasive surgical instruments. Currently, various advanced manipulators are available in the market. For instance, during colpotomy procedure, usually manipulators with a cup to fit over the cervix are preferred. These include RUMI in combination with KOH cups (by CooperSurgical, Inc.) and VCare (by CONMED Corporation). Therefore, various advantages offered by these devices are cumulatively responsible for boosting the demand for minimally invasive procedures, thereby propelling the market growth.
Uterine Manipulation Devices Market Report Highlights:
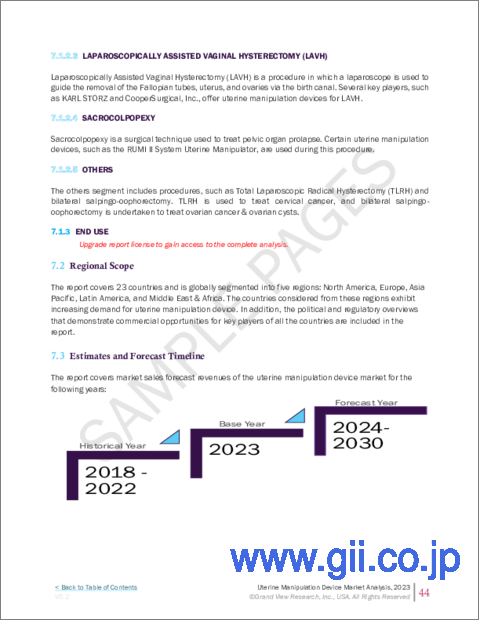
- In terms of application, the total laparoscopic hysterectomy (TLH) dominated the market with a revenue share of 38.33% in 2023. The growing preference for minimally invasive procedures is the major factor propelling the segment growth
- In terms of end-use, the hospital segment dominated the market with a revenue share of 59.37% in 2023. The segment growth is majorly attributed to the increase in the number of patients suffering from various gynecological conditions
- The Latin America market is expected to witness the fastest growth over the forecast period due to the rising prevalence of gynecological disorders and increasing initiatives to provide awareness of endometriosis across the countries like Brazil and Argentina
Table of Contents
Chapter 1. Methodology and Scope
- 1.1. Market Segmentation and Scope
- 1.2. Research Methodology
- 1.3. Information Procurement
- 1.4. Information or Data Analysis
- 1.5. Market Formulation & Validation
- 1.6. Model Details
- 1.7. List of Data Sources
Chapter 2. Executive Summary
- 2.1. Market Outlook
- 2.2. Segment Outlook
- 2.3. Competitive Insights
Chapter 3. Uterine Manipulation Devices Market Variables, Trends, & Scope
- 3.1. Market Lineage Outlook
- 3.1.1. Ancillary Market Outlook
- 3.2. Market Dynamics
- 3.2.1. Market Driver Analysis
- 3.2.1.1. Increasing prevalence of gynecological disorders
- 3.2.1.2. Rising adoption of minimally invasive procedures
- 3.2.1.3. Growing adoption of technologically advanced devices for hysteroscopy procedures
- 3.2.2. Market Restraint Analysis
- 3.2.2.1. Rise in gynecologic surgical costs
- 3.2.2.2. Concerns associated with product approval and commercialization
- 3.2.2.3. Risk of complications associated with uterine manipulation devices
- 3.2.1. Market Driver Analysis
- 3.3. Uterine Manipulation Devices Market Analysis Tools
- 3.3.1. Industry Analysis - Porter's
- 3.3.1.1. Bargaining power of suppliers
- 3.3.1.2. Bargaining power of buyers
- 3.3.1.3. Threat of substitutes
- 3.3.1.4. Threat of new entrants
- 3.3.1.5. Competitive rivalry
- 3.3.2. PESTEL Analysis
- 3.3.2.1. Political & Legal Landscape
- 3.3.2.2. Economic and Social Landscape
- 3.3.2.3. Technological landscape
- 3.3.1. Industry Analysis - Porter's
Chapter 4. Uterine Manipulation Devices Market: Application Estimates & Trend Analysis
- 4.1. Segment Dashboard
- 4.2. Global Uterine Manipulation Devices Market Movement Analysis
- 4.3. Global Uterine Manipulation Devices Market Size & Trend Analysis, by Application, 2018 to 2030 (USD Million)
- 4.4. Total Laparoscopy Hysterectomy (TLH)
- 4.4.1. Total Laparoscopy Hysterectomy (TLH) Market Revenue Estimates and Forecasts, 2018 - 2030 (USD Million)
- 4.5. Laparoscopic Supracervical Hysterectomy (LSH)
- 4.5.1. Laparoscopic Supracervical Hysterectomy (LSH) Market Revenue Estimates and Forecasts, 2018 - 2030 (USD Million)
- 4.6. Laparoscopically Assisted Vaginal Hysterectomy (LAVH)
- 4.6.1. Laparoscopically Assisted Vaginal Hysterectomy (LAVH) Market Revenue Estimates and Forecasts, 2018 - 2030 (USD Million)
- 4.7. Sacrocolpopexy
- 4.7.1. Sacrocolpopexy Market Revenue Estimates and Forecasts, 2018 - 2030 (USD Million)
- 4.8. Others
- 4.8.1. Others Market Revenue Estimates and Forecasts, 2018 - 2030 (USD Million)
Chapter 5. Uterine Manipulation Devices Market: End Use Estimates & Trend Analysis
- 5.1. Segment Dashboard
- 5.2. Global Uterine Manipulation Devices Market Movement Analysis
- 5.3. Global Uterine Manipulation Devices Market Size & Trend Analysis, by End Use, 2018 to 2030 (USD Million)
- 5.4. Hospitals
- 5.4.1. Hospitals Market Revenue Estimates and Forecasts, 2018 - 2030 (USD Million)
- 5.5. Clinics
- 5.5.1. Clinics Market Revenue Estimates and Forecasts, 2018 - 2030 (USD Million)
- 5.6. Ambulatory Surgery Centers (ASCs)
- 5.6.1. Ambulatory Surgery Centers (ASCs) Market Revenue Estimates and Forecasts, 2018 - 2030 (USD Million)
Chapter 6. Uterine Manipulation Devices Market: Regional Estimates & Trend Analysis By Application, By End Use
- 6.1. Regional Dashboard
- 6.2. Market Size & Forecasts and Trend Analysis, 2018 to 2030
- 6.3. North America
- 6.3.1. North America Uterine Manipulation Devices Market Estimates and Forecasts, 2018 - 2030 (USD Million)
- 6.3.2. U.S.
- 6.3.2.1. Key Country Dynamics
- 6.3.2.2. Competitive Scenario
- 6.3.2.3. Regulatory Scenario
- 6.3.2.4. Reimbursement Scenario
- 6.3.2.5. U.S. Uterine Manipulation Devices Market Estimates and Forecasts, 2018 - 2030 (USD Million)
- 6.3.3. Canada
- 6.3.3.1. Key Country Dynamics
- 6.3.3.2. Competitive Scenario
- 6.3.3.3. Regulatory Scenario
- 6.3.3.4. Reimbursement Scenario
- 6.3.3.5. Canada Uterine Manipulation Devices Market Estimates and Forecasts, 2018 - 2030 (USD Million)
- 6.3.4. Mexico
- 6.3.4.1. Key Country Dynamics
- 6.3.4.2. Competitive Scenario
- 6.3.4.3. Regulatory Scenario
- 6.3.4.4. Reimbursement Scenario
- 6.3.4.5. Mexico Uterine Manipulation Devices Market Estimates and Forecasts, 2018 - 2030 (USD Million)
- 6.4. Europe
- 6.4.1. Europe Uterine Manipulation Devices Market Estimates and Forecasts, 2018 - 2030 (USD Million)
- 6.4.2. UK
- 6.4.2.1. Key Country Dynamics
- 6.4.2.2. Competitive Scenario
- 6.4.2.3. Regulatory Scenario
- 6.4.2.4. Reimbursement Scenario
- 6.4.2.5. UK Uterine Manipulation Devices Market Estimates and Forecasts, 2018 - 2030 (USD Million)
- 6.4.3. Germany
- 6.4.3.1. Key Country Dynamics
- 6.4.3.2. Competitive Scenario
- 6.4.3.3. Regulatory Scenario
- 6.4.3.4. Reimbursement Scenario
- 6.4.3.5. Germany Uterine Manipulation Devices Market Estimates and Forecasts, 2018 - 2030 (USD Million)
- 6.4.4. France
- 6.4.4.1. Key Country Dynamics
- 6.4.4.2. Competitive Scenario
- 6.4.4.3. Regulatory Scenario
- 6.4.4.4. Reimbursement Scenario
- 6.4.4.5. France Uterine Manipulation Devices Market Estimates and Forecasts, 2018 - 2030 (USD Million)
- 6.4.5. Italy
- 6.4.5.1. Key Country Dynamics
- 6.4.5.2. Competitive Scenario
- 6.4.5.3. Regulatory Scenario
- 6.4.5.4. Reimbursement Scenario
- 6.4.5.5. Italy Uterine Manipulation Devices Market Estimates and Forecasts, 2018 - 2030 (USD Million)
- 6.4.6. Spain
- 6.4.6.1. Key Country Dynamics
- 6.4.6.2. Competitive Scenario
- 6.4.6.3. Regulatory Scenario
- 6.4.6.4. Reimbursement Scenario
- 6.4.6.5. Spain Uterine Manipulation Devices Market Estimates and Forecasts, 2018 - 2030 (USD Million)
- 6.4.7. Denmark
- 6.4.7.1. Key Country Dynamics
- 6.4.7.2. Competitive Scenario
- 6.4.7.3. Regulatory Scenario
- 6.4.7.4. Reimbursement Scenario
- 6.4.7.5. Denmark Uterine Manipulation Devices Market Estimates and Forecasts, 2018 - 2030 (USD Million)
- 6.4.8. Sweden
- 6.4.8.1. Key Country Dynamics
- 6.4.8.2. Competitive Scenario
- 6.4.8.3. Regulatory Scenario
- 6.4.8.4. Reimbursement Scenario
- 6.4.8.5. Sweden Uterine Manipulation Devices Market Estimates and Forecasts, 2018 - 2030 (USD Million)
- 6.4.9. Norway
- 6.4.9.1. Key Country Dynamics
- 6.4.9.2. Competitive Scenario
- 6.4.9.3. Regulatory Scenario
- 6.4.9.4. Reimbursement Scenario
- 6.4.9.5. Norway Uterine Manipulation Devices Market Estimates and Forecasts, 2018 - 2030 (USD Million)
- 6.5. Asia Pacific
- 6.5.1. Asia Pacific Uterine Manipulation Devices Market Estimates and Forecasts, 2018 - 2030 (USD Million)
- 6.5.2. Japan
- 6.5.2.1. Key Country Dynamics
- 6.5.2.2. Competitive Scenario
- 6.5.2.3. Regulatory Scenario
- 6.5.2.4. Reimbursement Scenario
- 6.5.2.5. Japan Uterine Manipulation Devices Market Estimates and Forecasts, 2018 - 2030 (USD Million)
- 6.5.3. China
- 6.5.3.1. Key Country Dynamics
- 6.5.3.2. Competitive Scenario
- 6.5.3.3. Regulatory Scenario
- 6.5.3.4. Reimbursement Scenario
- 6.5.3.5. China Uterine Manipulation Devices Market Estimates and Forecasts, 2018 - 2030 (USD Million)
- 6.5.4. India
- 6.5.4.1. Key Country Dynamics
- 6.5.4.2. Competitive Scenario
- 6.5.4.3. Regulatory Scenario
- 6.5.4.4. Reimbursement Scenario
- 6.5.4.5. India Uterine Manipulation Devices Market Estimates and Forecasts, 2018 - 2030 (USD Million)
- 6.5.5. South Korea
- 6.5.5.1. Key Country Dynamics
- 6.5.5.2. Competitive Scenario
- 6.5.5.3. Regulatory Scenario
- 6.5.5.4. Reimbursement Scenario
- 6.5.5.5. South Korea Uterine Manipulation Devices Market Estimates and Forecasts, 2018 - 2030 (USD Million)
- 6.5.6. Australia
- 6.5.6.1. Key Country Dynamics
- 6.5.6.2. Competitive Scenario
- 6.5.6.3. Regulatory Scenario
- 6.5.6.4. Reimbursement Scenario
- 6.5.6.5. Australia Uterine Manipulation Devices Market Estimates and Forecasts, 2018 - 2030 (USD Million)
- 6.5.7. Thailand
- 6.5.7.1. Key Country Dynamics
- 6.5.7.2. Competitive Scenario
- 6.5.7.3. Regulatory Scenario
- 6.5.7.4. Reimbursement Scenario
- 6.5.7.5. Thailand Uterine Manipulation Devices Market Estimates and Forecasts, 2018 - 2030 (USD Million)
- 6.6. Latin America
- 6.6.1. Latin America Uterine Manipulation Devices Market Estimates and Forecasts, 2018 - 2030 (USD Million)
- 6.6.2. Brazil
- 6.6.2.1. Key Country Dynamics
- 6.6.2.2. Competitive Scenario
- 6.6.2.3. Regulatory Scenario
- 6.6.2.4. Reimbursement Scenario
- 6.6.2.5. Brazil Uterine Manipulation Devices Market Estimates and Forecasts, 2018 - 2030 (USD Million)
- 6.6.3. Argentina
- 6.6.3.1. Key Country Dynamics
- 6.6.3.2. Competitive Scenario
- 6.6.3.3. Regulatory Scenario
- 6.6.3.4. Reimbursement Scenario
- 6.6.3.5. Argentina Uterine Manipulation Devices Market Estimates and Forecasts, 2018 - 2030 (USD Million)
- 6.7. Middle East & Africa
- 6.7.1. Middle East & Africa Uterine Manipulation Devices Market Estimates and Forecasts, 2018 - 2030 (USD Million)
- 6.7.2. South Africa
- 6.7.2.1. Key Country Dynamics
- 6.7.2.2. Competitive Scenario
- 6.7.2.3. Regulatory Scenario
- 6.7.2.4. Reimbursement Scenario
- 6.7.2.5. South Africa Uterine Manipulation Devices Market Estimates and Forecasts, 2018 - 2030 (USD Million)
- 6.7.3. Saudi Arabia
- 6.7.3.1. Key Country Dynamics
- 6.7.3.2. Competitive Scenario
- 6.7.3.3. Regulatory Scenario
- 6.7.3.4. Reimbursement Scenario
- 6.7.3.5. Saudi Arabia Uterine Manipulation Devices Market Estimates and Forecasts, 2018 - 2030 (USD Million)
- 6.7.4. UAE
- 6.7.4.1. Key Country Dynamics
- 6.7.4.3. Regulatory Scenario
- 6.7.4.4. Reimbursement Scenario
- 6.7.4.5. UAE Uterine Manipulation Devices Market Estimates and Forecasts, 2018 - 2030 (USD Million)
- 6.7.5. Kuwait
- 6.7.5.1. Key Country Dynamics
- 6.7.5.2. Competitive Scenario
- 6.7.5.3. Regulatory Scenario
- 6.7.5.4. Reimbursement Scenario
- 6.7.5.5. Kuwait Uterine Manipulation Devices Market Estimates and Forecasts, 2018 - 2030 (USD Million)
Chapter 7. Competitive Landscape
- 7.1. Market Participant Categorization
- 7.2. Key Company Profiles
- 7.2.1. Conkin Surgical Instrument Ltd.
- 7.2.1.1. Company Overview
- 7.2.1.2. Financial Performance
- 7.2.1.3. Service Benchmarking
- 7.2.1.4. Strategic Initiatives
- 7.2.2. CooperSurgical Inc.
- 7.2.2.1. Company Overview
- 7.2.2.2. Financial Performance
- 7.2.2.3. Service Benchmarking
- 7.2.2.4. Strategic Initiatives
- 7.2.3. B. Braun SE
- 7.2.3.1. Company Overview
- 7.2.3.2. Financial Performance
- 7.2.3.3. Product Benchmarking
- 7.2.3.4. Strategic Initiatives
- 7.2.4. KARL STORZ SE & Co. KG
- 7.2.4.1. Company Overview
- 7.2.4.2. Financial Performance
- 7.2.4.3. Product Benchmarking
- 7.2.4.4. Strategic Initiatives
- 7.2.5. CONMED Corporation
- 7.2.5.1. Company Overview
- 7.2.5.2. Financial Performance
- 7.2.5.3. Product Benchmarking
- 7.2.5.4. Strategic Initiatives
- 7.2.6. Richard Wolf GmbH
- 7.2.6.1. Company Overview
- 7.2.6.2. Financial Performance
- 7.2.6.3. Product Benchmarking
- 7.2.6.4. Strategic Initiatives
- 7.2.7. Utah Medical Products, Inc
- 7.2.7.1. Company Overview
- 7.2.7.2. Financial Performance
- 7.2.7.3. Product Benchmarking
- 7.2.7.4. Strategic Initiatives
- 7.2.8. Purple Surgical
- 7.2.8.1. Company Overview
- 7.2.8.2. Financial Performance
- 7.2.8.3. Product Benchmarking
- 7.2.8.4. Strategic Initiatives
- 7.2.9. Laborie
- 7.2.9.1. Company Overview
- 7.2.9.2. Financial Performance
- 7.2.9.3. Product Benchmarking
- 7.2.9.4. Strategic Initiatives
- 7.2.10. LSI Solutions, Inc.
- 7.2.10.1. Company Overview
- 7.2.10.2. Financial Performance
- 7.2.10.3. Product Benchmarking
- 7.2.10.4. Strategic Initiatives
- 7.2.1. Conkin Surgical Instrument Ltd.
- 7.3. Heat Map Analysis/ Company Market Position Analysis
- 7.4. Estimated Company Market Share Analysis, 2023
- 7.5. List of Other Key Market Players

