|
|
市場調査レポート
商品コード
1321486
環境試験室の市場規模、シェア、動向分析レポート:製品別、ビジネスモデル別、用途別、最終用途別、地域別、セグメント別予測、2023年~2030年Environmental Test Chamber Market Size, Share & Trends Analysis Report By Product, By Business Model, By Application, By End-use, By Region, And Segment Forecasts, 2023 - 2030 |
||||||
|
|
|||||||
カスタマイズ可能
|
|||||||


| 環境試験室の市場規模、シェア、動向分析レポート:製品別、ビジネスモデル別、用途別、最終用途別、地域別、セグメント別予測、2023年~2030年 |
|
出版日: 2023年07月18日
発行: Grand View Research
ページ情報: 英文 150 Pages
納期: 2~10営業日
|

- 全表示
- 概要
- 図表
- 目次
環境試験室市場の成長と動向
Grand View Research, Inc.の最新レポートによると、環境試験室の世界市場規模は2023年から2030年にかけてCAGR 3.0%で成長し、2030年には11億9,790万米ドルに達すると予測されています。
環境試験室市場の成長は、環境および信頼性規格の評価に環境試験室の利用が増加していることが要因であると予測されています。環境試験室は、設計や応用プロセスにおいて、それ自体だけでなく、温度や湿度、機械的環境などの外部気候の影響を絶えず受けます。しかし、それでも正常に機能しなければならないため、検証のために試験装置を使用する必要があります。
環境チャンバーは、環境と信頼性の基準を評価するために使用されます。指定された条件下で、指定された時間内に特定の機能を実行する製品の能力を環境依存性と呼ぶ。製品は、設計やアプリケーションの過程で、それ自身や外部の気候や機械的環境の影響を絶えず受けます。しかし、それでも正常に機能しなければならないため、試験装置を用いて検証する必要があります。環境試験と信頼性試験の検証は、研究開発試験、試作試験、温湿度試験、量産サンプル検査に分けられます。
例えば、自動車業界では、小型の部品を大型のアセンブリに組み込む前に、小型の環境試験機を用いて試験を行うなど、さまざまな形で試験機を活用しています。さらに、アッセンブリやメカニズムなどの大型の部品は、より多くの部品を試験できる、より巨大な環境試験室で試験されます。最終段階として、さまざまな部品の相互作用を調べるために、生産された自動車全体が試験されます。自動車産業用の環境試験室は、自動車の品質と寿命を向上させてきました。
自動車生産の増加は、環境試験室市場にプラスの影響を与えると思われます。例えば、2022年、OICA(国際自動車工業会)によると、世界の自動車生産台数は2021年比で6%増加し、8,500万台に達しました。
環境試験室市場レポートハイライト
- ウォークインチャンバーセグメントは2022年に市場シェアの20.1%を占めました。ウォークイン試験室は、すぐに設置できる装置として購入することも、特定のニーズに合わせてカスタマイズすることもできる、より高度な試験室を提供します。これらは、連結パネルまたは溶接パネルのいずれかを使用して組み立てることができます。いくつかのタイプのウォークイン試験室は、一種類の試験または一連の試験用に設計することができます。
- 環境試験室の標準は、新規設計品、小ロット生産、大量生産のサンプル検査にとって重要な基準値です。環境試験室を使って規格を評価し、試作中の製品の信頼性を検証し、量産中の抜き取り検査を行うことで、企業は製品の品質を向上させながら研究開発費を削減することができます。これらの要因により、予測期間中の市場需要はさらに高まると予想されます。
- 北米は、米国の産業部門との結びつきが強いため、予測期間中のCAGRは2.3%になると予想されます。さらに、自動車産業は毎年約180億米ドルを研究開発に費やしています。このように、北米における自動車産業の成長は、予測期間中の市場成長を促進すると期待されています。
- 2022年3月、Memmert GmbH &Co.KGは全く新しいm360レーンオートメーションデバイスを発表しました。m360は、信頼性が高くプレミアムな先進ペルチェ技術を提供しています。
目次
第1章 調査手法と範囲
- 調査手法
- 調査範囲と前提条件
- 情報調達
- 情報分析
- 市場の形成とデータの視覚化
- データの検証と公開
第2章 エグゼクティブサマリー
第3章 環境試験室の市場変数、動向および範囲
- 市場セグメンテーションと範囲
- 普及と成長の見通しのマッピング
- 業界のバリューチェーン分析
- 技術概要
- 規制の枠組み
- 市場力学
- 市場促進要因の分析
- 市場抑制要因の分析
- 市場課題の分析
- 市場機会の分析
- ビジネス環境分析:環境試験室市場
- 業界分析- ポーター
- PESTEL分析
- 経済メガトレンド
- 流通経路
- ベンダーマトリックス
- 主要コンポーネントプロバイダーのリスト
- 主要メーカー一覧
- 主要販売代理店のリスト
第4章 環境試験室市場:製品の推定・動向分析
- 製品の変動分析と市場シェア、2022年と2030年
- 恒温恒湿器
- 熱衝撃試験室
- ウォークインチャンバー
- カスタマイズされたチャンバー
- 振動チャンバー
- その他
第5章 環境試験室市場:用途の推定・動向分析
- 用途の変動分析と市場シェア、2022年と2030年
- 研究開発(R&D)
- 製造・検査
第6章 環境試験室市場:最終用途の推定・動向分析
- 最終用途の変動分析と市場シェア、2022年と2030年
- 航空宇宙と防衛
- 自動車
- 通信およびエレクトロニクス
- 医療および製薬
- その他
第7章 環境試験室市場:ビジネスモデルの推定・動向分析
- ビジネスモデルの変動分析と市場シェア、2022年と2030年
- 製品
- サービス
第8章 環境試験室市場:地域の推定・動向分析
- 地域別の変動分析と市場シェア、2022年と2030年
- 北米
- 市場推計・予測、2018~2030年
- 米国
- カナダ
- メキシコ
- 欧州
- 市場推計・予測、2018~2030年
- 製品別、2018~2030年
- 用途別、2018年~2030年
- 最終用途別、2018~2030年
- ビジネスモデル別、2018~2030年
- ドイツ
- フランス
- 英国
- イタリア
- スペイン
- アジア太平洋地域
- 市場推計・予測、2018~2030年
- 製品別、2018~2030年
- 用途別、2018年~2030年
- 最終用途別、2018~2030年
- ビジネスモデル別、2018~2030年
- 中国
- インド
- 日本
- 韓国
- オーストラリア
- 中南米
- 市場推計・予測、2018~2030年
- 製品別、2018~2030年
- 用途別、2018年~2030年
- 最終用途別、2018~2030年
- ビジネスモデル別、2018~2030年
- ブラジル
- アルゼンチン
- 中東とアフリカ
- 市場推計・予測、2018~2030年
- 製品別、2018~2030年
- 用途別、2018年~2030年
- 最終用途別、2018~2030年
- ビジネスモデル別、2018~2030年
- アラブ首長国連邦
- サウジアラビア
- 南アフリカ
第9章 環境試験室市場:競合分析
- 主要市場参入企業による最近の動向と影響分析
- 企業の分類
- 参入企業の概要
- 財務概要
- 製品のベンチマーク
- 企業の市場での位置づけ
- 企業の市場シェア分析
- 企業ヒートマップ分析
- 戦略マッピング
第10章 企業プロファイル
- KOMEG Technology Ind Co., Ltd
- ACMAS Technologies Pvt. Ltd.
- Weiss Technik North America, Inc.
- Russells Technical Products
- Thermotron Industries
- TA Instruments
- Memmert GmbH+Co. KG,
- BINDER GmbH
- Envisys Technologies
- ESPEC CORP
- Angelantoni Test Technologies
- Climatic Testing Systems, Inc.(CTS)
- Hastest Solutions Inc.
- CM Envirosystems
List of Tables
- Table 1 Environmental test chamber market estimates and forecasts, by product, 2018 - 2030 (USD Million)
- Table 2 Environmental test chamber market estimates and forecasts, by application, 2018 - 2030 (USD Million)
- Table 3 Environmental test chamber market estimates and forecasts, by end-use, 2018 - 2030 (USD Million)
- Table 4 Environmental test chamber market estimates and forecasts, by business model, 2018 - 2030 (USD Million)
- Table 5 US Macroeconomic Outlook
- Table 6 Canada Macroeconomic Outlook
- Table 7 Mexico Macroeconomic Outlook
- Table 8 France Macroeconomic Outlook
- Table 9 Germany Macroeconomic Outlook
- Table 10 Italy Macroeconomic Outlook
- Table 11 UK Macroeconomic Outlook
- Table 12 Spain Macroeconomic Outlook
- Table 13 China Macroeconomic Outlook
- Table 14 India Macroeconomic Outlook
- Table 15 Japan Macroeconomic Outlook
- Table 16 Australia Macroeconomic Outlook
- Table 17 South Korea Macroeconomic Outlook
- Table 18 Brazil Macroeconomic Outlook
- Table 19 Argentina Macroeconomic Outlook
- Table 20 UAE Macroeconomic Outlook
- Table 21 Saudi Arabia Macroeconomic Outlook
- Table 22 South Africa Macroeconomic Outlook
- Table 23 Recent Developments & Impact Analysis, By Key Market Participants
- Table 24 Company Market Share, 2022
- Table 25 Company Heat Map Analysis, 2022
List of Figures
- Fig. 1 Market Segmentation & Scope
- Fig. 2 Information Procurement
- Fig. 3 Data Analysis Models
- Fig. 4 Market Formulation And Validation
- Fig. 5 Data Validating & Publishing
- Fig. 6 Market Snapshot
- Fig. 7 Segment Snapshot
- Fig. 8 Competitive Landscape Snapshot
- Fig. 9 Penetration and Growth Prospect Mapping
- Fig. 10 Value Chain Analysis
- Fig. 11 Market Dynamics
- Fig. 12 Environmental Test Chamber Market PORTER's Analysis
- Fig. 13 Environmental Test Chamber Market PESTEL Analysis
- Fig. 14 Environmental Test Chamber Market, By Product: Key Takeaways
- Fig. 15 Environmental Test Chamber Market: Product Movement Analysis & Market Share, 2022 & 2030
- Fig. 16 Temperature & Humidity Chamber market estimates & forecasts, 2018 - 2030 (USD Million)
- Fig. 17 Thermal Shock Test Chamber market estimates & forecasts, 2018 - 2030 (USD Million)
- Fig. 18 Walk-in Chamber market estimates & forecasts, 2018 - 2030 (USD Million)
- Fig. 19 Customized Chamber market estimates & forecasts, 2018 - 2030 (USD Million)
- Fig. 20 Vibration Chambers market estimates & forecasts, 2018 - 2030 (USD Million)
- Fig. 21 Others market estimates & forecasts, 2018 - 2030 (USD Million)
- Fig. 22 Environmental Test Chamber Market, By Application: Key Takeaways
- Fig. 23 Environmental Test Chamber Market: Application Movement Analysis & Market Share, 2022 & 2030
- Fig. 24 Research and Development (R&D) market estimates & forecasts, 2018 - 2030 (USD Million)
- Fig. 25 Production & Inspection market estimates & forecasts, 2018 - 2030 (USD Million)
- Fig. 26 Environmental Test Chamber Market, By End-use: Key Takeaways
- Fig. 27 Environmental Test Chamber Market: End-use Movement Analysis & Market Share, 2022 & 2030
- Fig. 28 Aerospace & Defense market estimates & forecasts, 2018 - 2030 (USD Million)
- Fig. 29 Automotive market estimates & forecasts, 2018 - 2030 (USD Million)
- Fig. 30 Telecommunications & Electronics market estimates & forecasts, 2018 - 2030 (USD Million)
- Fig. 31 Medical & Pharmaceutical market estimates & forecasts, 2018 - 2030 (USD Million)
- Fig. 32 Others market estimates & forecasts, 2018 - 2030 (USD Million)
- Fig. 33 Environmental Test Chamber Market, By Business Model: Key Takeaways
- Fig. 34 Environmental Test Chamber Market: Business Model Movement Analysis & Market Share, 2022 & 2030
- Fig. 35 Product market estimates & forecasts, 2018 - 2030 (USD Million)
- Fig. 36 Service market estimates & forecasts, 2018 - 2030 (USD Million)
Environmental Test Chamber Market Growth & Trends
The global environmental test chamber market size is anticipated to reach USD 1,197.9 million by 2030, growing at a CAGR of 3.0% from 2023 to 2030, according to a new report by Grand View Research, Inc. The growth of the market for environmental test chambers is anticipated to be driven by the increasing utilization of environmental chambers for assessing environmental and reliability standards. The environmental test chamber is continually influenced by its own as well as external climate such as temperature & humidity and mechanical environment during the design and application process. However, it must still function normally, which necessitates the use of testing equipment for verification.
Environmental chambers are used to assess environmental and reliability standards. The capacity of a product to execute a specific function in a specified time under specified conditions is called environmental dependability. The product is continually influenced by its own and external climate and mechanical environment during the design and application process. However, it must still function normally, which necessitates the use of test equipment to verify. The verification of environment and reliability tests is separated as follows: research and development testing, trial production testing, temperature & humidity testing, and mass production sample inspection.
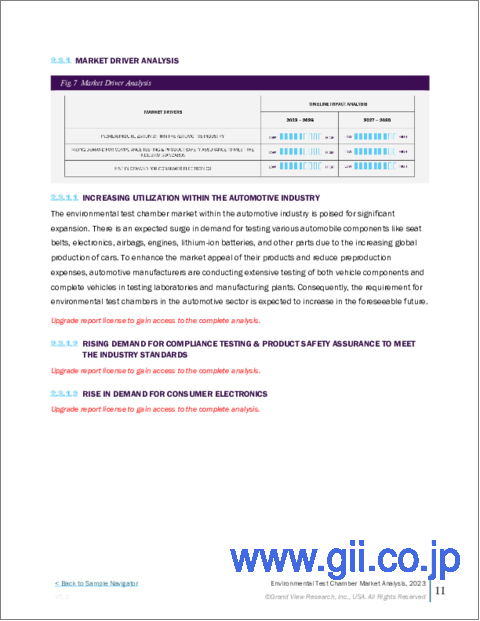
In numerous ways, the automotive industry relies on test chambers for instance; small environmental chambers are used to test small parts before inserting them into larger assemblies. Moreover, oversized items, such as assemblies and mechanisms, are tested in the more enormous environmental test chamber where more components can be tested. The entirely produced automobile is tested as a final stage to determine the interaction of various components. Environmental test chambers for the automotive industry have improved vehicle quality and lifespan.
The increasing automotive production will positively impact the market for environmental chamber testing. For instance, in 2022, according to OICA (International Organization of Motor Vehicle Manufacturers), global automotive production has increased by 6% and reached 85.0 million units compared to 2021.
Environmental Test Chamber Market Report Highlights
- The walk-in chamber segment held 20.1% of the market share in 2022. Walk-in test chambers offer a more advanced testing chamber that can be purchased as a ready-to-install device or customized to meet specific needs. These can be assembled using either linked or welded panels. Several types of walk-in chambers can be designed for a single sort of testing or a series of tests
- Environmental test chamber standards are critical reference values for new design items, small batch production, and mass production sample inspection. Using environmental chambers to evaluate standards and verify product reliability during trial production and random inspection during mass production can assist firms in reducing R&D expenses while improving product quality. These aforementioned factors are anticipated to propel further the market demand over the projected period
- North America is expected to exhibit a CAGR of 2.3% over the forecast period owing to strong linkages to the U.S. industrial sector. Furthermore, the car industry spends approximately USD18 billion each year on research & product development. Thus, the growing automotive industry in North America is expected to drive market growth over the forecast period
- In March 2022, Memmert GmbH & Co.KG has launched the all-new m360 lan automation device. The m360 offers reliable and premium advanced Peltier technology
Table of Contents
Chapter 1. Methodology and Scope
- 1.1. Research Methodology
- 1.2. Research Scope & Assumption
- 1.3. Information Procurement
- 1.3.1. Purchased Database
- 1.3.2. GVR's Internal Database
- 1.3.3. Secondary Sources & Third-Party Perspectives
- 1.3.4. Primary Research
- 1.4. Information Analysis
- 1.4.1. Data Analysis Models
- 1.5. Market Formulation & Data Visualization
- 1.6. Data Validation & Publishing
Chapter 2. Executive Summary
- 2.1. Market Outlook
- 2.2. Segmental Outlook
- 2.3. Competitive Insights
Chapter 3. Environmental Test Chamber Market Variables, Trends & Scope
- 3.1. Market Segmentation & Scope
- 3.2. Penetration and Growth Prospect Mapping
- 3.3. Industry Value Chain Analysis
- 3.4. Technology Overview
- 3.5. Regulatory Framework
- 3.6. Market Dynamics
- 3.6.1. Market Driver Analysis
- 3.6.2. Market Restraint Analysis
- 3.6.3. Market Challenge Analysis
- 3.6.4. Market Opportunity Analysis
- 3.7. Business Environment Analysis: Environmental Test Chamber Market
- 3.7.1. Industry Analysis - Porter's
- 3.7.1.1. Supplier Power
- 3.7.1.2. Buyer power
- 3.7.1.3. Threat of substitutes
- 3.7.1.4. Threat of new entrants
- 3.7.1.5. Competitive rivalry
- 3.7.2. PESTEL Analysis
- 3.7.2.1. Political Landscape
- 3.7.2.2. Economic Landscape
- 3.7.2.3. Social Landscape
- 3.7.2.4. Technological Landscape
- 3.7.2.5. Environmental Landscape
- 3.7.2.6. Legal Landscape
- 3.7.1. Industry Analysis - Porter's
- 3.8. Economic Mega Trend
- 3.9. Distribution Channel
- 3.10. Vendor Matrix
- 3.10.1. List of key component providers
- 3.10.2. List of key manufacturers
- 3.10.3. List of key distributors
Chapter 4. Environmental Test Chamber Market: Type Estimates & Trend Analysis
- 4.1. Product Movement Analysis & Market Share, 2022 & 2030
- 4.1.1. Market estimates and forecasts, 2018 - 2030 (USD Million)
- 4.2. Temperature & Humidity Chamber
- 4.2.1. Market estimates and forecasts, 2018 - 2030 (USD Million)
- 4.3. Thermal Shock Test Chamber
- 4.3.1. Market estimates and forecasts, 2018 - 2030 (USD Million)
- 4.4. Walk-in Chamber
- 4.4.1. Market estimates and forecasts, 2018 - 2030 (USD Million)
- 4.5. Customized Chamber
- 4.5.1. Market estimates and forecasts, 2018 - 2030 (USD Million)
- 4.6. Vibration Chambers
- 4.6.1. Market estimates and forecasts, 2018 - 2030 (USD Million)
- 4.7. Others
- 4.7.1. Market estimates and forecasts, 2018 - 2030 (USD Million)
Chapter 5. Environmental Test Chamber Market: Application Estimates & Trend Analysis
- 5.1. Application Movement Analysis & Market Share, 2022 & 2030
- 5.2. Research and Development (R&D)
- 5.2.1. Market estimates and forecasts, 2018 - 2030 (USD Million)
- 5.3. Production & Inspection
- 5.3.1. Market estimates and forecasts, 2018 - 2030 (USD Million)
Chapter 6. Environmental Test Chamber Market: End-use Estimates & Trend Analysis
- 6.1. End-use Movement Analysis & Market Share, 2022 & 2030
- 6.2. Aerospace & Defense
- 6.2.1. Market estimates and forecasts, 2018 - 2030 (USD Million)
- 6.3. Automotive
- 6.3.1. Market estimates and forecasts, 2018 - 2030 (USD Million)
- 6.4. Telecommunications & Electronics
- 6.4.1. Market estimates and forecasts, 2018 - 2030 (USD Million)
- 6.5. Medical & Pharmaceutical
- 6.5.1. Market estimates and forecasts, 2018 - 2030 (USD Million)
- 6.6. Others
Chapter 7. Environmental Test Chamber Market: Business Model Estimates & Trend Analysis
- 7.1. Business Model Movement Analysis & Market Share, 2022 & 2030
- 7.2. Product
- 7.2.1. Market estimates and forecasts, 2018 - 2030 (USD Million)
- 7.3. Service
- 7.3.1. Market estimates and forecasts, 2018 - 2030 (USD Million)
Chapter 8. Environmental Test Chamber Market: Regional Estimates & Trend Analysis
- 8.1. Regional Movement Analysis & Market Share, 2022 & 2030
- 8.2. North America
- 8.2.1. Market estimates and forecasts, 2018 - 2030 (USD Million)
- 8.2.2. U.S.
- 8.2.2.1. Macroeconomic Outlook
- 8.2.2.2. Market estimates and forecasts, 2018 - 2030 (USD Million)
- 8.2.2.3. Market estimates and forecasts, by product 2018 - 2030 (USD Million)
- 8.2.2.4. Market estimates and forecasts, by application 2018 - 2030 (USD Million)
- 8.2.2.5. Market estimates and forecasts, by end-use 2018 - 2030 (USD Million)
- 8.2.2.6. Market estimates and forecasts, by business model 2018 - 2030 (USD Million)
- 8.2.3. Canada
- 8.2.3.1. Macroeconomic Outlook
- 8.2.3.2. Market estimates and forecasts, 2018 - 2030 (USD Million)
- 8.2.3.3. Market estimates and forecasts, 2018 - 2030 (USD Million)
- 8.2.3.4. Market estimates and forecasts, by product 2018 - 2030 (USD Million)
- 8.2.3.5. Market estimates and forecasts, by application 2018 - 2030 (USD Million)
- 8.2.3.6. Market estimates and forecasts, by end-use 2018 - 2030 (USD Million)
- 8.2.3.7. Market estimates and forecasts, by business model 2018 - 2030 (USD Million)
- 8.2.4. Mexico
- 8.2.4.1. Macroeconomic Outlook
- 8.2.4.2. Market estimates and forecasts, 2018 - 2030 (USD Million)
- 8.2.4.3. Market estimates and forecasts, 2018 - 2030 (USD Million)
- 8.2.4.4. Market estimates and forecasts, by product 2018 - 2030 (USD Million)
- 8.2.4.5. Market estimates and forecasts, by application 2018 - 2030 (USD Million)
- 8.2.4.6. Market estimates and forecasts, by end-use 2018 - 2030 (USD Million)
- 8.2.4.7. Market estimates and forecasts, by business model 2018 - 2030 (USD Million)
- 8.3. Europe
- 8.3.1. Market estimates and forecasts, 2018 - 2030 (USD Million)
- 8.3.2. Market estimates and forecasts, by product 2018 - 2030 (USD Million)
- 8.3.3. Market estimates and forecasts, by application 2018 - 2030 (USD Million)
- 8.3.4. Market estimates and forecasts, by end-use 2018 - 2030 (USD Million)
- 8.3.5. Market estimates and forecasts, by business model 2018 - 2030 (USD Million)
- 8.3.6. Germany
- 8.3.6.1. Macroeconomic Outlook
- 8.3.6.2. Market estimates and forecasts, 2018 - 2030 (USD Million)
- 8.3.6.3. Market estimates and forecasts, by product 2018 - 2030 (USD Million)
- 8.3.6.4. Market estimates and forecasts, by application 2018 - 2030 (USD Million)
- 8.3.6.5. Market estimates and forecasts, by end-use 2018 - 2030 (USD Million)
- 8.3.6.6. Market estimates and forecasts, by business model 2018 - 2030 (USD Million)
- 8.3.7. France
- 8.3.7.1. Macroeconomic Outlook
- 8.3.7.2. Market estimates and forecasts, 2018 - 2030 (USD Million)
- 8.3.7.3. Market estimates and forecasts, by product 2018 - 2030 (USD Million)
- 8.3.7.4. Market estimates and forecasts, by application 2018 - 2030 (USD Million)
- 8.3.7.5. Market estimates and forecasts, by end-use 2018 - 2030 (USD Million)
- 8.3.7.6. Market estimates and forecasts, by business model 2018 - 2030 (USD Million)
- 8.3.8. UK
- 8.3.8.1. Macroeconomic Outlook
- 8.3.8.2. Market estimates and forecasts, 2018 - 2030 (USD Million)
- 8.3.8.3. Market estimates and forecasts, by product 2018 - 2030 (USD Million)
- 8.3.8.4. Market estimates and forecasts, by application 2018 - 2030 (USD Million)
- 8.3.8.5. Market estimates and forecasts, by end-use 2018 - 2030 (USD Million)
- 8.3.8.6. Market estimates and forecasts, by business model 2018 - 2030 (USD Million)
- 8.3.9. Italy
- 8.3.9.1. Macroeconomic Outlook
- 8.3.9.2. Market estimates and forecasts, 2018 - 2030 (USD Million)
- 8.3.9.3. Market estimates and forecasts, by product 2018 - 2030 (USD Million)
- 8.3.9.4. Market estimates and forecasts, by application 2018 - 2030 (USD Million)
- 8.3.9.5. Market estimates and forecasts, by end-use 2018 - 2030 (USD Million)
- 8.3.9.6. Market estimates and forecasts, by business model 2018 - 2030 (USD Million)
- 8.3.10. Spain
- 8.3.10.1. Macroeconomic Outlook
- 8.3.10.2. Market estimates and forecasts, 2018 - 2030 (USD Million)
- 8.3.10.3. Market estimates and forecasts, by product 2018 - 2030 (USD Million)
- 8.3.10.4. Market estimates and forecasts, by application 2018 - 2030 (USD Million)
- 8.3.10.5. Market estimates and forecasts, by end-use 2018 - 2030 (USD Million)
- 8.3.10.6. Market estimates and forecasts, by business model 2018 - 2030 (USD Million)
- 8.4. Asia Pacific
- 8.4.1. Market estimates and forecasts, 2018 - 2030 (USD Million)
- 8.4.2. Market estimates and forecasts, by product 2018 - 2030 (USD Million)
- 8.4.3. Market estimates and forecasts, by application 2018 - 2030 (USD Million)
- 8.4.4. Market estimates and forecasts, by end-use 2018 - 2030 (USD Million)
- 8.4.5. Market estimates and forecasts, by business model 2018 - 2030 (USD Million)
- 8.4.6. China
- 8.4.6.1. Macroeconomic Outlook
- 8.4.6.2. Market estimates and forecasts, 2018 - 2030 (USD Million)
- 8.4.6.3. Market estimates and forecasts, by product 2018 - 2030 (USD Million)
- 8.4.6.4. Market estimates and forecasts, by application 2018 - 2030 (USD Million)
- 8.4.6.5. Market estimates and forecasts, by end-use 2018 - 2030 (USD Million)
- 8.4.6.6. Market estimates and forecasts, by business model 2018 - 2030 (USD Million)
- 8.4.7. India
- 8.4.7.1. Macroeconomic Outlook
- 8.4.7.2. Market estimates and forecasts, 2018 - 2030 (USD Million)
- 8.4.7.3. Market estimates and forecasts, by product 2018 - 2030 (USD Million)
- 8.4.7.4. Market estimates and forecasts, by application 2018 - 2030 (USD Million)
- 8.4.7.5. Market estimates and forecasts, by end-use 2018 - 2030 (USD Million)
- 8.4.7.6. Market estimates and forecasts, by business model 2018 - 2030 (USD Million)
- 8.4.8. Japan
- 8.4.8.1. Macroeconomic Outlook
- 8.4.8.2. Market estimates and forecasts, 2018 - 2030 (USD Million)
- 8.4.8.3. Market estimates and forecasts, by product 2018 - 2030 (USD Million)
- 8.4.8.4. Market estimates and forecasts, by application 2018 - 2030 (USD Million)
- 8.4.8.5. Market estimates and forecasts, by end-use 2018 - 2030 (USD Million)
- 8.4.8.6. Market estimates and forecasts, by business model 2018 - 2030 (USD Million)
- 8.4.9. South Korea
- 8.4.9.1. Macroeconomic Outlook
- 8.4.9.2. Market estimates and forecasts, 2018 - 2030 (USD Million)
- 8.4.9.3. Market estimates and forecasts, by product 2018 - 2030 (USD Million)
- 8.4.9.4. Market estimates and forecasts, by application 2018 - 2030 (USD Million)
- 8.4.9.5. Market estimates and forecasts, by end-use 2018 - 2030 (USD Million)
- 8.4.9.6. Market estimates and forecasts, by business model 2018 - 2030 (USD Million)
- 8.4.10. Australia
- 8.4.10.1. Macroeconomic Outlook
- 8.4.10.2. Market estimates and forecasts, 2018 - 2030 (USD Million)
- 8.4.10.3. Market estimates and forecasts, by product 2018 - 2030 (USD Million)
- 8.4.10.4. Market estimates and forecasts, by application 2018 - 2030 (USD Million)
- 8.4.10.5. Market estimates and forecasts, by end-use 2018 - 2030 (USD Million)
- 8.4.10.6. Market estimates and forecasts, by business model 2018 - 2030 (USD Million)
- 8.5. Central & South America
- 8.5.1. Market estimates and forecasts, 2018 - 2030 (USD Million)
- 8.5.2. Market estimates and forecasts, by product 2018 - 2030 (USD Million)
- 8.5.3. Market estimates and forecasts, by application 2018 - 2030 (USD Million)
- 8.5.4. Market estimates and forecasts, by end-use 2018 - 2030 (USD Million)
- 8.5.5. Market estimates and forecasts, by business model 2018 - 2030 (USD Million)
- 8.5.6. Brazil
- 8.5.6.1. Macroeconomic Outlook
- 8.5.6.2. Market estimates and forecasts, 2018 - 2030 (USD Million)
- 8.5.6.3. Market estimates and forecasts, by product 2018 - 2030 (USD Million)
- 8.5.6.4. Market estimates and forecasts, by application 2018 - 2030 (USD Million)
- 8.5.6.5. Market estimates and forecasts, by end-use 2018 - 2030 (USD Million)
- 8.5.6.6. Market estimates and forecasts, by business model 2018 - 2030 (USD Million)
- 8.5.7. Argentina
- 8.5.7.1. Macroeconomic Outlook
- 8.5.7.2. Market estimates and forecasts, 2018 - 2030 (USD Million)
- 8.5.7.3. Market estimates and forecasts, by product 2018 - 2030 (USD Million)
- 8.5.7.4. Market estimates and forecasts, by application 2018 - 2030 (USD Million)
- 8.5.7.5. Market estimates and forecasts, by end-use 2018 - 2030 (USD Million)
- 8.5.7.6. Market estimates and forecasts, by business model 2018 - 2030 (USD Million)
- 8.6. Middle East & Africa
- 8.6.1. Market estimates and forecasts, 2018 - 2030 (USD Million)
- 8.6.2. Market estimates and forecasts, by product 2018 - 2030 (USD Million)
- 8.6.3. Market estimates and forecasts, by application 2018 - 2030 (USD Million)
- 8.6.4. Market estimates and forecasts, by end-use 2018 - 2030 (USD Million)
- 8.6.5. Market estimates and forecasts, by business model 2018 - 2030 (USD Million)
- 8.6.6. UAE
- 8.6.6.1. Macroeconomic Outlook
- 8.6.6.2. Market estimates and forecasts, 2018 - 2030 (USD Million)
- 8.6.6.3. Market estimates and forecasts, by product 2018 - 2030 (USD Million)
- 8.6.6.4. Market estimates and forecasts, by application 2018 - 2030 (USD Million)
- 8.6.6.5. Market estimates and forecasts, by end-use 2018 - 2030 (USD Million)
- 8.6.6.6. Market estimates and forecasts, by business model 2018 - 2030 (USD Million)
- 8.6.7. Saudi Arabia
- 8.6.7.1. Macroeconomic Outlook
- 8.6.7.2. Market estimates and forecasts, 2018 - 2030 (USD Million)
- 8.6.7.3. Market estimates and forecasts, by product 2018 - 2030 (USD Million)
- 8.6.7.4. Market estimates and forecasts, by application 2018 - 2030 (USD Million)
- 8.6.7.5. Market estimates and forecasts, by end-use 2018 - 2030 (USD Million)
- 8.6.7.6. Market estimates and forecasts, by business model 2018 - 2030 (USD Million)
- 8.6.8. South Africa
- 8.6.8.1. Macroeconomic Outlook
- 8.6.8.2. Market estimates and forecasts, 2018 - 2030 (USD Million)
- 8.6.8.3. Market estimates and forecasts, by product 2018 - 2030 (USD Million)
- 8.6.8.4. Market estimates and forecasts, by application 2018 - 2030 (USD Million)
- 8.6.8.5. Market estimates and forecasts, by end-use 2018 - 2030 (USD Million)
- 8.6.8.6. Market estimates and forecasts, by business model 2018 - 2030 (USD Million)
Chapter 9. Environmental Test Chamber Market: Competitive Analysis
- 9.1. Recent Developments & Impact Analysis, By Key Market Participants
- 9.2. Company Categorization
- 9.3. Participant's Overview
- 9.4. Financial Overview
- 9.5. Product Benchmarking
- 9.6. Company Market Positioning
- 9.7. Company Market Share Analysis
- 9.8. Company Heat Map Analysis
- 9.9. Strategy Mapping
Chapter 10. Company Profiles
- 10.1. KOMEG Technology Ind Co., Ltd
- 10.2. ACMAS Technologies Pvt. Ltd.
- 10.3. Weiss Technik North America, Inc.
- 10.4. Russells Technical Products
- 10.5. Thermotron Industries
- 10.6. TA Instruments
- 10.7. Memmert GmbH + Co. KG,
- 10.8. BINDER GmbH
- 10.9. Envisys Technologies
- 10.10. ESPEC CORP
- 10.11. Angelantoni Test Technologies
- 10.12. Climatic Testing Systems, Inc. (CTS)
- 10.13. Hastest Solutions Inc.
- 10.14. CM Envirosystems
