|
|
市場調査レポート
商品コード
1321377
ガス洗浄技術の市場規模、シェア、動向分析レポート:製品別、最終用途別、地域別、セグメント別予測、2023年~2030年Gas Cleaning Technologies Market Size, Share & Trends Analysis Report By Product (Scrubbers, Dry Sorbent Injection, Particulate/Dust Collection), By End-use (Chemical, Cement), By Region, And Segment Forecasts, 2023 - 2030 |
||||||
|
|
|||||||
カスタマイズ可能
|
|||||||


| ガス洗浄技術の市場規模、シェア、動向分析レポート:製品別、最終用途別、地域別、セグメント別予測、2023年~2030年 |
|
出版日: 2023年07月13日
発行: Grand View Research
ページ情報: 英文 190 Pages
納期: 2~10営業日
|

- 全表示
- 概要
- 図表
- 目次
ガス洗浄技術市場の成長と動向
Grand View Research社の最新レポートによると、世界のガス洗浄技術の市場規模は2030年までに467億3,000万米ドルに達すると予測されています。
同市場は2023年から2030年にかけてCAGR 4.9%で拡大すると予測されています。同市場の成長は、世界中で石炭火力発電所が増加していることが要因であると予測されています。国際エネルギー機関によると、石炭火力発電は2021年に史上最高を記録し、世界全体で8%増加しました。石炭は2021年の追加電力需要の半分以上を賄っています。2020年と比較して、2021年の石炭火力発電所からの排出量は米国で16%、EUで20%増加しました。また、インドでは2021年に石炭火力発電量が過去最高を記録し、2020年比で13%増加しました。
再生可能エネルギーの減少やロシア・ウクライナ紛争の経済的影響もあり、世界の石炭火力発電需要は2021年に力強く伸びた。このことが、今後数年間のガス洗浄技術需要を牽引する可能性が高いです。世界銀行グループによると、産業界は世界の直接・間接的な温室効果ガス(GHGs)排出量の3分の1以上を占めています。様々な産業の中でも、鉄鋼、化学、製造、セメントといった特定のセクターは、気候変動や地球温暖化の主な原因となっています。これは、これらの産業が加工や製造活動を行うために大量のエネルギーを必要とすることに起因しています。大気汚染防止技術は、温室効果ガスの排出を制限するために産業界にとって不可欠なものとなっています。
したがって、大気汚染の増加とその健康と環境への影響により、さまざまな汚染制御技術の導入が増加し、その結果、市場の成長を促進すると考えられます。工業化の進展とさまざまな産業の成長により、大気汚染が大幅に増加しています。電力、化学、製油所・石油化学、テキスタイル、金属、セメントなどの産業プロセスのほとんどは、さまざまなガスの使用を伴い、これらのガスやプロセスの他の副産物の排出の原因となっています。このような産業活動は、一酸化炭素、炭化水素、二酸化硫黄、窒素酸化物などの汚染物質の排出の原因となっており、これも予測期間中のこの市場の成長を促進しています。
ガス洗浄技術市場レポートハイライト
- NOx削減セグメントは、2022年に市場シェアの20.8%を占めると予想されます。NOxスクラブの背後にある技術は、O3やClO2のような酸化剤の助けを借りて、排ガス中の一酸化窒素(NO)を可溶性窒素酸化物(N2O5とNO2)に酸化することです。典型的な排ガススクラバーでは、NO2とN2O5をアルカリ性洗浄液を使って排ガスから除去します。
- 石油・ガスを処理する石油化学工場、製油所、その他の施設からの排ガスは、潜在的に有害なガスや化学廃棄物を発生させることが多いです。その結果、規制基準を遵守するため、石油化学会社や製油所は有害な排気廃棄物を除去するソリューションを導入しなければならず、湿式スクラバーのようなガス洗浄技術の需要が増加すると予想されます。
- プラスチックの使用に伴う環境問題への懸念から、環境に優しく生分解性のある包装材料への需要が増加すると予想されます。その結果、前述の理由がパルプ・製紙業界を支え、パルプ・製紙セグメントにおける湿式スクラバーの需要を促進すると予想されます。
- 中東・アフリカは、GCC諸国の急速な工業化により、予測期間中にCAGR 5.6%を示すと予想されます。
- 2023年6月、大気汚染防止と臭気処理を専門とするJohn Cockerill Environment社のBusiness Line Air & Gasは、フランスを拠点とする世界クラスの革新的半導体材料メーカーの新工場にガススクラバーを設置しました。
目次
第1章 調査手法と範囲
- 調査手法
- 調査範囲と前提条件
- 情報調達
- 情報分析
- 市場の形成とデータの視覚化
- データの検証と公開
第2章 エグゼクティブサマリー
第3章 市場変数、動向、および範囲
- 市場セグメンテーションと範囲
- 普及と成長の見通しマッピング
- 業界のバリューチェーン分析
- 規制の枠組み
- 技術のフレームワーク
- 市場力学
- 市場促進要因分析
- 市場抑制要因分析
- 業界の課題
- ビジネス環境ツール分析:ガス洗浄技術市場
- ポーターのファイブフォース分析
- PESTLE分析
- 流通チャネル分析
- ベンダーマトリックス
- 主要コンポーネントプロバイダーのリスト
- 主要メーカーのリスト
- 主要ディストリビューターのリスト
第4章 ガス洗浄技術市場:製品の推定・動向分析
- ガス洗浄技術市場:製品の変動分析、2022年および2030年
- スクラバー
- 乾式吸着剤注入
- 微粒子・集塵
- ミスト、エアロゾル、微粒子
- NOx削減
第5章 ガス洗浄技術市場:最終用途の推定・動向分析
- ガス洗浄技術市場:最終用途の変動分析、2022年および2030年
- 発電
- 化学
- セメント
- 製油所・石油化学
- パルプ・製紙
- 鉱業
- テキスタイル
- 金属
- その他
第6章 ガス洗浄技術市場:地域の推定・動向分析
- 北米
- 米国
- カナダ
- メキシコ
- 欧州
- ドイツ
- フランス
- イタリア
- スペイン
- 英国
- アジア太平洋地域
- 中国
- インド
- 日本
- 韓国
- オーストラリア
- 中南米
- ブラジル
- アルゼンチン
- 中東・アフリカ
- サウジアラビア
- アラブ首長国連邦
- 南アフリカ
第7章 競合情勢
- 主要市場参入企業による最近の動向と影響分析
- 企業の分類
- 参入企業の概要
- 財務概要
- 製品のベンチマーク
- 企業の市場での位置付け
- 企業の市場シェア分析
- 企業ヒートマップ分析
- 戦略マッピング
- 主要企業、最近の開発、および業界への影響
第8章 企業プロファイル
- Babcock & Wilcox Enterprises, Inc.
- ALFA LAVAL
- CECO ENVIRONMENTAL.
- Evoqua Water Technologies LLC
- Fuji Electric Co., Ltd.
- GEA Group Aktiengesellschaft
- Wartsila
- SA HAMON
- Hitachi Zosen Inova AG
- KCH Services Inc.
- Nederman Holding AB
- Tri-Mer Corporation
- Verantis Environmental Solutions Group
- Yara Marine Technologies
- Elessent Clean Technologies Inc.
- DuconEnv.com
- Durr Aktiengesellschaft
- FLSmidth
- ANDRITZ
- John Cockerill
List of Tables
- Table 1 Upcoming New Coal Plants By Region (MW)
- Table 2 List Of Key Components Providers
- Table 3 List Of Key Manufacturers
- Table 4 List Of Key Distributors
- Table 5 Gas Cleaning Technologies Market Estimates and Forecasts, By Product, 2018 - 2030 (USD Million)
- Table 6 Gas Cleaning Technologies Market Estimates and Forecasts, By End - use, 2018 - 2030 (USD Million)
- Table 7 Key Strategies Adopted By Leading Chemical Companies, 2023
- Table 8 U.S. Macroeconomic Outlook
- Table 9 Canada Macroeconomic Outlook
- Table 10 Mexico Macroeconomic Outlook
- Table 11 Emission Parameters of Major European Countries, 2023
- Table 12 Germany Macroeconomic Outlook
- Table 13 France Macroeconomic Outlook
- Table 14 Italy Macroeconomic Outlook
- Table 15 Spain Macroeconomic Outlook
- Table 16 UK Macroeconomic Outlook
- Table 17 China Macroeconomic Outlook
- Table 18 India Macroeconomic Outlook
- Table 19 Japan Macroeconomic Outlook
- Table 20 South Korea Macroeconomic Outlook
- Table 21 Australia Macroeconomic Outlook
- Table 22 Brazil Macroeconomic Outlook
- Table 23 Argentina Macroeconomic Outlook
- Table 24 Newly Constructed And Under Construction Projects In Argentina
- Table 25 UAE Macroeconomic Outlook
- Table 26 Saudi Arabia Macroeconomic Outlook
- Table 27 South Africa Macroeconomic Outlook
- Table 28 Recent Developments & Impact Analysis, By Key Market Participants
- Table 29 Company Heat Map Analysis, 2022
- Table 30 Key Companies: Contracts/Agreements
- Table 31 Key Companies: Expansions
- Table 32 Key Companies: Investments
- Table 33 Key Companies: Mergers & Acquisitions
- Table 34 Key Companies: Partnerships/Collaborations
- Table 35 Key Companies: Product Launches
List of Figures
- Fig. 1 Market Segmentation & Scope
- Fig. 2 Scrubbing Reagents Market Segmentation & Scope
- Fig. 3 Information Procurement
- Fig. 4 Data Analysis Models
- Fig. 5 Market Formulation And Validation
- Fig. 6 Data Validating & Publishing
- Fig. 7 Market Snapshot
- Fig. 8 Gas Cleaning Technologies Market: Product Segment Snapshot
- Fig. 9 Gas Cleaning Technologies Market: End-use Segment Snapshot
- Fig. 10 Competitive Landscape Snapshot
- Fig. 11 Gas Cleaning Technologies Market Value, 2022 (USD Million)
- Fig. 12 Gas Cleaning Technologies Market - Value Chain Analysis
- Fig. 13 Market Dynamics
- Fig. 14 Market Driver Analysis
- Fig. 15 Global Death Rate From Air Pollution, 2017 - 2019
- Fig. 16 Market Restraint Analysis
- Fig. 17 Global Electric Vehicles Sales, Thousand Units, 2018 - 2022
- Fig. 18 Gas Cleaning Technologies Market: PORTER's Analysis
- Fig. 19 Gas Cleaning Technologies Market: PESTEL Analysis
- Fig. 20 Gas Cleaning Technologies Market, By Product: Key Takeaways
- Fig. 21 Gas Cleaning Technologies Market: Product Movement Analysis & Market Share, 2022 & 2030
- Fig. 22 Scrubbers Market Estimates & Forecasts, 2018 - 2030 (USD Million)
- Fig. 23 Wet Scrubbers Market Estimates & Forecasts, 2018 - 2030 (USD Million)
- Fig. 24 Wet Scrubbers Market Estimates & Forecasts, By Product, 2018 - 2030 (USD Million)
- Fig. 25 Dry Scrubbers Market Estimates & Forecasts, 2018 - 2030 (USD Million)
- Fig. 26 Dry Scrubbers Market Estimates & Forecasts, By Product, 2018 - 2030 (USD Million)
- Fig. 27 Dry Sorbent Injection Market Estimates & Forecasts, 2018 - 2030 (USD Million)
- Fig. 28 Particulate/Dust Collection Market Estimates & Forecasts, 2018 - 2030 (USD Million)
- Fig. 29 Baghouse Market Estimates & Forecasts, 2018 - 2030 (USD Million)
- Fig. 30 Gas Filtration Market Estimates & Forecasts, 2018 - 2030 (USD Million)
- Fig. 31 Electrostatic Precipitators (ESP) Market Estimates & Forecasts, 2018 - 2030 (USD Million)
- Fig. 32 Cyclonic Separators Market Estimates & Forecasts, 2018 - 2030 (USD Million)
- Fig. 33 Mist, Aerosols, Fine Particulate Market Estimates & Forecasts, 2018 - 2030 (USD Million)
- Fig. 34 Wet Electrostatic Precipitator (WESP) Market Estimates & Forecasts, 2018 - 2030 (USD Million)
- Fig. 35 Candle Filter / Mist Eliminators Market Estimates & Forecasts, 2018 - 2030 (USD Million)
- Fig. 36 Candle Filter / Mist Eliminators Market Estimates & Forecasts, By Material, 2018 - 2030 (USD Million)
- Fig. 37 Others Market Estimates & Forecasts, 2018 - 2030 (USD Million)
- Fig. 38 NOx reduction Estimates & Forecasts, 2018 - 2030 (USD Million)
- Fig. 39 SCR / SNCR Market Estimates & Forecasts, 2018 - 2030 (USD Million)
- Fig. 40 Low NOx burners Market Estimates & Forecasts, 2018 - 2030 (USD Million)
- Fig. 41 Fig. 43 NOx Wet Scrubbing Market Estimates & Forecasts, 2018 - 2030 (USD Million)
- Fig. 42 Fig. 44 Gas Cleaning Technologies Market, By End-use: Key Takeaways
- Fig. 43 Gas Cleaning Technologies Market: End-use Movement Analysis & Market Share, 2022 & 2030
- Fig. 44 Power Generation Market Estimates & Forecasts, 2018 - 2030 (USD Million)
- Fig. 45 Coal Fired Power Capacity In India, China, & US (MW)
- Fig. 46 Power Generation Market Estimates & Forecasts, By Fuel Type, 2018 - 2030 (USD Million)
- Fig. 47 Chemical Market Estimates & Forecasts, 2018 - 2030 (USD Million)
- Fig. 48 Cement Market Estimates & Forecasts, 2018 - 2030 (USD Million)
- Fig. 49 Global Cement Production In The Net Zero Scenario, 2018-2021, In Mt
- Fig. 50 Refinery and Petrochemicals Market Estimates & Forecasts, 2018 - 2030 (USD Million)
- Fig. 51 Pulp & Paper Market Estimates & Forecasts, 2018 - 2030 (USD Million)
- Fig. 52 Pulp & Paper Production By Country, 1,000 Tons Air Dry
- Fig. 53 Mining Market Estimates & Forecasts, 2018 - 2030 (USD Million)
- Fig. 54 Global Coal Consumption, 2020-2023, In Mt
- Fig. 55 Textiles Market Estimates & Forecasts, 2018 - 2030 (USD Million)
- Fig. 56 Global Textile Mills, 2018 to 2030, In USD Million
- Fig. 57 Metals Market Estimates & Forecasts, 2018 - 2030 (USD Million)
- Fig. 58 Metals Market Estimates & Forecasts, By Material, 2018 - 2030 (USD Million)
- Fig. 59 Crude Steel Production, By Geographical, In Percentage
- Fig. 60 Steel Metals Market Estimates & Forecasts, By Furnaces, 2018 - 2030 (USD Million)
- Fig. 61 Others Market Estimates & Forecasts, 2018 - 2030 (USD Million)
- Fig. 62 Gas Cleaning Technologies Market Revenue, By Region, 2022 & 2030 (USD Million)
- Fig. 63 Region Marketplace: Key Takeaways
- Fig. 64 Region Marketplace: Key Takeaways
- Fig. 65 North America Gas Cleaning Technologies Market Estimates & Forecasts, 2018 - 2030 (USD Million)
- Fig. 66 US Gas Cleaning Technologies Market Estimates & Forecasts, 2018 - 2030 (USD Million)
- Fig. 67 Canada Gas Cleaning Technologies Market Estimates & Forecasts, 2018 - 2030 (USD Million)
- Fig. 68 Mexico Gas Cleaning Technologies Market Estimates & Forecasts, 2018 - 2030 (USD Million)
- Fig. 69 Europe Gas Cleaning Technologies Market Estimates & Forecasts, 2018 - 2030 (USD Million)
- Fig. 70 Germany Gas Cleaning Technologies Market Estimates & Forecasts, 2018 - 2030 (USD Million)
- Fig. 71 Greenhouse Gas Emission Trends in Germany, Million Tones, 2019-2022
- Fig. 72 France Gas Cleaning Technologies Market Estimates & Forecasts, 2018 - 2030 (USD Million)
- Fig. 73 Italy Gas Cleaning Technologies Market Estimates & Forecasts, 2018 - 2030 (USD Million)
- Fig. 74 Spain Gas Cleaning Technologies Market Estimates & Forecasts, 2018 - 2030 (USD Million)
- Fig. 75 UK Gas Cleaning Technologies Market Estimates & Forecasts, 2018 - 2030 (USD Million)
- Fig. 76 Asia Pacific Gas Cleaning Technologies Market Estimates & Forecasts, 2018 - 2030 (USD Million)
- Fig. 77 China Gas Cleaning Technologies Market Estimates & Forecasts, 2018 - 2030 (USD Million)
- Fig. 78 India Gas Cleaning Technologies Market Estimates & Forecasts, 2018 - 2030 (USD Million)
- Fig. 79 Japan Gas Cleaning Technologies Market Estimates & Forecasts, 2018 - 2030 (USD Million)
- Fig. 80 South Korea Gas Cleaning Technologies Market Estimates & Forecasts, 2018 - 2030 (USD Million)
- Fig. 81 Australia Gas Cleaning Technologies Market Estimates & Forecasts, 2018 - 2030 (USD Million)
- Fig. 82 Central & South America Gas Cleaning Technologies Market Estimates & Forecasts, 2018 - 2030 (USD Million)
- Fig. 83 Share Of Intermediate Consumption And Value Added Over The Gross Domestic Production Value, 2020
- Fig. 84 Brazil Gas Cleaning Technologies Market Estimates & Forecasts, 2018 - 2030 (USD Million)
- Fig. 85 Argentina Gas Cleaning Technologies Market Estimates & Forecasts, 2018 - 2030 (USD Million)
- Fig. 86 Middle East & Africa Gas Cleaning Technologies Market Estimates & Forecasts, 2018 - 2030 (USD Million)
- Fig. 87 UAE Gas Cleaning Technologies Market Estimates & Forecasts, 2018 - 2030 (USD Million)
- Fig. 88 Saudi Arabia Gas Cleaning Technologies Market Estimates & Forecasts, 2018 - 2030 (USD Million)
- Fig. 89 South Africa Gas Cleaning Technologies Market Estimates & Forecasts, 2018 - 2030 (USD Million)
- Fig. 90 Key Company/Competition Categorization
- Fig. 91 Company Market Positioning
- Fig. 92 Competitive Dashboard Analysis
- Fig. 93 Strategic Framework
Gas Cleaning Technologies Market Growth & Trends
The global gas cleaning technologies market size is anticipated to reach USD 46.73 billion by 2030, according to a new report by Grand View Research, Inc. The market is expected to expand at a CAGR of 4.9% from 2023 to 2030. The growth of the market is anticipated to be driven by the increasing number of coal-fired power plants across the globe. According to the International Energy Agency, coal-fired power generation reached an all-time high in 2021, increasing by 8% globally. Coal served more than half of the additional power demand in 2021. Compared to 2020, emissions from coal-fired power plants in the U.S. increased by 16% and by 20% in the European Union in 2021. Also, in India, coal-fired power generation reached a record high in 2021, increasing by 13% compared to 2020.
The demand for coal-fired power in the world grew strongly in 2021 partly due to the decline in renewable energy and also the economic impacts of the Russia-Ukraine conflict. Which is likely to drive gas cleaning technologies demand in the upcoming years. According to the World Bank Group, industries contribute more than one-third of the direct and indirect Greenhouse Gas (GHGs) emissions globally. Among various industries, certain sectors like iron and steel, chemical, manufacturing, and cement are some of the primary contributors to climate change and global warming. This can be attributed to the fact that these industries require large amounts of energy for carrying out their processing or manufacturing activities. Air pollution control technologies are becoming critical for industries in order to limit the emission of GHGs.
Therefore, the rising air pollution and its impact on the health and environment are likely to augment the installation of various pollution control technologies, consequently driving the growth of the market. The rising industrialization and growth in various industries are leading to significantly increased air pollution. Most of the industrial processes in power, chemical, refineries & petrochemicals, textiles, metals, and cement, among other industries, involve the use of various gases and are responsible for the emission of these gases or other by-products of the process. Such industrial activities are responsible for the emission of pollutants such as carbon monoxide, hydrocarbons, sulfur dioxide, and nitrogen oxides, which is also fueling the growth of this market over the forecast period.
Gas Cleaning Technologies Market Report Highlights
- The NOx reduction segment is expected to hold 20.8% of the market share in 2022. The technology behind NOx scrubbing involves oxidizing nitrogen monoxide (NO) in flue gas to soluble nitrogen oxides (N2O5 & NO2) with the help of an oxidant like O3 or ClO2. In a typical flue gas scrubber, NO2 and N2O5 are then removed from the flue gas using an alkaline scrubbing liquid
- Exhaust streams from petrochemical plants, refineries, and other facilities that process oil and gas often generate potentially hazardous gas and chemical waste. As a result, in order to comply with regulatory standards, petrochemical firms, and refineries have to put in place solutions to remove hazardous exhaust waste, which is expected to increase the demand for gas cleaning technology like wet scrubbers
- The demand for eco-friendly and biodegradable packaging materials is anticipated to increase due to environmental concerns associated with the usage of plastics. As a result, the aforementioned reasons are anticipated to support the pulp and paper industry, which will drive demand for wet scrubbers in the pulp and paper segment
- Middle East & Africa is expected to exhibit a CAGR of 5.6% over the forecast period owing to rapid industrialization in GCC countries
- In June 2023, Business Line Air & Gas of John Cockerill Environment which specializes in air pollution control and odor treatment equipped the brand new plant of a France-based world-class innovative semiconductor material manufacturer with gas scrubbers
Table of Contents
Chapter 1. Methodology and Scope
- 1.1. Research Methodology
- 1.2. Research Scope and Assumptions
- 1.3. Information Procurement
- 1.3.1. Purchased Database
- 1.3.2. GVR's Internal Database
- 1.3.3. Secondary Sources & Third-Party Perspectives
- 1.3.4. Primary Research
- 1.4. Information Analysis
- 1.4.1. Data Analysis Models
- 1.5. Market Formulation & Data Visualization
- 1.6. Data Validation & Publishing
Chapter 2. Executive Summary
- 2.1. Market Outlook
- 2.2. Segmental Outlook
- 2.3. Competitive Insights
Chapter 3. Market Variables, Trends, and Scope
- 3.1. Market Segmentation & Scope
- 3.2. Penetration & Growth Prospect Mapping
- 3.3. Industry Value Chain Analysis
- 3.4. Regulatory Framework
- 3.5. Technology Framework
- 3.6. Market Dynamics
- 3.6.1. Market Driver Analysis
- 3.6.2. Market Restraint Analysis
- 3.6.3. Industry Challenges
- 3.7. Business Environmental Tools Analysis: Gas Cleaning Technologies Market
- 3.7.1. Porter's Five Forces Analysis
- 3.7.1.1. Bargaining Power of Suppliers
- 3.7.1.2. Bargaining Power of Buyers
- 3.7.1.3. Threat of Substitution
- 3.7.1.4. Threat of New Entrants
- 3.7.1.5. Competitive Rivalry
- 3.7.2. PESTLE Analysis
- 3.7.2.1. Political Landscape
- 3.7.2.2. Economic Landscape
- 3.7.2.3. Social Landscape
- 3.7.2.4. Technology Landscape
- 3.7.2.5. Environmental Landscape
- 3.7.2.6. Legal Landscape
- 3.7.1. Porter's Five Forces Analysis
- 3.8. Distribution Channel Analysis
- 3.9. Vendor Matrix
- 3.9.1. List of Key Component Provider
- 3.9.2. List of Key Manufacturers
- 3.9.3. List of Key Distributors
Chapter 4. Gas Cleaning Technologies Market: Product Estimates & Trend Analysis
- 4.1. Gas Cleaning Technologies Market: Product Movement Analysis, 2022 & 2030
- 4.2. Scrubbers
- 4.2.1. Market estimates and forecasts, 2018 - 2030 (USD Million)
- 4.2.2. Market estimates and forecasts by type, 2018 - 2030 (USD Million)
- 4.3. Dry Sorbent Injection
- 4.3.1. Market estimates and forecasts, 2018 - 2030 (USD Million)
- 4.4. Particulate / Dust Collection
- 4.4.1. Market estimates and forecasts, 2018 - 2030 (USD Million)
- 4.4.2. Market estimates and forecasts by product, 2018 - 2030 (USD Million)
- 4.5. Mist, Aerosols, Fine Particulate
- 4.5.1. Market estimates and forecasts, 2018 - 2030 (USD Million)
- 4.5.2. Market estimates and forecasts by product, 2018 - 2030 (USD Million)
- 4.6. NOx reduction
- 4.6.1. Market estimates and forecasts, 2018 - 2030 (USD Million)
- 4.6.2. Market estimates and forecasts by product, 2018 - 2030 (USD Million)
Chapter 5. Gas Cleaning Technologies Market: End-use Estimates & Trend Analysis
- 5.1. Gas Cleaning Technologies Market: End-use Movement Analysis, 2022 & 2030
- 5.2. Power Generation
- 5.2.1. Market estimates and forecasts, 2018 - 2030 (USD Million)
- 5.2.2. Market estimates and forecasts by fuel type, 2018 - 2030 (USD Million)
- 5.3. Chemical
- 5.3.1. Market estimates and forecasts, 2018 - 2030 (USD Million)
- 5.4. Cement
- 5.4.1. Market estimates and forecasts, 2018 - 2030 (USD Million)
- 5.5. Refinery & Petrochemical
- 5.5.1. Market estimates and forecasts, 2018 - 2030 (USD Million)
- 5.6. Pulp & Paper
- 5.6.1. Market estimates and forecasts, 2018 - 2030 (USD Million)
- 5.7. Mining
- 5.7.1. Market estimates and forecasts, 2018 - 2030 (USD Million)
- 5.8. Textiles
- 5.8.1. Market estimates and forecasts, 2018 - 2030 (USD Million)
- 5.9. Metals
- 5.9.1. Market estimates and forecasts, 2018 - 2030 (USD Million)
- 5.9.2. Market estimates and forecasts by type, 2018 - 2030 (USD Million)
- 5.10. Others
- 5.10.1. Market estimates and forecasts, 2018 - 2030 (USD Million)
Chapter 6. Gas Cleaning Technologies Market: Country Estimates & Trend Analysis
- 6.1. Glass Prefilled Syringes and Glass Vials Packaging Equipment Country Movement Analysis, 2022 & 2030
- 6.2. North America
- 6.2.1. Market estimates and forecasts, 2018 - 2030 (USD Million)
- 6.2.2. Market estimates and forecasts, by product, 2018 - 2030 (USD Million)
- 6.2.3. Market estimates and forecasts, by end-use, 2018 - 2030 (USD Million)
- 6.2.4. U.S.
- 6.2.4.1. Market estimates and forecasts, 2018 - 2030 (USD Million)
- 6.2.4.2. Market estimates and forecasts, by product, 2018 - 2030 (USD Million)
- 6.2.4.3. Market estimates and forecasts, by end-use, 2018 - 2030 (USD Million)
- 6.2.5. Canada
- 6.2.5.1. Market estimates and forecasts, 2018 - 2030 (USD Million)
- 6.2.5.2. Market estimates and forecasts, by product, 2018 - 2030 (USD Million)
- 6.2.5.3. Market estimates and forecasts, by end-use, 2018 - 2030 (USD Million)
- 6.2.6. Mexico
- 6.2.6.1. Market estimates and forecasts, 2018 - 2030 (USD Million)
- 6.2.6.2. Market estimates and forecasts, by product, 2018 - 2030 (USD Million)
- 6.2.6.3. Market estimates and forecasts, by end-use, 2018 - 2030 (USD Million)
- 6.3. Europe
- 6.3.1. Market estimates and forecasts, 2018 - 2030 (USD Million)
- 6.3.2. Market estimates and forecasts, by product, 2018 - 2030 (USD Million)
- 6.3.3. Market estimates and forecasts, by end-use, 2018 - 2030 (USD Million)
- 6.3.4. Germany
- 6.3.4.1. Market estimates and forecasts, 2018 - 2030 (USD Million)
- 6.3.4.2. Market estimates and forecasts, by product, 2018 - 2030 (USD Million)
- 6.3.4.3. Market estimates and forecasts, by end-use, 2018 - 2030 (USD Million)
- 6.3.5. France
- 6.3.5.1. Market estimates and forecasts, 2018 - 2030 (USD Million)
- 6.3.5.2. Market estimates and forecasts, by product, 2018 - 2030 (USD Million)
- 6.3.5.3. Market estimates and forecasts, by end-use, 2018 - 2030 (USD Million)
- 6.3.6. Italy
- 6.3.6.1. Market estimates and forecasts, 2018 - 2030 (USD Million)
- 6.3.6.2. Market estimates and forecasts, by product, 2018 - 2030 (USD Million)
- 6.3.6.3. Market estimates and forecasts, by end-use, 2018 - 2030 (USD Million)
- 6.3.7. Spain
- 6.3.7.1. Market estimates and forecasts, 2018 - 2030 (USD Million)
- 6.3.7.2. Market estimates and forecasts, by product, 2018 - 2030 (USD Million)
- 6.3.7.3. Market estimates and forecasts, by end-use, 2018 - 2030 (USD Million)
- 6.3.8. UK
- 6.3.8.1. Market estimates and forecasts, 2018 - 2030 (USD Million)
- 6.3.8.2. Market estimates and forecasts, by product, 2018 - 2030 (USD Million)
- 6.3.8.3. Market estimates and forecasts, by end-use, 2018 - 2030 (USD Million)
- 6.4. Asia Pacific
- 6.4.1. Market estimates and forecasts, 2018 - 2030 (USD Million)
- 6.4.2. Market estimates and forecasts, by product, 2018 - 2030 (USD Million)
- 6.4.3. Market estimates and forecasts, by end-use, 2018 - 2030 (USD Million)
- 6.4.4. China
- 6.4.4.1. Market estimates and forecasts, 2018 - 2030 (USD Million)
- 6.4.4.2. Market estimates and forecasts, by product, 2018 - 2030 (USD Million)
- 6.4.4.3. Market estimates and forecasts, by end-use, 2018 - 2030 (USD Million)
- 6.4.5. India
- 6.4.5.1. Market estimates and forecasts, 2018 - 2030 (USD Million)
- 6.4.5.2. Market estimates and forecasts, by product, 2018 - 2030 (USD Million)
- 6.4.5.3. Market estimates and forecasts, by end-use, 2018 - 2030 (USD Million)
- 6.4.6. Japan
- 6.4.6.1. Market estimates and forecasts, 2018 - 2030 (USD Million)
- 6.4.6.2. Market estimates and forecasts, by product, 2018 - 2030 (USD Million)
- 6.4.6.3. Market estimates and forecasts, by end-use, 2018 - 2030 (USD Million)
- 6.4.7. South Korea
- 6.4.7.1. Market estimates and forecasts, 2018 - 2030 (USD Million)
- 6.4.7.2. Market estimates and forecasts, by product, 2018 - 2030 (USD Million)
- 6.4.7.3. Market estimates and forecasts, by end-use, 2018 - 2030 (USD Million)
- 6.4.8. Australia
- 6.4.8.1. Market estimates and forecasts, 2018 - 2030 (USD Million)
- 6.4.8.2. Market estimates and forecasts, by product, 2018 - 2030 (USD Million)
- 6.4.8.3. Market estimates and forecasts, by end-use, 2018 - 2030 (USD Million)
- 6.5. Central & South America
- 6.5.1. Market estimates and forecasts, 2018 - 2030 (USD Million)
- 6.5.2. Market estimates and forecasts, by product, 2018 - 2030 (USD Million)
- 6.5.3. Market estimates and forecasts, by end-use, 2018 - 2030 (USD Million)
- 6.5.4. Brazil
- 6.5.4.1. Market estimates and forecasts, 2018 - 2030 (USD Million)
- 6.5.4.2. Market estimates and forecasts, by product, 2018 - 2030 (USD Million)
- 6.5.4.3. Market estimates and forecasts, by end-use, 2018 - 2030 (USD Million)
- 6.5.5. Argentina
- 6.5.5.1. Market estimates and forecasts, 2018 - 2030 (USD Million)
- 6.5.5.2. Market estimates and forecasts, by product, 2018 - 2030 (USD Million)
- 6.5.5.3. Market estimates and forecasts, by end-use, 2018 - 2030 (USD Million)
- 6.6. Middle East & Africa
- 6.6.1. Market estimates and forecasts, 2018 - 2030 (USD Million)
- 6.6.2. Market estimates and forecasts, by product, 2018 - 2030 (USD Million)
- 6.6.3. Market estimates and forecasts, by end-use, 2018 - 2030 (USD Million)
- 6.6.4. Saudi Arabia
- 6.6.4.1. Market estimates and forecasts, 2018 - 2030 (USD Million)
- 6.6.4.2. Market estimates and forecasts, by product, 2018 - 2030 (USD Million)
- 6.6.4.3. Market estimates and forecasts, by end-use, 2018 - 2030 (USD Million)
- 6.6.5. UAE
- 6.6.5.1. Market estimates and forecasts, 2018 - 2030 (USD Million)
- 6.6.5.2. Market estimates and forecasts, by product, 2018 - 2030 (USD Million)
- 6.6.5.3. Market estimates and forecasts, by end-use, 2018 - 2030 (USD Million)
- 6.6.6. South Africa
- 6.6.6.1. Market estimates and forecasts, 2018 - 2030 (USD Million)
- 6.6.6.2. Market estimates and forecasts, by product, 2018 - 2030 (USD Million)
- 6.6.6.3. Market estimates and forecasts, by end-use, 2018 - 2030 (USD Million)
Chapter 7. Competitive Landscape
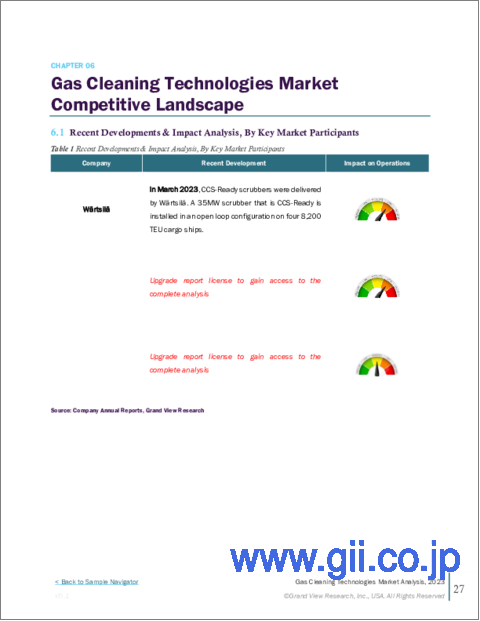
- 7.1. Recent Developments & Impact Analysis, By Key Market Participants
- 7.2. Company Categorization
- 7.3. Participant's Overview
- 7.4. Financial Overview
- 7.5. Product Benchmarking
- 7.6. Company Market Positioning
- 7.7. Company Market Share Analysis
- 7.8. Company Heat Map Analysis
- 7.9. Strategy Mapping
- 7.10. Key Players, Recent Development & Their Impact on the Industry
Chapter 8. Company Profiles
- 8.1. Babcock & Wilcox Enterprises, Inc.
- 8.2. ALFA LAVAL
- 8.3. CECO ENVIRONMENTAL.
- 8.4. Evoqua Water Technologies LLC
- 8.5. Fuji Electric Co., Ltd.
- 8.6. GEA Group Aktiengesellschaft
- 8.7. Wartsila
- 8.8. S.A. HAMON
- 8.9. Hitachi Zosen Inova AG
- 8.10. KCH Services Inc.
- 8.11. Nederman Holding AB
- 8.12. Tri-Mer Corporation
- 8.13. Verantis Environmental Solutions Group
- 8.14. Yara Marine Technologies
- 8.15. Elessent Clean Technologies Inc.
- 8.16. DuconEnv.com
- 8.17. Durr Aktiengesellschaft
- 8.18. FLSmidth
- 8.19. ANDRITZ
- 8.20. John Cockerill