|
|
市場調査レポート
商品コード
1301286
米国のe-Bikeの市場規模、シェア、動向分析レポート:推進タイプ別、駆動タイプ別、用途別、バッテリー別、最終用途別、セグメント予測、2023年~2030年U.S. E-bike Market Size, Share & Trends Analysis Report By Propulsion Type, By Drive Type, By Application, By Battery, By End-use (Personal, Commercial), And Segment Forecasts, 2023 - 2030 |
||||||
|
|
|||||||
カスタマイズ可能
|
|||||||


| 米国のe-Bikeの市場規模、シェア、動向分析レポート:推進タイプ別、駆動タイプ別、用途別、バッテリー別、最終用途別、セグメント予測、2023年~2030年 |
|
出版日: 2023年06月28日
発行: Grand View Research
ページ情報: 英文 110 Pages
納期: 2~10営業日
|

- 全表示
- 概要
- 図表
- 目次
米国のe-Bike市場の成長と動向
Grand View Research, Inc.の最新レポートによると、米国のe-Bikeの市場規模は2030年までに71億6,000万米ドルに達し、予測期間中のCAGRは15.6%を記録すると予測されています。
米国における電動自転車(e-Bike)の販売台数の増加は、主にCOVID-19の大流行時に消費者が移動のための代替手段を選択したため、e-Bikeの採用が増加したことに起因しています。また、ガソリン価格の高騰や、自動車よりも短時間で何度も通勤するためにe-Bikeを選ぶという意識の高まりも、市場成長を促進すると予想される要因です。加えて、輸入e-Bikeが増加し、地元メーカーが増加したことで、市場は価格低下を目の当たりにし、消費者に手頃な価格で提供できるようになっています。このように、同市場は予測期間中、利害関係者に数多くの成長機会を提供すると期待されています。
さらに、米国の道路における交通渋滞の増加や、政府制度の増加は、消費者に大きな利益をもたらしています。例えば、2023年3月には、2021年の環境法(Electric Bike Incentive Kickstart for the Environment Act)に関連する法案が改正され、国内でのe-Bikeの導入が強化されました。この新法案により、e-Bikeの新規購入者は1,500米ドルを上限に30%の税額控除を受けることができます。
レクリエーションだけでなく、日常的な移動手段としても顧客の関心が高まっていることから、政府関係者は当初の法案を修正しました。その後、e-Bikeの需要は国内で大きく伸びました。さらに、PeopleForBikes、New Urban Mobility Alliance(NUMO)、League of American Bicyclists、CalBike、Sierra Clubなど、複数の環境保護団体や自転車擁護団体が政府のイニシアティブを支持し、従来の交通手段よりもe-Bikeを利用することの利点について消費者の意識を高めています。
商業セグメント向けのe-Bikeは、機能性と接続性を高めるためにスマート機能を搭載することが増えています。GPS追跡システムは、効率的な車両管理、配達のリアルタイム監視、ルート最適化を可能にします。一部のe-Bikeには、ナビゲーション、速度、走行距離、バッテリー状態などの情報をライダーに提供するための統合スクリーンや接続オプションが装備されています。このようなスマートな機能は業務効率を向上させ、企業がe-Bikeフリートを効果的に追跡・管理することを可能にします。
市場の主要プレーヤーは、事業運営と製品提供を強化するために、新製品の発売やパートナーシップなどの戦略に注力しています。例えば、米国を拠点とするe-Bikeの新興企業Heybikeは2023年5月、スマートLCDスクリーン、Bluetooth、油圧式フロントフォークサスペンション、その他いくつかの機能を提供する完全折りたたみ式のe-Bike Ranger Sを米国で発売すると発表しました。この取り組みは、環境に優しい通勤・通学の顧客層を取り込み、企業収益の増加に貢献すると期待されています。
米国のe-Bike市場レポートハイライト
- 推進タイプでは、スロットルアシストセグメントが予測期間中に最も高いCAGRを記録する見込みです。技術の進歩により、スロットルアシストe-Bikeの性能と航続距離が向上しています。より強力なモーター、より大容量のバッテリー、エネルギー効率の高いコンポーネントが、スロットルアシストe-Bikeの能力を向上させています。
- 駆動タイプでは、ベルト駆動セグメントが2023年から2030年にかけて最も高いCAGRを示すと予想されます。
- 用途別では、貨物セグメントが予測期間中に最も高いCAGRを示すと予想されます。これは、配送員にe-Bikeを提供するための企業の取り組みが成長していること、および物流業界にe-Bikeが組み込まれていることによります。
- バッテリーに関しては、リチウムイオンセグメントが予測期間中に最も高いCAGRを記録すると予想されます。これは、米国政府が電気自動車の導入を促進し、リチウムイオン電池の生産を増加させることで、排出量を削減するためにいくつかのイニシアチブを取っているためです。
- 最終用途別では、商業セグメントが予測期間中に最も高いCAGRを示すと予想されます。これは、e-Bikeの低速走行による事故リスクの低減、e-Bike導入のために米国政府が提供する規制やインセンティブによるものです。
目次
第1章 調査手法と範囲
- 市場セグメンテーションと範囲
- 市場の定義
- 情報調達
- 購入したデータベース
- GVRの内部データベース
- 二次情報と第三者の視点
- 一次調査
- 情報分析
- 市場の形成とデータの視覚化
- データの検証と公開
第2章 エグゼクティブサマリー
- 米国のe-Bike市場スナップショット、2022年と2030年
- 推進タイプセグメントのスナップショット、2022年および2030年
- 駆動タイプセグメントのスナップショット、2022年および2030年
- 用途セグメントのスナップショット、2022年と2030年
- バッテリーセグメントのスナップショット、2022年と2030年
- 最終用途セグメントのスナップショット、2022年と2030年
第3章 市場変数、動向、および範囲
- 市場系統の見通し
- 米国のe-Bike市場-バリューチェーン分析
- 米国のe-Bike市場力学
- 市場促進要因の分析
- 市場抑制要因分析
- 市場機会分析
- 米国のe-Bike産業分析-PESTLE
- 米国のe-Bike産業分析- ポーターの5つの力
第4章 米国のe-Bike市場:推進タイプの推定・動向分析
- 推進タイプの変動分析と市場シェア、2022年と2030年
- 市場規模、予測および動向分析、2018~2030年(百万米ドル、台数)
- ペダルアシスト
- スロットルアシスト
第5章 米国のe-Bike市場:駆動タイプの推定・動向分析
- 駆動タイプの変動分析と市場シェア、2022年と2030年
- 市場規模、予測および動向分析、2018~2030年(百万米ドル、台数)
- ベルト駆動
- チェーン駆動
第6章 米国のe-Bike市場:用途の推定・動向分析
- 用途の変動分析と市場シェア、2022年と2030年
- 市場規模、予測および動向分析、2018~2030年(百万米ドル、台数)
- 市/都市部
- トレッキング
- 貨物
- その他
第7章 米国のe-Bike市場:バッテリーの推定・動向分析
- バッテリーの変動分析と市場シェア、2022年と2030年
- 市場規模、予測および動向分析、2018~2030年(百万米ドル、台数)
第8章 米国のe-Bike市場:最終用途の推定・動向分析
- 最終用途の変動分析と市場シェア、2022年と2030年
- 市場規模、予測および動向分析、2018~2030年(百万米ドル、台数)
- 個人
- 商業
第9章 競合情勢
- 企業の分類
- 企業ヒートマップ分析
- 企業プロファイル(会社概要、業績、製品概要、戦略的取り組み)
- Trek Bicycle Corporation
- Aventon Bikes
- Rad Power Bikes, Inc.
- Lectric eBikes
- Blix Electric Bikes
- KHS Bicycles
- Rambo Bikes
- Juiced Bikes
- Ride1UP
- Cannondale
List of Tables
- Table 1 List of abbreviations
- Table 2 U.S. e-bikes market, 2018 - 2030 (USD Million)
- Table 3 U.S. e-bikes market, 2018 - 2030 (Units)
- Table 4 U.S. e-bikes market, by propulsion type, 2018 - 2030 (USD Million)
- Table 5 U.S. e-bikes market, by propulsion type, 2018 - 2030 (Units)
- Table 6 U.S. e-bikes market, by drive type, 2018 - 2030 (USD Million)
- Table 7 U.S. e-bikes market, by drive type, 2018 - 2030 (Units)
- Table 8 U.S. e-bikes market, by application, 2018 - 2030 (USD Million)
- Table 9 U.S. e-bikes market, by application, 2018 - 2030 (Units)
- Table 10 U.S. e-bikes market, by battery, 2018 - 2030 (USD Million)
- Table 11 U.S. e-bikes market, by battery, 2018 - 2030 (Units)
- Table 12 U.S. e-bikes market, by end-use, 2018 - 2030 (USD Million)
- Table 13 U.S. e-bikes market, by end-use, 2018 - 2030 (Units)
List of Figures
- Fig. 1 U.S. e-bikes market research methodology
- Fig. 2 U.S. e-bikes market data triangulation technique
- Fig. 3 U.S. e-bikes market primary research scope
- Fig. 4 U.S. e-bikes market: Market segmentation
- Fig. 5 U.S. e-bikes market: Market snapshot, 2022
- Fig. 6 U.S. e-bikes market: Value chain analysis
- Fig. 7 U.S. e-bikes market: Penetration and growth prospect mapping
- Fig. 8 U.S. e-bikes market: Key company analysis, 2022
- Fig. 9 U.S. e-bikes market: PESTLE analysis
- Fig. 10 U.S. e-bikes market: Porter's five forces analysis
- Fig. 11 U.S. e-bikes market: Product segment analysis, 2018 - 2030 (USD Million, Units)
- Fig. 12 U.S. e-bikes market: Vehicle type segment analysis, 2018 - 2030 (USD Million, Units)
U.S. E-bike Market Growth & Trends
The U.S. e-bike market size is expected to reach USD 7.16 billion by 2030, registering a CAGR of 15.6% during the forecast period, according to a new report by Grand View Research, Inc. The rise in sales of electric-bikes (e-bikes) in the U.S. is primarily attributed to the growth in the adoption of e-bikes during the COVID-19 pandemic outbreak as consumers chose alternative ways to get around. Also, the spike in gas prices and increasing awareness about opting for e-bikes for shorter and multiple commutes over a car are the factors anticipated to drive the market growth. In addition, the rising number of imported e-bikes and the growing number of local manufacturers helped the market to witness price reduction thereby, proving affordable deals to consumers. Thus, the market is expected to provide numerous growth opportunities to the stakeholders over the forecast period.
Furthermore, rising traffic congestion on the streets of the U.S. along with the growing number of government schemes provide substantial benefits to consumers. For instance, in March 2023, a bill, associated with the Electric Bike Incentive Kickstart for the Environment Act of the year 2021 was amended to enhance the adoption of e-bikes in the country. As per the new bill, the purchaser is poised to get a refundable tax credit of 30% up to USD 1,500 on the purchase of a new e-bike.
The rising interest of customers not only for recreation but also for daily transportation purposes enabled government officials to amend the original bill. Subsequently, the demand for e-bikes has grown significantly in the country. Moreover, several environmental and cycling advocacy groups such as PeopleForBikes, New Urban Mobility Alliance (NUMO), the League of American Bicyclists, CalBike, and Sierra Club among others have been supporting the government initiatives thereby creating awareness amongst the consumers regarding the benefits of utilizing e-bikes over the conventional transportation modes.
E-bikes for the commercial segment increasingly incorporate smart features to enhance functionality and connectivity. GPS tracking systems enable efficient fleet management, real-time monitoring of deliveries, and route optimization. Some e-bikes are equipped with integrated screens or connectivity options to provide riders with navigation, speed, distance traveled, and battery status information. These smart features improve operational efficiency and enable businesses to effectively track and manage their e-bike fleets.
Key players in the market are focused on strategies such as new product launches and partnerships to enhance their business operations and product offerings. For instance, in May 2023, a U.S.-based startup of e-bikes Heybike announced the launch of its fully foldable e-bike Ranger S in the U.S. which offers a smart LCD screen, Bluetooth, hydraulic front fork suspension, and several other features. The initiative is expected to help the company in capturing the environmental-friendly commuter customer base for increasing revenues.
U.S. E-bike Market Report Highlights
- In terms of propulsion type, the throttle-assisted segment is expected to witness the highest CAGR over the forecast period. Technological advancements have improved the performance and range of throttle-assisted e-bikes. More powerful motors, higher-capacity batteries, and energy-efficient components have increased the capabilities of throttle-assisted e-bikes
- In terms of drive type, the belt drive segment is expected to witness the highest CAGR from 2023 to 2030, owing to its advantages such as longer life, lightweight, and noise-free operation of e-bikes
- In terms of application, the cargo segment is expected to witness the highest CAGR over the forecast period, owing to growth in the initiatives undertaken by companies for providing e-bikes to delivery workers, and its inclusion in the logistics industry
- In terms of battery, the lithium-ion segment is expected to witness the highest CAGR during the forecast period. This is attributed to the several initiatives undertaken by the U.S. government for reducing emissions by promoting the adoption of electric vehicles and increasing the production of lithium-ion batteries
- In terms of end-use, the commercial segment is expected to witness the highest CAGR during the forecast period. This is attributed to the reduced risk of accidents due to lower speeds of e-bikes, and regulations and incentives offered by the U.S. government for the adoption of e-bikes
Table of Contents
Chapter 1 Methodology & Scope
- 1.1 Market Segmentation & Scope
- 1.2 Market Definition
- 1.3 Information Procurement
- 1.3.1 Purchased Database
- 1.3.2 GVR's Internal Database
- 1.3.3 Secondary Sources & Third-Party Perspectives
- 1.3.4 Primary Research
- 1.4 Information Analysis
- 1.5 Market Formulation & Data Visualization
- 1.6 Data Validating & Publishing
Chapter 2 Executive Summary
- 2.1 U.S. E-bikes Market Snapshot, 2022 & 2030
- 2.2 Propulsion Type Segment Snapshot, 2022 & 2030
- 2.3 Drive Type Segment Snapshot, 2022 & 2030
- 2.4 Application Segment Snapshot, 2022 & 2030
- 2.5 Battery Segment Snapshot, 2022 & 2030
- 2.6 End-Use Segment Snapshot, 2022 & 2030
Chapter 3 Market Variables, Trends, and Scope
- 3.1 Market Lineage Outlook
- 3.2 U.S. E-bikes Market - Value Chain Analysis
- 3.3 U.S. E-bikes Market Dynamics
- 3.3.1 Market Drivers Analysis
- 3.3.2 Market Restraint Analysis
- 3.3.2 Market Opportunities Analysis
- 3.4 U.S. E-bikes Industry Analysis - PESTLE
- 3.5 U.S. E-bikes Industry Analysis - Porter's Five Forces
Chapter 4 U.S. E-bikes Market: Propulsion Type Estimates & Trend Analysis
- 4.1 Propulsion Type Movement Analysis & Market Share, 2022 & 2030
- 4.2 Market Size & Forecasts and Trends Analysis, 2018 - 2030 (USD Million, Units)
- 4.2.1 Pedal-assisted
- 4.2.2 Throttle-assisted
Chapter 5 U.S. E-bikes Market: Drive Type Estimates & Trend Analysis
- 5.1 Drive Type Movement Analysis & Market Share, 2022 & 2030
- 5.2 Market Size & Forecasts and Trends Analysis, 2018 - 2030 (USD Million, Units)
- 5.2.1 Belt Drive
- 5.2.2 Chain Drive
Chapter 6 U.S. E-bikes Market: Application Estimates & Trend Analysis
- 6.1 Application Movement Analysis & Market Share, 2022 & 2030
- 6.2 Market Size & Forecasts and Trends Analysis, 2018 - 2030 (USD Million, Units)
- 6.2.1 City/Urban
- 6.2.2 Trekking
- 6.2.3 Cargo
- 6.2.4 Others
Chapter 7 U.S. E-bikes Market: Battery Estimates & Trend Analysis
- 7.1 Battery Movement Analysis & Market Share, 2022 & 2030
- 7.2 Market Size & Forecasts and Trends Analysis, 2018 - 2030 (USD Million, Units)
- 7.2.1 Belt Drive
- 7.2.2 Chain Drive
Chapter 8 U.S. E-bikes Market: End-Use Estimates & Trend Analysis
- 8.1 End-Use Movement Analysis & Market Share, 2022 & 2030
- 8.2 Market Size & Forecasts and Trends Analysis, 2018 - 2030 (USD Million, Units)
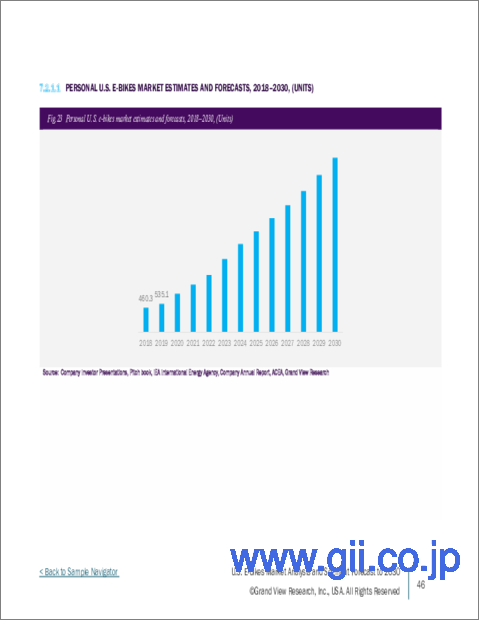
- 8.2.1 Personal
- 8.2.2 Commercial
Chapter 9 Competitive Landscape
- 9.1 Company Categorization
- 9.2 Company Heat Map Analysis
- 9.3 Company Profiles (Overview, Financial Performance, Product Overview, Strategic Initiatives)
- 9.3.1 Trek Bicycle Corporation
- 9.3.2 Aventon Bikes
- 9.3.3 Rad Power Bikes, Inc.
- 9.3.4 Lectric eBikes
- 9.3.5 Blix Electric Bikes
- 9.3.6 KHS Bicycles
- 9.3.7 Rambo Bikes
- 9.3.8 Juiced Bikes
- 9.3.9 Ride1UP
- 9.3.10 Cannondale
