|
|
市場調査レポート
商品コード
1301195
プロジェクト管理ソフトウェアの市場規模、シェア、動向分析レポート:コンポーネント別、ソリューション別、サービス別、企業規模別、展開別、最終用途別、地域別、セグメント予測、2023年~2030年Project Management Software Market Size, Share & Trends Analysis Report By Component, By Solution, By Services, By Enterprise Size, By Deployment, By End-use, By Region, And Segment Forecasts, 2023 - 2030 |
||||||
|
|
|||||||
カスタマイズ可能
|
|||||||


| プロジェクト管理ソフトウェアの市場規模、シェア、動向分析レポート:コンポーネント別、ソリューション別、サービス別、企業規模別、展開別、最終用途別、地域別、セグメント予測、2023年~2030年 |
|
出版日: 2023年06月02日
発行: Grand View Research
ページ情報: 英文 100 Pages
納期: 2~10営業日
|

- 全表示
- 概要
- 図表
- 目次
プロジェクト管理ソフトウェア市場の成長と動向
GrandView Research, Inc.の最新レポートによると、世界のプロジェクト管理ソフトウェア市場規模は、2023年から2030年にかけて15.7%のCAGRで拡大し、2030年には204億7,000万米ドルに達すると予測されています。
プロジェクト管理ソフトウェア産業の成長は、業務効率を高め、ビジネスの複雑さを最小限に抑えるために、組織プロジェクトのリアルタイム追跡&モニタリングに対する需要が増加していることに起因しています。さらに、IT&テレコム、製造業、BFSI、ヘルスケアなどの様々な最終用途産業におけるデジタル化の高まりは、予測期間中にプロジェクト管理ソフトウェア業界の需要を強化すると予想されます。
プロジェクト管理ソフトウェアは、プロジェクトの計画、スケジューリングプロセス、リソースの追跡、リアルタイムのステータス監視など、組織のプロセスを合理化するための包括的なソリューションを提供します。プロジェクト管理ソフトウェアは、重要なタスクの追跡と特定、リソースの割り当て、期限の設定、タイムラインの作成、プロジェクト・ステージの追跡などでユーザーを支援します。さらに、プロジェクト管理ソフトウェアの助けを借りて、チームメンバーは、特定のプロジェクトに関与するチームとの更新情報の共有とともに、自動化された通信を可能にするため、より高速でリモートで共同作業を行うことができます。これらすべての要因が、予測期間中のプロジェクト管理ソフトウェア産業の成長を促進すると予想されます。
大企業や中小企業などの企業は、プロジェクト能力を強化し、支出を削減し、多数の計画、プロジェクト、タスク、人々の全体的な効率を高めるための新しい方法を常に模索しています。プロジェクト管理ソフトウェアは、予測可能性、正確性、収益性を確保するために新しいプロジェクトを計画したり引き受けたりしている間、組織がすべてを整理しておくのに役立つ重要なソリューションの1つです。プロジェクト管理ソフトウェアにより、組織は、手作業で詳細を記録・管理する従来のパターンを排除し、デジタルでプロジェクトを実施することができます。そのため、柔軟性と操作性を維持しながら、時間、リソース、エラーを削減することができます。これらが、予測期間中にプロジェクト管理ソフトウェア業界を牽引すると予想される主な要因です。
プロジェクト管理ソフトウェア市場レポートハイライト
- サービス分野は、2023年から2030年にかけてCAGR 16.5%を記録すると予測されます。サポート&メンテナンス、統合&展開、コンサルティングなどのサービス需要は、組織におけるプロジェクト管理ソフトウェア製品およびサービスに対する需要の高まり別進化しています。
- リソース管理分野は、2023年から2030年にかけてCAGR 16.5%を記録すると予測されます。プロジェクト管理ソフトウェアは、従業員のパフォーマンスに関する最新情報の追跡、チームの割り当て、能力の把握、リアルタイムの運用データの収集別懸念事項の強調など、リソース管理を支援します。
- サポート&メンテナンス分野は、2023年から2030年にかけてCAGR 17.2%を記録すると予想されます。サポート&メンテナンスは、プロジェクト管理ソフトウェアの導入に伴って迅速に発生する問題や課題を解決するためのサービスを提供し、専門的な知識と技術の助けを借りて解決策を提供します。
- 中小企業セグメントは、2023年から2030年にかけてCAGR 17.3%で成長すると予測されます。プロジェクト管理ソフトウェアは、中小企業がタスクやプロジェクトをデジタル化してプロセスを合理化し、リアルタイムの更新を追跡し、組織内のリソースの効率性を確保するのに役立ちます。
- クラウド分野は、2023年から2030年にかけてCAGR 16.6%で成長すると予測されます。クラウドソフトウェアは、ユーザーがライセンスベースでこのソフトウェアにアクセスできるクラウドプラットフォーム上でプロジェクトを監視するために必要な高度なツールと技術を提供します。プロジェクトに関連するコミュニケーション、リソース、チームを統合することで、関連タスクやプロジェクトを効率化します。
- IT・通信分野は、2023年から2030年にかけてCAGR 17.4%で成長すると予測されます。プロジェクト管理ソフトウェアは、大規模プロジェクトの管理・監視、納期の追跡、割り当てられたプロジェクトをスケジュール内に確実に納品するためのソリューションをIT・通信業界に提供するため、IT・通信業界におけるプロジェクト管理ソフトウェアの需要が高まっています。
- アジア太平洋セグメントは、2023年から2030年にかけてCAGR 19.7%で成長すると予測されます。アジア太平洋地域では、製造、ヘルスケア、BFSIの各分野でデジタル技術の導入が急速に進んでいます。さらに、デジタル化とペーパーレス業務に向けた政府のイニシアティブの高まりは、プロジェクト管理ソフトウェア業界を強化すると予想されます。
目次
第1章 調査手法と範囲
- 調査手法の細分化と範囲
- 情報調達
- 購入したデータベース
- GVRの内部データベース
- 二次情報と第三者の視点
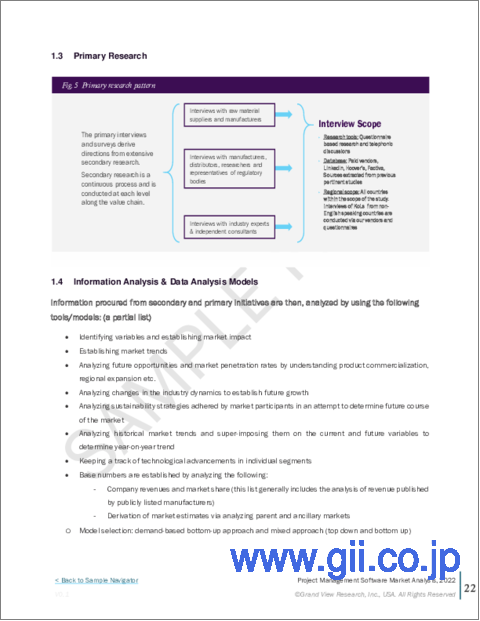
- 1次調査
- 情報分析
- データ分析モデル
- 市場形成とデータの可視化
- データの検証と公開
第2章 エグゼクティブサマリー
- プロジェクト管理ソフトウェア市場- 競争力のあるスナップショット
第3章 プロジェクト管理ソフトウェア市場の変数、動向、範囲
- 市場系統の見通し
- 業界のバリューチェーン分析
- 市場力学
- 市場促進要因の分析
- 市場抑制要因/課題の分析
- 市場機会分析
- ビジネス環境分析ツール
- ポーターのファイブフォース分析
- PEST分析
- COVID-19感染症の影響分析
第4章 プロジェクト管理ソフトウェア市場:コンポーネントの見通し
- プロジェクト管理ソフトウェアのコンポーネント別市場シェア、2022年および2030年
- ソリューション
- 市場規模の推定と予測、2018~2030年
- サービス
- 市場推計・予測、2018~2030年
第5章 プロジェクト管理ソフトウェア市場:ソリューションの展望
- プロジェクト管理ソフトウェアのソリューション別市場シェア、2022年および2030年
- アクティビティのスケジュール設定
- 市場規模の推定と予測、2018~2030年
- プロジェクトポートフォリオ管理
- 市場推計・予測、2018~2030年
- 資源管理
- 市場推計・予測、2018~2030年
- 問題追跡
- 市場推計・予測、2018~2030年
- 文書管理
- 市場推計・予測、2018~2030年
- その他
- 市場推計・予測、2018~2030年
第6章 プロジェクト管理ソフトウェア市場:サービスの展望
- プロジェクト管理ソフトウェアのサービス別市場シェア、2022年および2030年
- 統合と展開
- 市場規模の推定と予測、2018~2030年
- サポートとメンテナンス
- 市場推計・予測、2018~2030年
第7章 プロジェクト管理ソフトウェア市場:企業規模の見通し
- 企業規模別のプロジェクト管理ソフトウェア市場シェア、2022年および2030年
- 中小企業
- 市場規模の推定と予測、2018~2030年
- 大企業
- 市場推計・予測、2018~2030年
第8章 プロジェクト管理ソフトウェア市場:展開の見通し
- プロジェクト管理ソフトウェアの展開別市場シェア、2022年および2030年
- クラウド
- 市場規模の推定と予測、2018~2030年
- オンプレミス
- 市場推計・予測、2018~2030年
第9章 プロジェクト管理ソフトウェア市場:最終用途の見通し
- プロジェクト管理ソフトウェアの最終用途別市場シェア、2022年および2030年
- 製造業
- 市場規模の推定と予測、2018~2030年
- BFSI
- 市場推計・予測、2018~2030年
- IT&テレコム
- 市場規模の推定と予測、2018~2030年
- ヘルスケア
- 市場推計・予測、2018~2030年
- エンジニアリングと建設
- 市場推計・予測、2018~2030年
- 政府
- 市場推計・予測、2018~2030年
- その他
- 市場推計・予測、2018~2030年
第10章 プロジェクト管理ソフトウェア市場:地域別の展望
- プロジェクト管理ソフトウェアの地域別市場シェア、2022年および2030年
- 北米
- 市場推計・予測、2018~2030年
- コンポーネント別、2018~2030年
- ソリューション別、2018~2030年
- サービス別、2018~2030年
- 企業規模別、2018~2030年
- 展開別、2018~2030年
- 最終用途別、2018~2030年
- 米国
- カナダ
- 欧州
- 市場推計・予測、2018~2030年
- コンポーネント別、2018~2030年
- ソリューション別、2018~2030年
- サービス別、2018~2030年
- 企業規模別、2018~2030年
- 展開別、2018~2030年
- 最終用途別、2018~2030年
- 英国
- ドイツ
- フランス
- イタリア
- スペイン
- アジア太平洋地域
- 市場推計・予測、2018~2030年
- コンポーネント別、2018~2030年
- ソリューション別、2018~2030年
- サービス別、2018~2030年
- 企業規模別、2018~2030年
- 展開別、2018~2030年
- 最終用途別、2018~2030年
- 中国
- インド
- 日本
- オーストラリア
- 韓国
- ラテンアメリカ
- 市場推計・予測、2018~2030年
- コンポーネント別、2018~2030年
- ソリューション別、2018~2030年
- サービス別、2018~2030年
- 企業規模別、2018~2030年
- 展開別、2018~2030年
- 最終用途別、2018~2030年
- ブラジル
- メキシコ
- アルゼンチン
- 中東とアフリカ
- 市場推計・予測、2018~2030年
- コンポーネント別、2018~2030年
- ソリューション別、2018~2030年
- サービス別、2018~2030年
- 企業規模別、2018~2030年
- 展開別、2018~2030年
- 最終用途別、2018~2030年
- アラブ首長国連邦
- サウジアラビア
- 南アフリカ
第11章 競合情勢
- 企業の分類(成熟企業、新興企業)
- 企業シェア分析、2022
- ヒートマップ分析
- 戦略マッピング
- 企業プロファイル(会社概要、業績、製品概要、戦略的取り組み)
- Adobe Inc.
- Atlassian Corporation Plc
- Broadcom Inc.
- Microsoft Corporation
- Oracle Corporation
- Plainview, Inc.
- Planisware
- SAP SE
- ServiceNow
- Zoho Corporation Pvt. Ltd.
- Teamwork.com
- Smartsheet, inc.
- Asana Inc.
- Monday.com
- LiquidPlanner, inc.
List of Tables
- Table 1 List of Abbreviation
- Table 2 Global Project Management Software market, 2018 - 2030 (USD Billion)
- Table 3 Global Project Management Software market, by region, 2018 - 2030 (USD Billion)
- Table 4 Global Project Management Software market, by component, 2018 - 2030 (USD Billion)
- Table 5 Global Project Management Software market, by solution, 2018 - 2030 (USD Billion)
- Table 6 Global Project Management Software market, by services, 2018 - 2030 (USD Billion)
- Table 7 Global Project Management Software market, by enterprise size, 2018 - 2030 (USD Billion)
- Table 8 Global Project Management Software market, by deployment, 2018 - 2030 (USD Billion)
- Table 9 Global Project Management Software market, by end-use, 2018 - 2030 (USD Billion)
- Table 10 North America Project Management Software market, by component 2018 - 2030 (USD Billion)
- Table 11 North America Project Management Software market, by solution 2018 - 2030 (USD Billion)
- Table 12 North America Project Management Software market, by services 2018 - 2030 (USD Billion
- Table 13 North America Project Management Software market, by enterprise size 2018 - 2030 (USD Billion)
- Table 14 North America Project Management Software market, by deployment 2018 - 2030 (USD Billion)
- Table 15 North America Project Management Software market, by end-use 2018 - 2030 (USD Billion)
- Table 16 US Project Management Software market, by component 2018 - 2030 (USD Billion)
- Table 17 US Project Management Software market, by solution 2018 - 2030 (USD Billion)
- Table 18 US Project Management Software market, by services 2018 - 2030 (USD Billion
- Table 19 US Project Management Software market, by enterprise size 2018 - 2030 (USD Billion)
- Table 20 US Project Management Software market, by deployment 2018 - 2030 (USD Billion)
- Table 21 US Project Management Software market, by end-use 2018 - 2030 (USD Billion)
- Table 22 Canada Project Management Software market, by component 2018 - 2030 (USD Billion)
- Table 23 Canada Project Management Software market, by solution 2018 - 2030 (USD Billion)
- Table 24 Canada Project Management Software market, by services 2018 - 2030 (USD Billion
- Table 25 Canada Project Management Software market, by enterprise size 2018 - 2030 (USD Billion)
- Table 26 Canada Project Management Software market, by deployment 2018 - 2030 (USD Billion)
- Table 27 Canada Project Management Software market, by end-use 2018 - 2030 (USD Billion)
- Table 28 Europe Project Management Software market, by component 2018 - 2030 (USD Billion)
- Table 29 Europe Project Management Software market, by solution 2018 - 2030 (USD Billion)
- Table 30 Europe Project Management Software market, by services 2018 - 2030 (USD Billion
- Table 31 Europe Project Management Software market, by enterprise size 2018 - 2030 (USD Billion)
- Table 32 Europe Project Management Software market, by deployment 2018 - 2030 (USD Billion)
- Table 33 Europe Project Management Software market, by end-use 2018 - 2030 (USD Billion)
- Table 34 UK Project Management Software market, by component 2018 - 2030 (USD Billion)
- Table 35 UK Project Management Software market, by solution 2018 - 2030 (USD Billion)
- Table 36 UK Project Management Software market, by services 2018 - 2030 (USD Billion
- Table 37 UK Project Management Software market, by enterprise size 2018 - 2030 (USD Billion)
- Table 38 UK Project Management Software market, by deployment 2018 - 2030 (USD Billion)
- Table 39 UK Project Management Software market, by end-use 2018 - 2030 (USD Billion)
- Table 40 Germany Project Management Software market, by component 2018 - 2030 (USD Billion)
- Table 41 Germany Project Management Software market, by solution 2018 - 2030 (USD Billion)
- Table 42 Germany Project Management Software market, by services 2018 - 2030 (USD Billion
- Table 43 Germany Project Management Software market, by enterprise size 2018 - 2030 (USD Billion)
- Table 44 Germany Project Management Software market, by deployment 2018 - 2030 (USD Billion)
- Table 45 Germany Project Management Software market, by end-use 2018 - 2030 (USD Billion)
- Table 46 France Project Management Software market, by component 2018 - 2030 (USD Billion)
- Table 47 France Project Management Software market, by solution 2018 - 2030 (USD Billion)
- Table 48 France Project Management Software market, by services 2018 - 2030 (USD Billion
- Table 49 France Project Management Software market, by enterprise size 2018 - 2030 (USD Billion)
- Table 50 France Project Management Software market, by deployment 2018 - 2030 (USD Billion)
- Table 51 France Project Management Software market, by end-use 2018 - 2030 (USD Billion)
- Table 52 Italy Project Management Software market, by component 2018 - 2030 (USD Billion)
- Table 53 Italy Project Management Software market, by solution 2018 - 2030 (USD Billion)
- Table 54 Italy Project Management Software market, by services 2018 - 2030 (USD Billion
- Table 55 Italy Project Management Software market, by enterprise size 2018 - 2030 (USD Billion)
- Table 56 Italy Project Management Software market, by deployment 2018 - 2030 (USD Billion)
- Table 57 Italy Project Management Software market, by end-use 2018 - 2030 (USD Billion)
- Table 58 Spain Project Management Software market, by component 2018 - 2030 (USD Billion)
- Table 59 Spain Project Management Software market, by solution 2018 - 2030 (USD Billion)
- Table 60 Spain Project Management Software market, by services 2018 - 2030 (USD Billion
- Table 61 Spain Project Management Software market, by enterprise size 2018 - 2030 (USD Billion)
- Table 62 Spain Project Management Software market, by deployment 2018 - 2030 (USD Billion)
- Table 63 Spain Project Management Software market, by end-use 2018 - 2030 (USD Billion)
- Table 64 Asia Pacific Project Management Software market, by component 2018 - 2030 (USD Billion)
- Table 65 Asia Pacific Project Management Software market, by solution 2018 - 2030 (USD Billion)
- Table 66 Asia Pacific Project Management Software market, by services 2018 - 2030 (USD Billion
- Table 67 Asia Pacific Project Management Software market, by enterprise size 2018 - 2030 (USD Billion)
- Table 68 Asia Pacific Project Management Software market, by deployment 2018 - 2030 (USD Billion)
- Table 69 Asia Pacific Project Management Software market, by end-use 2018 - 2030 (USD Billion)
- Table 70 China Project Management Software market, by component 2018 - 2030 (USD Billion)
- Table 71 China Project Management Software market, by solution 2018 - 2030 (USD Billion)
- Table 72 China Project Management Software market, by services 2018 - 2030 (USD Billion
- Table 73 China Project Management Software market, by enterprise size 2018 - 2030 (USD Billion)
- Table 74 China Project Management Software market, by deployment 2018 - 2030 (USD Billion)
- Table 75 China Project Management Software market, by end-use 2018 - 2030 (USD Billion)
- Table 76 India Project Management Software market, by component 2018 - 2030 (USD Billion)
- Table 77 India Project Management Software market, by solution 2018 - 2030 (USD Billion)
- Table 78 India Project Management Software market, by services 2018 - 2030 (USD Billion
- Table 79 India Project Management Software market, by enterprise size 2018 - 2030 (USD Billion)
- Table 80 India Project Management Software market, by deployment 2018 - 2030 (USD Billion)
- Table 81 India Project Management Software market, by end-use 2018 - 2030 (USD Billion)
- Table 82 Japan Project Management Software market, by component 2018 - 2030 (USD Billion)
- Table 83 Japan Project Management Software market, by solution 2018 - 2030 (USD Billion)
- Table 84 Japan Project Management Software market, by services 2018 - 2030 (USD Billion
- Table 85 Japan Project Management Software market, by enterprise size 2018 - 2030 (USD Billion)
- Table 86 Japan Project Management Software market, by deployment 2018 - 2030 (USD Billion)
- Table 87 Japan Project Management Software market, by end-use 2018 - 2030 (USD Billion)
- Table 88 Australia Project Management Software market, by component 2018 - 2030 (USD Billion)
- Table 89 Australia Project Management Software market, by solution 2018 - 2030 (USD Billion)
- Table 90 Australia Project Management Software market, by services 2018 - 2030 (USD Billion
- Table 91 Australia Project Management Software market, by enterprise size 2018 - 2030 (USD Billion)
- Table 92 Australia Project Management Software market, by deployment 2018 - 2030 (USD Billion)
- Table 93 Australia Project Management Software market, by end-use 2018 - 2030 (USD Billion)
- Table 94 South Korea Project Management Software market, by component 2018 - 2030 (USD Billion)
- Table 95 South Korea Project Management Software market, by solution 2018 - 2030 (USD Billion)
- Table 96 South Korea Project Management Software market, by services 2018 - 2030 (USD Billion
- Table 97 South Korea Project Management Software market, by enterprise size 2018 - 2030 (USD Billion)
- Table 98 South Korea Project Management Software market, by deployment 2018 - 2030 (USD Billion)
- Table 99 South Korea Project Management Software market, by end-use 2018 - 2030 (USD Billion)
- Table 100 Latin America Project Management Software market, by component 2018 - 2030 (USD Billion)
- Table 101 Latin America Project Management Software market, by solution 2018 - 2030 (USD Billion)
- Table 102 Latin America Project Management Software market, by services 2018 - 2030 (USD Billion
- Table 103 Latin America Project Management Software market, by enterprise size 2018 - 2030 (USD Billion)
- Table 104 Latin America Project Management Software market, by deployment 2018 - 2030 (USD Billion)
- Table 105 Latin America Project Management Software market, by end-use 2018 - 2030 (USD Billion)
- Table 106 Brazil Project Management Software market, by component 2018 - 2030 (USD Billion)
- Table 107 Brazil Project Management Software market, by solution 2018 - 2030 (USD Billion)
- Table 108 Brazil Project Management Software market, by services 2018 - 2030 (USD Billion
- Table 109 Brazil Project Management Software market, by enterprise size 2018 - 2030 (USD Billion)
- Table 110 Brazil Project Management Software market, by deployment 2018 - 2030 (USD Billion)
- Table 111 Brazil Project Management Software market, by end-use 2018 - 2030 (USD Billion)
- Table 112 Mexico Project Management Software market, by component 2018 - 2030 (USD Billion)
- Table 113 Mexico Project Management Software market, by solution 2018 - 2030 (USD Billion)
- Table 114 Mexico Project Management Software market, by services 2018 - 2030 (USD Billion
- Table 115 Mexico Project Management Software market, by enterprise size 2018 - 2030 (USD Billion)
- Table 116 Mexico Project Management Software market, by deployment 2018 - 2030 (USD Billion)
- Table 117 Mexico Project Management Software market, by end-use 2018 - 2030 (USD Billion)
- Table 118 Argentina Project Management Software market, by component 2018 - 2030 (USD Billion)
- Table 119 Argentina Project Management Software market, by solution 2018 - 2030 (USD Billion)
- Table 120 Argentina Project Management Software market, by services 2018 - 2030 (USD Billion
- Table 121 Argentina Project Management Software market, by enterprise size 2018 - 2030 (USD Billion)
- Table 122 Argentina Project Management Software market, by deployment 2018 - 2030 (USD Billion)
- Table 123 Argentina Project Management Software market, by end-use 2018 - 2030 (USD Billion)
- Table 124 MEA Project Management Software market, by component 2018 - 2030 (USD Billion)
- Table 125 MEA Project Management Software market, by solution 2018 - 2030 (USD Billion)
- Table 126 MEA Project Management Software market, by services 2018 - 2030 (USD Billion
- Table 127 MEA Project Management Software market, by enterprise size 2018 - 2030 (USD Billion)
- Table 128 MEA Project Management Software market, by deployment 2018 - 2030 (USD Billion)
- Table 129 MEA Project Management Software market, by end-use 2018 - 2030 (USD Billion)
- Table 130 UAE Project Management Software market, by component 2018 - 2030 (USD Billion)
- Table 131 UAE Project Management Software market, by solution 2018 - 2030 (USD Billion)
- Table 132 UAE Project Management Software market, by services 2018 - 2030 (USD Billion
- Table 133 UAE Project Management Software market, by enterprise size 2018 - 2030 (USD Billion)
- Table 134 UAE Project Management Software market, by deployment 2018 - 2030 (USD Billion)
- Table 135 UAE Project Management Software market, by end-use 2018 - 2030 (USD Billion)
- Table 136 Saudi Arabia Project Management Software market, by component 2018 - 2030 (USD Billion)
- Table 137 Saudi Arabia Project Management Software market, by solution 2018 - 2030 (USD Billion)
- Table 138 Saudi Arabia Project Management Software market, by services 2018 - 2030 (USD Billion
- Table 139 Saudi Arabia Project Management Software market, by enterprise size 2018 - 2030 (USD Billion)
- Table 140 Saudi Arabia Project Management Software market, by deployment 2018 - 2030 (USD Billion)
- Table 141 Saudi Arabia Project Management Software market, by end-use 2018 - 2030 (USD Billion)
- Table 142 South Africa Project Management Software market, by component 2018 - 2030 (USD Billion)
- Table 143 South Africa Project Management Software market, by solution 2018 - 2030 (USD Billion)
- Table 144 South Africa Project Management Software market, by services 2018 - 2030 (USD Billion
- Table 145 South Africa Project Management Software market, by enterprise size 2018 - 2030 (USD Billion)
- Table 146 South Africa Project Management Software market, by deployment 2018 - 2030 (USD Billion)
- Table 147 South Africa Project Management Software market, by end-use 2018 - 2030 (USD Billion)
List of Figures
- Fig. 1 Project Management Software market segmentation
- Fig. 2 Methodology
- Fig. 3 Primary Research Pattern
- Fig. 4 Information analysis
- Fig. 5 Data Analysis Model
- Fig. 6 Data Validation & Publishing
- Fig. 7 Project Management Software: Market Snapshot
- Fig. 8 Project Management Software: Segment Snapshot
- Fig. 9 Project Management Software: Competitive Landscape Snapshot
- Fig. 10 Project Management Software Market Lineage Outlook
- Fig. 11 Project Management Software Market: Value chain analysis
- Fig. 12 Market driver analysis
- Fig. 13 Market restraint analysis
- Fig. 14 Market opportunity analysis
- Fig. 15 Project Management Software market: Porter's five forces analysis
- Fig. 16 Project Management Software Market: PEST analysis
- Fig. 17 Project Management Software Market: Component segment analysis
- Fig. 18 Project Management Software Market: Solution segment analysis
- Fig. 19 Project Management Software Market: Services segment analysis
- Fig. 20 Project Management Software Market: Enterprise size segment analysis
- Fig. 21 Project Management Software Market: Deployment segment analysis
- Fig. 22 Project Management Software Market: End-use segment analysis
Project Management Software Market Growth & Trends
The global project management software market size is expected to reach USD 20.47 billion by 2030, expanding at a CAGR of 15.7% from 2023 to 2030, according to the new report by Grand View Research, Inc. The growth of the project management software industry can be attributed to the increasing demand for real-time tracking & monitoring of organizational projects to enhance operational efficiency and minimize business complexities. Further, the rising digitization in various end-use industries such as IT & telecom, manufacturing, BFSI, and healthcare is expected to strengthen the project management software industry demand during the forecast period.
Project management software offers comprehensive solutions to streamline organizational processes, including project planning, scheduling process, tracking resources, and real-time status monitoring. Project management software assists users in tracking and identifying critical tasks, assigning resources, setting deadlines, creating timelines, and keeping track of project stages. Furthermore, with the help of project management software, team members can collaborate remotely at a higher speed as it enables automated communication along with sharing updates with the team involved in a specific project. All these factors are expected to fuel the growth of the project management software industry over the forecast period.
Businesses such as large and small organizations are constantly exploring new ways to enhance their project capabilities, reduce expenditures, and enhance the overall efficiency of numerous plans, projects, tasks, and people. Project management software is one of the key solutions helping organizations keep everything organized while planning or undertaking new projects to ensure predictability, accuracy, and profitability. Project management software enables organizations to undertake projects digitally by eliminating the traditional pattern of recording and managing details manually. Thus, it helps reduce time, resources, and errors while maintaining flexibility and ease of operation capabilities. These are the key factors expected to drive the project management software industry during the forecast period.
Project Management Software Market Report Highlights
- The services segment is expected to register a CAGR of 16.5% from 2023 to 2030. The demand for services such as support & maintenance, integration & deployment, and consulting is evolving owing to the rising demand for project management software products and services among organizations
- The resource management segment is expected to register a CAGR of 16.5% from 2023 to 2030. The project management software helps resource management by tracking updates on employee performance, allocation of teams, understanding their capacity, and highlighting the areas of concern by gathering real-time operational data
- The support & maintenance segment is expected to register a CAGR of 17.2% from 2023 to 2030. The support & maintenance offer services to resolve issues and challenges that quickly occur with project management software deployment and provide resolution with the help of expert knowledge and technologies
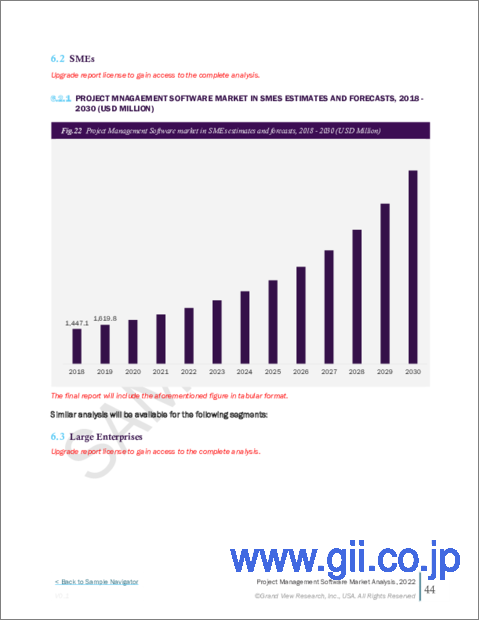
- The small & medium-sized enterprises segment is anticipated to grow at a CAGR of 17.3% from 2023 to 2030. Project management software helps small & medium enterprises in digitizing tasks and projects to streamline processes, track real-time updates, and ensure the efficiency of resources within the organization
- The cloud segment is anticipated to grow at a CAGR of 16.6% from 2023 to 2030. The cloud software offers advanced tools and techniques required to monitor projects on the cloud platforms where users can access this software on a license basis. It streamlines related tasks and projects by integrating communication, resources, and team associated with the project
- The IT & Telecommunication segment is anticipated to grow at a CAGR of 17.4% from 2023 to 2030. The demand for project management software in IT & Telecom is growing as it offers solutions to IT & Telecom industries in managing and monitoring large projects, tracking deadlines, and ensuring delivery of each assigned project within the timeline
- The Asia Pacific segment is anticipated to grow at a CAGR of 19.7% from 2023 to 2030. Asia Pacific is witnessing a rapid surge in the adoption of digital technologies across manufacturing, healthcare, and BFSI sectors. Further, the growing government initiatives towards digitization and paperless business operations are expected to strengthen the project management software industry
Table of Contents
Chapter 1. Methodology and Scope
- 1.1. Methodology Segmentation & Scope
- 1.2. Information procurement
- 1.2.1. Purchased database
- 1.2.2. GVR's internal database
- 1.2.3. Secondary sources & third-party perspectives
- 1.2.4. Primary research
- 1.3. Information analysis
- 1.3.1. Data analysis models
- 1.4. Market formulation & data visualization
- 1.5. Data validation & publishing
Chapter 2. Executive Summary
- 2.1. Project Management Software Market - Market Snapshot, 2018 - 2030
- 2.2. Project Management Software Market - Component Snapshot, 2018 - 2030
- 2.3. Project Management Software Market - Enterprise Size Snapshot, 2018 - 2030
- 2.4. Project Management Software Market - Deployment Snapshot, 2018 - 2030
- 2.5. Project Management Software Market - End-use Snapshot, 2018 - 2030
- 2.6. Project Management Software Market - Competitive Snapshot
Chapter 3. Project Management Software Market Variables, Trends & Scope
- 3.1. Market Lineage Outlook
- 3.2. Industry Value Chain Analysis
- 3.3. Market Dynamics
- 3.3.1. Market Driver Analysis
- 3.3.2. Market Restraint/Challenge Analysis
- 3.3.3. Market Opportunity Analysis
- 3.4. Business Environment Analysis Tools
- 3.4.1. Porter's Five Forces Analysis
- 3.4.2. PEST Analysis
- 3.5. COVID-19 Impact Analysis
Chapter 4. Project Management Software Market Component Outlook
- 4.1. Project Management Software Market Share by Component, 2022 & 2030 (USD Billion)
- 4.2. Solution
- 4.2.1. Market size estimates and forecasts, 2018 - 2030 (USD Billion)
- 4.3. Services
- 4.3.1. Market estimates and forecast, 2018 - 2030 (USD Billion)
Chapter 5. Project Management Software Market Solution Outlook
- 5.1. Project Management Software Market Share by Solution, 2022 & 2030 (USD Billion)
- 5.2. Activity Scheduling
- 5.2.1. Market size estimates and forecasts, 2018 - 2030 (USD Billion)
- 5.3. Project Portfolio Management
- 5.3.1. Market estimates and forecast, 2018 - 2030 (USD Billion)
- 5.4. Resource Management
- 5.4.1. Market estimates and forecast, 2018 - 2030 (USD Billion)
- 5.5. Issue Tracking
- 5.5.1. Market estimates and forecast, 2018 - 2030 (USD Billion)
- 5.6. Document Management
- 5.6.1. Market estimates and forecast, 2018 - 2030 (USD Billion)
- 5.7. Others
- 5.7.1. Market estimates and forecast, 2018 - 2030 (USD Billion)
Chapter 6. Project Management Software Market Services Outlook
- 6.1. Project Management Software Market Share by Services, 2022 & 2030 (USD Billion)
- 6.2. Integration & Deployment
- 6.2.1. Market size estimates and forecasts, 2018 - 2030 (USD Billion)
- 6.3. Support & Maintenance
- 6.3.1. Market estimates and forecast, 2018 - 2030 (USD Billion)
Chapter 7. Project Management Software Market Enterprise Size Outlook
- 7.1. Project Management Software Market Share by Deployment, 2022 & 2030 (USD Billion)
- 7.2. Small and medium-sized enterprises
- 7.2.1. Market size estimates and forecasts, 2018 - 2030 (USD Billion)
- 7.3. Large Enterprises
- 7.3.1. Market estimates and forecast, 2018 - 2030 (USD Billion)
Chapter 8. Project Management Software Market Deployment Outlook
- 8.1. Project Management Software Market Share by Deployment, 2022 & 2030 (USD Billion)
- 8.2. Cloud
- 8.2.1. Market size estimates and forecasts, 2018 - 2030 (USD Billion)
- 8.3. On-Premise
- 8.3.1. Market estimates and forecast, 2018 - 2030 (USD Billion)
Chapter 9. Project Management Software Market End-use Outlook
- 9.1. Project Management Software Market Share by End-use, 2022 & 2030 (USD Billion)
- 9.2. Manufacturing
- 9.2.1. Market size estimates and forecasts, 2018 - 2030 (USD Billion)
- 9.3. BFSI
- 9.3.1. Market estimates and forecast, 2018 - 2030 (USD Billion)
- 9.4. IT & Telecom
- 9.4.1. Market size estimates and forecasts, 2018 - 2030 (USD Billion)
- 9.5. Healthcare
- 9.5.1. Market estimates and forecast, 2018 - 2030 (USD Billion)
- 9.6. Engineering & Construction
- 9.6.1. Market estimates and forecast, 2018 - 2030 (USD Billion)
- 9.7. Government
- 9.7.1. Market estimates and forecast, 2018 - 2030 (USD Billion)
- 9.8. Others
- 9.8.1. Market estimates and forecast, 2018 - 2030 (USD Billion)
Chapter 10. Project Management Software Market: Regional Outlook
- 10.1. Project Management Software Market Share by Region, 2022 & 2030 (USD Billion)
- 10.2. North America
- 10.2.1. Market estimates and forecast, 2018 - 2030 (USD Billion)
- 10.2.2. Market estimates and forecast by component, 2018 - 2030 (USD Billion)
- 10.2.3. Market estimates and forecast by solution, 2018 - 2030 (USD Billion)
- 10.2.4. Market estimates and forecast by services, 2018 - 2030 (USD Billion)
- 10.2.5. Market estimates and forecast by enterprise size, 2018 - 2030 (USD Billion)
- 10.2.6. Market estimates and forecast by deployment, 2018 - 2030 (USD Billion)
- 10.2.7. Market estimates and forecast by end-use, 2018 - 2030 (USD Billion)
- 10.2.8. The U.S.
- 10.2.8.1. Market estimates and forecast, 2018 - 2030 (USD Billion)
- 10.2.8.2. Market estimates and forecast by component, 2018 - 2030 (USD Billion)
- 10.2.8.3. Market estimates and forecast by solution, 2018 - 2030 (USD Billion)
- 10.2.8.4. Market estimates and forecast by services, 2018 - 2030 (USD Billion)
- 10.2.8.5. Market estimates and forecast by enterprise size, 2018 - 2030 (USD Billion)
- 10.2.8.6. Market estimates and forecast by deployment, 2018 - 2030 (USD Billion)
- 10.2.8.7. Market estimates and forecast by end-use, 2018 - 2030 (USD Billion)
- 10.2.9. Canada
- 10.2.9.1. Market estimates and forecast, 2018 - 2030 (USD Billion)
- 10.2.9.2. Market estimates and forecast by component, 2018 - 2030 (USD Billion)
- 10.2.9.3. Market estimates and forecast by solution, 2018 - 2030 (USD Billion)
- 10.2.9.4. Market estimates and forecast by services, 2018 - 2030 (USD Billion)
- 10.2.9.5. Market estimates and forecast by enterprise size, 2018 - 2030 (USD Billion)
- 10.2.9.6. Market estimates and forecast by deployment, 2018 - 2030 (USD Billion)
- 10.2.9.7. Market estimates and forecast by end-use, 2018 - 2030 (USD Billion)
- 10.3. Europe
- 10.3.1. Market estimates and forecast, 2018 - 2030 (USD Billion)
- 10.3.2. Market estimates and forecast by component, 2018 - 2030 (USD Billion)
- 10.3.3. Market estimates and forecast by solution, 2018 - 2030 (USD Billion)
- 10.3.4. Market estimates and forecast by services, 2018 - 2030 (USD Billion)
- 10.3.5. Market estimates and forecast by enterprise size, 2018 - 2030 (USD Billion)
- 10.3.6. Market estimates and forecast by deployment, 2018 - 2030 (USD Billion)
- 10.3.7. Market estimates and forecast by end-use, 2018 - 2030 (USD Billion)
- 10.3.8. UK
- 10.3.8.1. Market estimates and forecast, 2018 - 2030 (USD Billion)
- 10.3.8.2. Market estimates and forecast by component, 2018 - 2030 (USD Billion)
- 10.3.8.3. Market estimates and forecast by solution, 2018 - 2030 (USD Billion)
- 10.3.8.4. Market estimates and forecast by services, 2018 - 2030 (USD Billion)
- 10.3.8.5. Market estimates and forecast by enterprise size, 2018 - 2030 (USD Billion)
- 10.3.8.6. Market estimates and forecast by deployment, 2018 - 2030 (USD Billion)
- 10.3.8.7. Market estimates and forecast by end-use, 2018 - 2030 (USD Billion)
- 10.3.9. Germany
- 10.3.9.1. Market estimates and forecast, 2018 - 2030 (USD Billion)
- 10.3.9.2. Market estimates and forecast by component, 2018 - 2030 (USD Billion)
- 10.3.9.3. Market estimates and forecast by solution, 2018 - 2030 (USD Billion)
- 10.3.9.4. Market estimates and forecast by services, 2018 - 2030 (USD Billion)
- 10.3.9.5. Market estimates and forecast by enterprise size, 2018 - 2030 (USD Billion)
- 10.3.9.6. Market estimates and forecast by deployment, 2018 - 2030 (USD Billion)
- 10.3.9.7. Market estimates and forecast by end-use, 2018 - 2030 (USD Billion)
- 10.3.10. France
- 10.3.10.1. Market estimates and forecast, 2018 - 2030 (USD Billion)
- 10.3.10.2. Market estimates and forecast by component, 2018 - 2030 (USD Billion)
- 10.3.10.3. Market estimates and forecast by solution, 2018 - 2030 (USD Billion)
- 10.3.10.4. Market estimates and forecast by services, 2018 - 2030 (USD Billion)
- 10.3.10.5. Market estimates and forecast by enterprise size, 2018 - 2030 (USD Billion)
- 10.3.10.6. Market estimates and forecast by deployment, 2018 - 2030 (USD Billion)
- 10.3.10.7. Market estimates and forecast by end-use, 2018 - 2030 (USD Billion)
- 10.3.11. Italy
- 10.3.11.1. Market estimates and forecast, 2018 - 2030 (USD Billion)
- 10.3.11.2. Market estimates and forecast by component, 2018 - 2030 (USD Billion)
- 10.3.11.3. Market estimates and forecast by solution, 2018 - 2030 (USD Billion)
- 10.3.11.4. Market estimates and forecast by services, 2018 - 2030 (USD Billion)
- 10.3.11.5. Market estimates and forecast by enterprise size, 2018 - 2030 (USD Billion)
- 10.3.11.6. Market estimates and forecast by deployment, 2018 - 2030 (USD Billion)
- 10.3.11.7. Market estimates and forecast by end-use, 2018 - 2030 (USD Billion)
- 10.3.12. Spain
- 10.3.12.1. Market estimates and forecast, 2018 - 2030 (USD Billion)
- 10.3.12.2. Market estimates and forecast by component, 2018 - 2030 (USD Billion)
- 10.3.12.3. Market estimates and forecast by solution, 2018 - 2030 (USD Billion)
- 10.3.12.4. Market estimates and forecast by services, 2018 - 2030 (USD Billion)
- 10.3.12.5. Market estimates and forecast by enterprise size, 2018 - 2030 (USD Billion)
- 10.3.12.6. Market estimates and forecast by deployment, 2018 - 2030 (USD Billion)
- 10.3.12.7. Market estimates and forecast by end-use, 2018 - 2030 (USD Billion)
- 10.4. Asia Pacific
- 10.4.1. Market estimates and forecast, 2018 - 2030 (USD Billion)
- 10.4.2. Market estimates and forecast by component, 2018 - 2030 (USD Billion)
- 10.4.3. Market estimates and forecast by solution, 2018 - 2030 (USD Billion)
- 10.4.4. Market estimates and forecast by services, 2018 - 2030 (USD Billion)
- 10.4.5. Market estimates and forecast by enterprise size, 2018 - 2030 (USD Billion)
- 10.4.6. Market estimates and forecast by deployment, 2018 - 2030 (USD Billion)
- 10.4.7. Market estimates and forecast by end-use, 2018 - 2030 (USD Billion)
- 10.4.8. China
- 10.4.8.1. Market estimates and forecast, 2018 - 2030 (USD Billion)
- 10.4.8.2. Market estimates and forecast by component, 2018 - 2030 (USD Billion)
- 10.4.8.3. Market estimates and forecast by solution, 2018 - 2030 (USD Billion)
- 10.4.8.4. Market estimates and forecast by services, 2018 - 2030 (USD Billion)
- 10.4.8.5. Market estimates and forecast by enterprise size, 2018 - 2030 (USD Billion)
- 10.4.8.6. Market estimates and forecast by deployment, 2018 - 2030 (USD Billion)
- 10.4.8.7. Market estimates and forecast by end-use, 2018 - 2030 (USD Billion)
- 10.4.9. India
- 10.4.9.1. Market estimates and forecast, 2018 - 2030 (USD Billion)
- 10.4.9.2. Market estimates and forecast by component, 2018 - 2030 (USD Billion)
- 10.4.9.3. Market estimates and forecast by solution, 2018 - 2030 (USD Billion)
- 10.4.9.4. Market estimates and forecast by services, 2018 - 2030 (USD Billion)
- 10.4.9.5. Market estimates and forecast by enterprise size, 2018 - 2030 (USD Billion)
- 10.4.9.6. Market estimates and forecast by deployment, 2018 - 2030 (USD Billion)
- 10.4.9.7. Market estimates and forecast by end-use, 2018 - 2030 (USD Billion)
- 10.4.10. Japan
- 10.4.10.1. Market estimates and forecast, 2018 - 2030 (USD Billion)
- 10.4.10.2. Market estimates and forecast by component, 2018 - 2030 (USD Billion)
- 10.4.10.3. Market estimates and forecast by solution, 2018 - 2030 (USD Billion)
- 10.4.10.4. Market estimates and forecast by services, 2018 - 2030 (USD Billion)
- 10.4.10.5. Market estimates and forecast by enterprise size, 2018 - 2030 (USD Billion)
- 10.4.10.6. Market estimates and forecast by deployment, 2018 - 2030 (USD Billion)
- 10.4.10.7. Market estimates and forecast by end-use, 2018 - 2030 (USD Billion)
- 10.4.11. Australia
- 10.4.11.1. Market estimates and forecast, 2018 - 2030 (USD Billion)
- 10.4.11.2. Market estimates and forecast by component, 2018 - 2030 (USD Billion)
- 10.4.11.3. Market estimates and forecast by solution, 2018 - 2030 (USD Billion)
- 10.4.11.4. Market estimates and forecast by services, 2018 - 2030 (USD Billion)
- 10.4.11.5. Market estimates and forecast by enterprise size, 2018 - 2030 (USD Billion)
- 10.4.11.6. Market estimates and forecast by deployment, 2018 - 2030 (USD Billion)
- 10.4.11.7. Market estimates and forecast by end-use, 2018 - 2030 (USD Billion)
- 10.4.12. South Korea
- 10.4.12.1. Market estimates and forecast, 2018 - 2030 (USD Billion)
- 10.4.12.2. Market estimates and forecast by component, 2018 - 2030 (USD Billion)
- 10.4.12.3. Market estimates and forecast by solution, 2018 - 2030 (USD Billion)
- 10.4.12.4. Market estimates and forecast by services, 2018 - 2030 (USD Billion)
- 10.4.12.5. Market estimates and forecast by enterprise size, 2018 - 2030 (USD Billion)
- 10.4.12.6. Market estimates and forecast by deployment, 2018 - 2030 (USD Billion)
- 10.4.12.7. Market estimates and forecast by end-use, 2018 - 2030 (USD Billion)
- 10.5. Latin America
- 10.5.1. Market estimates and forecast, 2018 - 2030 (USD Billion)
- 10.5.2. Market estimates and forecast by component, 2018 - 2030 (USD Billion)
- 10.5.3. Market estimates and forecast by solution, 2018 - 2030 (USD Billion)
- 10.5.4. Market estimates and forecast by services, 2018 - 2030 (USD Billion)
- 10.5.5. Market estimates and forecast by enterprise size, 2018 - 2030 (USD Billion)
- 10.5.6. Market estimates and forecast by deployment, 2018 - 2030 (USD Billion)
- 10.5.7. Market estimates and forecast by end-use, 2018 - 2030 (USD Billion)
- 10.5.8. Brazil
- 10.5.8.1. Market estimates and forecast, 2018 - 2030 (USD Billion)
- 10.5.8.2. Market estimates and forecast by component, 2018 - 2030 (USD Billion)
- 10.5.8.3. Market estimates and forecast by solution, 2018 - 2030 (USD Billion)
- 10.5.8.4. Market estimates and forecast by services, 2018 - 2030 (USD Billion)
- 10.5.8.5. Market estimates and forecast by enterprise size, 2018 - 2030 (USD Billion)
- 10.5.8.6. Market estimates and forecast by deployment, 2018 - 2030 (USD Billion)
- 10.5.8.7. Market estimates and forecast by end-use, 2018 - 2030 (USD Billion)
- 10.5.9. Mexico
- 10.5.9.1. Market estimates and forecast, 2018 - 2030 (USD Billion)
- 10.5.9.2. Market estimates and forecast by component, 2018 - 2030 (USD Billion)
- 10.5.9.3. Market estimates and forecast by solution, 2018 - 2030 (USD Billion)
- 10.5.9.4. Market estimates and forecast by services, 2018 - 2030 (USD Billion)
- 10.5.9.5. Market estimates and forecast by enterprise size, 2018 - 2030 (USD Billion)
- 10.5.9.6. Market estimates and forecast by deployment, 2018 - 2030 (USD Billion)
- 10.5.9.7. Market estimates and forecast by end-use, 2018 - 2030 (USD Billion)
- 10.5.10. Argentina
- 10.5.10.1. Market estimates and forecast, 2018 - 2030 (USD Billion)
- 10.5.10.2. Market estimates and forecast by component, 2018 - 2030 (USD Billion)
- 10.5.10.3. Market estimates and forecast by solution, 2018 - 2030 (USD Billion)
- 10.5.10.4. Market estimates and forecast by services, 2018 - 2030 (USD Billion)
- 10.5.10.5. Market estimates and forecast by enterprise size, 2018 - 2030 (USD Billion)
- 10.5.10.6. Market estimates and forecast by deployment, 2018 - 2030 (USD Billion)
- 10.5.10.7. Market estimates and forecast by end-use, 2018 - 2030 (USD Billion)
- 10.6. Middle East & Africa
- 10.6.1. Market estimates and forecast, 2018 - 2030 (USD Billion)
- 10.6.2. Market estimates and forecast by component, 2018 - 2030 (USD Billion)
- 10.6.3. Market estimates and forecast by solution, 2018 - 2030 (USD Billion)
- 10.6.4. Market estimates and forecast by services, 2018 - 2030 (USD Billion)
- 10.6.5. Market estimates and forecast by enterprise size, 2018 - 2030 (USD Billion)
- 10.6.6. Market estimates and forecast by deployment, 2018 - 2030 (USD Billion)
- 10.6.7. Market estimates and forecast by end-use, 2018 - 2030 (USD Billion)
- 10.6.8. UAE
- 10.6.8.1. Market estimates and forecast, 2018 - 2030 (USD Billion)
- 10.6.8.2. Market estimates and forecast by component, 2018 - 2030 (USD Billion)
- 10.6.8.3. Market estimates and forecast by solution, 2018 - 2030 (USD Billion)
- 10.6.8.4. Market estimates and forecast by services, 2018 - 2030 (USD Billion)
- 10.6.8.5. Market estimates and forecast by enterprise size, 2018 - 2030 (USD Billion)
- 10.6.8.6. Market estimates and forecast by deployment, 2018 - 2030 (USD Billion)
- 10.6.8.7. Market estimates and forecast by end-use, 2018 - 2030 (USD Billion)
- 10.6.9. Saudi Arabia
- 10.6.9.1. Market estimates and forecast, 2018 - 2030 (USD Billion)
- 10.6.9.2. Market estimates and forecast by component, 2018 - 2030 (USD Billion)
- 10.6.9.3. Market estimates and forecast by solution, 2018 - 2030 (USD Billion)
- 10.6.9.4. Market estimates and forecast by services, 2018 - 2030 (USD Billion)
- 10.6.9.5. Market estimates and forecast by enterprise size, 2018 - 2030 (USD Billion)
- 10.6.9.6. Market estimates and forecast by deployment, 2018 - 2030 (USD Billion)
- 10.6.9.7. Market estimates and forecast by end-use, 2018 - 2030 (USD Billion)
- 10.6.10. South Africa
- 10.6.10.1. Market estimates and forecast, 2018 - 2030 (USD Billion)
- 10.6.10.2. Market estimates and forecast by component, 2018 - 2030 (USD Billion)
- 10.6.10.3. Market estimates and forecast by solution, 2018 - 2030 (USD Billion)
- 10.6.10.4. Market estimates and forecast by services, 2018 - 2030 (USD Billion)
- 10.6.10.5. Market estimates and forecast by enterprise size, 2018 - 2030 (USD Billion)
- 10.6.10.6. Market estimates and forecast by deployment, 2018 - 2030 (USD Billion)
- 10.6.10.7. Market estimates and forecast by end-use, 2018 - 2030 (USD Billion)
Chapter 11. Competitive Landscape
- 11.1. Company Categorization (Mature Players, Emerging Players)
- 11.2. Company Share Analysis, 2022
- 11.3. Heat Map Analysis
- 11.4. Strategy Mapping
- 11.5. Company Profiles (Overview, Financial Performance, Product Overview, Strategic Initiatives)
- 11.5.1. Adobe Inc.
- 11.5.2. Atlassian Corporation Plc
- 11.5.3. Broadcom Inc.
- 11.5.4. Microsoft Corporation
- 11.5.5. Oracle Corporation
- 11.5.6. Plainview, Inc.
- 11.5.7. Planisware
- 11.5.8. SAP SE
- 11.5.9. ServiceNow
- 11.5.10. Zoho Corporation Pvt. Ltd.
- 11.5.11. Teamwork.com
- 11.5.12. Smartsheet, inc.
- 11.5.13. Asana Inc.
- 11.5.14. Monday.com
- 11.5.15. LiquidPlanner, inc.