|
|
市場調査レポート
商品コード
1908694
生分解性プラスチック市場規模、シェア及び動向分析レポート:製品別、最終用途別、地域別、セグメント別予測(2026~2033年)Biodegradable Plastic Market Size, Share & Trends Analysis Report By Product (Starch Blends, Polylactic Acid, Polybutylene adipate-co-terephthalate, PBS, PHA), By End Use, By Region, And Segment Forecasts, 2026 - 2033 |
||||||
|
|||||||
カスタマイズ可能
|
|||||||

| 生分解性プラスチック市場規模、シェア及び動向分析レポート:製品別、最終用途別、地域別、セグメント別予測(2026~2033年) |
|
出版日: 2025年12月09日
発行: Grand View Research
ページ情報: 英文 120 Pages
納期: 2~10営業日
|

概要
生分解性プラスチック市場サマリー
世界の生分解性プラスチック市場の規模は、2025年に102億6,000万米ドルと推定され、2033年までに248億6,000万米ドルに達すると予測されています。
2026~2033年にかけては、CAGR11.1%で成長すると見込まれています。フレキシブルエレクトロニクスの進歩とナノ材料の統合により、スマートテキスタイルポリマーの性能と信頼性が向上し、実世界での応用により適したものとなっています。
この技術的進歩により、スポーツウェア、防衛、医療など様々な分野での採用が促進されています。ウェアラブルシステム向けに導電性、センシング機能、耐久性を兼ね備えたポリマーへの投資が集中しています。システムインテグレーターが医療、スポーツ、産業安全向けにeテキスタイルを採用するにつれ、市場予測では二桁の堅調な成長が見込まれています。モジュール設計とスケーラブルな印刷プロセスにより、ポリマーを活用した新しい衣料品の市場投入までの時間が短縮されています。これにより、材料サプライヤーとエレクトロニクスインテグレーター間の統合が進んでいます。
よくあるご質問
目次
第1章 調査手法と範囲
第2章 エグゼクティブサマリー
第3章 生分解性プラスチック市場の変数、動向及び範囲
- 市場系統展望
- 親市場の展望
- 浸透率と成長見通しのマッピング
- 業界バリューチェーン分析
- 主要バリューチェーン参加者の利益率分析
- 原材料の動向
- 原材料価格分析
- 技術概要
- 商業生産技術
- 技術進歩のロードマップ(2021~2030年)
- 持続可能性の動向
- リサイクルと循環型経済
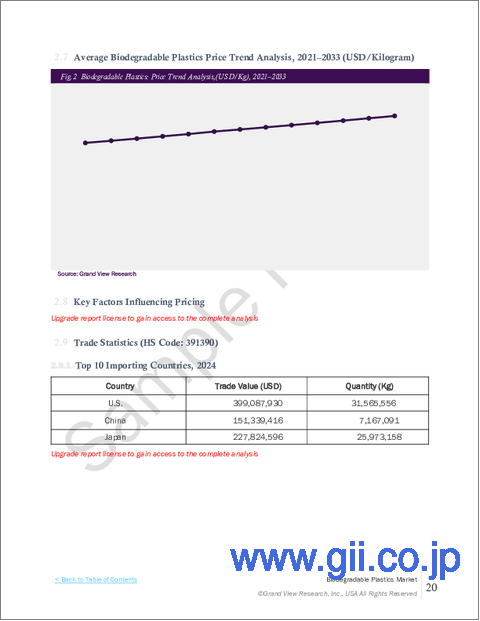
- 平均価格動向分析(2021~2030年)
- 価格設定に影響を与える主な要因
- 需給ギャップ分析
- 規制の枠組み
- 政策およびインセンティブ計画
- 基準とコンプライアンス
- 規制影響分析
- 市場力学
- ポーターのファイブフォース分析
- PESTEL分析
- 政治的環境
- 経済環境
- 社会的環境
- 技術的環境
- 環境的状況
- 法的環境
第4章 生分解性プラスチック市場:製品別推定・予測
- 生分解性プラスチック市場:製品別変動分析、2025年および2033年
- デンプン系
- PLA
- PBAT
- PBS
- PHA
- その他
第5章 生分解性プラスチック市場:最終用途別推定・予測
- 生分解性プラスチック市場:最終用途変動分析、2025年および2033年
- 包装
- 農業
- 繊維
- 消費財
- その他
第6章 生分解性プラスチック市場:地域別推定・予測
- 地域別概況
- 生分解性プラスチック市場:地域別変動分析、2025年および2033年
- 北米
- 市場推計・予測(2021~2033年)
- 最終用途別市場推計・予測(2021~2033年)
- 製品別市場推計・予測(2021~2033年)
- 米国
- カナダ
- メキシコ
- 欧州
- 市場推計・予測(2021~2033年)
- 最終用途別市場推計・予測(2021~2033年)
- 製品別市場推計・予測(2021~2033年)
- 英国
- ドイツ
- フランス
- イタリア
- スペイン
- アジア太平洋
- 市場推計・予測、2021~2033年
- 最終用途別市場推計・予測(2021~2033年)
- 製品別市場推計・予測(2021~2033年)
- 中国
- インド
- 日本
- 韓国
- ラテンアメリカ
- 市場推計・予測(2021~2033年)
- 最終用途別市場推計・予測(2021~2033年)
- 製品別市場推計・予測(2021~2033年)
- ブラジル
- アルゼンチン
- 中東・アフリカ
- 市場推計・予測(2021~2033年)
- 最終用途別市場推計・予測(2021~2033年)
- 製品別市場推計・予測(2021~2033年)
- サウジアラビア
- 南アフリカ
- アラブ首長国連邦
第7章 競合情勢
- 主要市場参入企業別の最近の動向と影響分析
- ベンダー情勢
- 企業分類
- 主要ディストリビューターおよびチャネルパートナー一覧
- 潜在顧客/エンドユーザー一覧
- 競争力分析
- 企業シェア分析及び市場ポジショニング
- 競合ベンチマーキング
- 戦略マッピング
- ヒートマップ分析
- 企業プロファイル/リスト
- Cargill Incorporated
- PTT MCC Biochem Co., Ltd.
- Biome Technologies plc
- Plantic Technologies Limited
- BASF SE
- Total Corbion PLA
- NatureWorks LLC
- Eastman Chemical Company
- Trineso
- Danimer Scientific

