|
|
市場調査レポート
商品コード
1233226
ライフサイエンスツールの市場規模、シェア、動向分析レポート技術別(細胞生物学、プロテオミクス)、製品別、エンドユース別(政府・学術、ヘルスケア)、地域別、セグメント別予測、2023~2030年Life Science Tools Market Size, Share & Trends Analysis Report By Technology (Cell Biology, Proteomics), By Product, By End-use (Government & Academic, Healthcare), By Region, And Segment Forecasts, 2023 - 2030 |
||||||
|
|
|||||||
|
● お客様のご希望に応じて、既存データの加工や未掲載情報(例:国別セグメント)の追加などの対応が可能です。 詳細はお問い合わせください。 |
|||||||


| ライフサイエンスツールの市場規模、シェア、動向分析レポート技術別(細胞生物学、プロテオミクス)、製品別、エンドユース別(政府・学術、ヘルスケア)、地域別、セグメント別予測、2023~2030年 |
|
出版日: 2023年02月22日
発行: Grand View Research
ページ情報: 英文 265 Pages
納期: 2~10営業日
|
- 全表示
- 概要
- 図表
- 目次
ライフサイエンスツール市場の成長・動向
Grand View Research, Inc.の新しいレポートによると、世界のライフサイエンスツール市場規模は、2023年から2030年にかけてCAGR10.8%で拡大し、2030年には3306億9000万米ドルに達すると予想されています。
この成長は、ライフサイエンス技術に対する政府資金の増加、細胞・遺伝子治療への需要、バイオ医薬品の採用増加、市場における著名企業間の競合の激化などに起因しています。
COVID-19感染者の世界の急増は、感染症の拡大を抑制するために迅速な診断を必要とし、これがパンデミック時のライフサイエンスツールの需要を押し上げ、市場に好影響を与えました。COVID-19パンデミック時の症例管理には、感染症の迅速な診断、効果的な治療法、予防計画が不可欠です。現在、SARS-CoV-2感染を確認するための費用対効果の高い接触点検査キットと効率的な調査手法の開発競争が、診断イノベーションの新たなフロンティアを牽引しています。このパンデミックの間、米国FDAはいくつかの診断テストに緊急使用許可(EUA)を付与し、迅速かつ容易に使用できるようにしました。例えば、2022年5月、米国FDAは、Abbott Diagnostics Scarborough, Inc.の迅速体外診断検査であるID NOW COVID-19 2.0に対してEUAを付与しました。さらに、市販のCOVID-19検査薬が幅広く販売されており、これが収益にさらに貢献することになります。
さらに、ライフサイエンスツール業界は、研究や技術の進歩のための政府による投資の増加に基づいて拡大しています。国立ヒトゲノム研究所(NHGRI)や国立衛生研究所(NIH)などの組織は、さまざまなライフサイエンス・プロジェクトに積極的に資金援助を行っています。例えば、NIHは「4D Nucleome Program」に2,500万米ドルの資金を提供し、核組織による遺伝子制御と細胞発現を理解することを目的としています。さらに、米国政府は、研究開発目的のために、いくつかのライフサイエンス企業に資金を提供しています。例えば、Biomedical Advanced Research and Development Authority(BARDA)は、ヘルスケア分野における革新的な技術の開発を促進するために、75万米ドル相当の賞を授与することを計画しています。このように、技術だけでなくライフサイエンス研究に対する政府の資金援助の増加は、今後数年間、市場を牽引すると予想されます。
また、主要企業は、先進的なツールや技術を提供することで、市場の成長に寄与しています。さらに、各社は新しい自動化ソリューションを市場に投入しており、それが市場成長の有利な機会となっています。例えば、2022年2月、Covaris, LLC.は、必要なアクセサリー、消耗品、試薬をすべて含む完全自動化ワークフロー、truXTRAC FFPE Total NA Auto 96 Kitの発売を発表しました。この自動化キットは、Adaptive Focused Acoustics(AFA)技術を搭載しており、FFPE(ホルマリン固定パラフィン包埋)サンプルのRNA&DNAの精製と抽出の両方を5時間で行うことができます。革新的なソリューションのイントロダクションが、近い将来、市場を牽引することが期待されます。
ライフサイエンスツール市場のレポートハイライト
- 技術別では、2022年に細胞生物学技術が最大のシェアを占めました。幹細胞、CAR T細胞、TCR T細胞、NK T細胞、その他細胞療法の使用と採用のための新規技術の導入が、このセグメントの収益生成を促進すると予想されます。
- 製品別では、細胞培養システムおよび3D細胞培養分野が2022年に最大のシェアを占めました。細胞生物学はライフサイエンス業界において多方面から人気を集めており、この分野が生み出す収益に大きく寄与しています。
- 最終用途別では、ヘルスケア分野が2022年に最も高い収益を生み出しました。臨床的に現れるいくつかの異常の治療や診断のために、クリニック、病院、診断ラボでプロテオミクスやゲノムのワークフローを採用するケースが増加しており、市場を牽引すると予想されます。
- 2022年、北米が最大の収益シェアを占めました。この地域では、ゲノミクス、プロテオミクス、腫瘍学、診断スクリーニングの急速な導入が地域の成長に寄与しています。また、多くの大手市場関係者がこの地域でライフサイエンス研究のための先進ツールの開発に継続的に取り組んでいます。
- アジア太平洋地域は、予測期間中に最も高い成長率を示すと予想されています。未開拓の道と有利な機会を利用するために、この地域の世界企業別投資が、この地域の市場を牽引しています。
目次
第1章 調査手法と範囲
- 調査手法
- 調査の仮定
- 情報調達
- 購入したデータベース
- Gvrの内部データベース
- 二次情報
- 二次情報
- 1次調査
- ライフサイエンスツール市場に関する調査のサンプルサイズ:
- 一次情報:
- 1次調査の詳細
- セカンダリデータソース:
- 情報またはデータ分析
- データ分析モデル
- 市場の策定と検証
- 市場モデル
- 核酸調製市場
- 細胞生物学市場
- 3D細胞培養技術の比較
- 次世代シーケンシングおよびトランスフェクションエレクトロポレーション市場
- 技術別の市場調査
- 技術の市場シェア評価のためのQfdモデリング
- 最終用途別の市場調査
- 世界市場:CAGR計算
- 目的
第2章 エグゼクティブサマリー
- 市場のスナップショット
- セグメントのスナップショット
- 競合情勢のスナップショット
第3章 市場変数、動向、および範囲
- 市場セグメンテーションと範囲
- 市場動向と展望
- 市場系列の見通し
- 関連/補助的な市場の見通し
- 市場力学
- 市場促進要因分析
- ライフサイエンス技術に対する政府資金の増加
- 細胞・遺伝子治療の成長
- バイオ医薬品(生物製剤およびバイオシミラー)の需要の増加
- ライフサイエンスツールの技術的進歩
- 精密医療のためのゲノムおよびプロテオミクス技術の応用
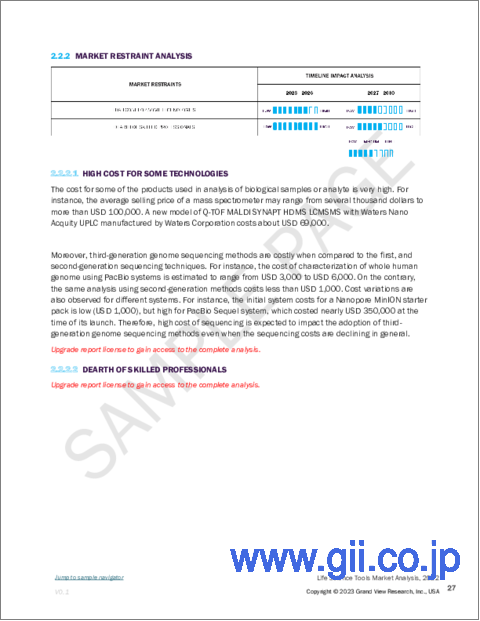
- 市場抑制要因分析
- 一部のテクノロジーでは高コスト
- 熟練した専門家の不足
- 市場機会分析
- ウイルス分析における有用性
- 戦略的取引と開発の数の増加
- 市場促進要因分析
- テクノロジーの普及と成長の見通しマッピング、2022年(100万米ドル)
- COVID-19パンデミックが世界のライフサイエンスツール市場に与える影響
- サプライチェーンへの影響
- ライフサイエンスおよびヘルスケア業界への影響
- 事業環境分析
- SWOT分析;要因別(政治と法律、経済、技術)
- ポーターのファイブフォース分析
第4章 テクノロジービジネス分析
- ライフサイエンスツール市場:技術変動分析
- ゲノム技術
- プロテオミクス技術
- 細胞生物学技術
- その他分析およびサンプル調製技術
- ラボ用品とテクノロジー
第5章 製品ビジネス分析
- ライフサイエンスツール市場:製品変動分析
- 細胞培養システム&3D細胞培養
- 機器
- 消耗品
- 細胞および組織培養サービス
- 液体クロマトグラフィー(Lc)
- 機器
- 消耗品
- サービス
- 質量分析(Ms)
- 機器
- 消耗品
- サービス
- 次世代シーケンシング(Ngs)
- 機器
- 消耗品
- サービス
- PCR &Qpcr
- 機器
- 消耗品
- サービス
- フローサイトメトリー
- 機器
- 消耗品
- サービス
- 核磁気共鳴分光法(Nmr)
- 機器
- 消耗品
- サービス
- 顕微鏡と電子顕微鏡
- 機器
- 消耗品
- サービス
- 核酸調製(昼寝)
- 機器
- 消耗品
- サービス
- トランスフェクション装置と遺伝子送達技術
- 装置
- 試薬
- クローニングとゲノム工学
- キット、試薬、および消耗品
- サービス
- 核酸マイクロアレイ
- 機器
- 消耗品
- サービス
- サンガーシーケンシング
- 機器
- 消耗品
- サービス
- その他分離技術
- 機器
- 消耗品
- サービス
- その他製品とサービス
- 抗体
- 一般用品
- その他
- 機器
- 消耗品
- サービス
第6章 最終用途のビジネス分析
- ライフサイエンスツール市場:最終用途の変動分析
- 政府および学術
- バイオ医薬品企業
- ヘルスケア
- 産業用アプリケーション
- その他
第7章 ライフサイエンスツール市場:製品別、技術別、および最終用途別の地域推定・動向分析
- 北米
- SWOT分析:
- 米国
- 主要な国のダイナミクス
- 競合シナリオ
- 市場シナリオ
- 規制の枠組み
- 償還シナリオ
- カナダ
- 主要な国のダイナミクス
- 競合シナリオ
- 市場シナリオ
- 規制の枠組み
- 償還シナリオ
- 欧州
- SWOT分析:
- ドイツ
- 主要な国のダイナミクス
- 競合シナリオ
- 市場シナリオ
- 規制の枠組み
- 償還シナリオ
- 英国
- 主要な国のダイナミクス
- 競合シナリオ
- 市場シナリオ
- 償還シナリオ
- フランス
- 主要な国のダイナミクス
- 競合シナリオ
- 市場シナリオ
- イタリア
- 主要な国のダイナミクス
- 競合シナリオ
- 市場シナリオ
- 規制の枠組み
- スペイン
- 主要な国のダイナミクス
- 競合シナリオ
- 市場シナリオ
- 2020年にスペインで承認されたバイオテクノロジーR&Dプロジェクト
- スイス
- 競合シナリオ
- M&Aとコラボレーション、2020年から2022年
- デンマーク
- 主要な国のダイナミクス
- デンマーク東部における現在および今後のバイオテクノロジー企業への投資
- 規制の枠組み
- ノルウェー
- 主要な国のダイナミクス
- 2021年の収益に基づくトップバイオテクノロジー企業
- 規制の枠組み
- スウェーデン
- 主要な国のダイナミクス
- 市場概要
- がんの有病率
- 規制の枠組み
- アジア太平洋地域
- SWOT分析:
- 日本
- 主要な国のダイナミクス
- 競合シナリオ
- 市場シナリオ
- 規制の枠組み
- 償還シナリオ
- 中国
- 主要な国のダイナミクス
- 競合シナリオ
- 市場シナリオ
- 規制の枠組み
- 償還シナリオ
- インド
- 主要な国のダイナミクス
- 競合シナリオ
- 市場シナリオ
- 規制の枠組み
- 韓国
- 主要な国のダイナミクス
- 競合シナリオ
- 市場シナリオ
- 技術クラスター別個別化医療の公的研究開発プロジェクトの動向
- 規制の枠組み
- 償還シナリオ
- オーストラリア
- 主要な国のダイナミクス
- 競合シナリオ
- 市場シナリオ
- 償還シナリオ
- シンガポール
- 主要な国のダイナミクス
- 競合シナリオ
- 償還シナリオ
- タイ
- 主要な国のダイナミクス
- タイの主な病気の有病率
- 規制の枠組み
- 償還シナリオ
- ラテンアメリカ
- SWOT分析:
- アルゼンチン
- 主要な国のダイナミクス
- 市場シナリオ
- 規制シナリオ
- 償還シナリオ
- ブラジル
- 主要な国のダイナミクス
- 競合シナリオ
- 市場シナリオ
- 規制の枠組み
- メキシコ
- 主要な国のダイナミクス
- 競合シナリオ
- 市場シナリオ
- 中東とアフリカ
- SWOT分析:
- 南アフリカ
- 主要な国のダイナミクス
- 競合シナリオ
- 市場シナリオ
- 償還シナリオ
- 規制の枠組み
- アラブ首長国連邦
- 主要な国のダイナミクス
- 競合シナリオ
- 市場シナリオ
- 規制の枠組み
- サウジアラビア
- 主要な国のダイナミクス
- 競合シナリオ
- 市場シナリオ
- 規制の枠組み
- 償還シナリオ
- クウェート
- 主要な国のダイナミクス
- 競合シナリオ
- クウェートのヘルスケア部門における主要な開発
- 規制の枠組み
第8章 競合情勢
- 企業分類
- 企業の市場ポジショニング
- 企業の市場シェア分析, 2022
- 企業のヒートマップ分析
- 戦略マッピング
- 企業プロファイル・一覧
- Thermo Fisher Scientific Inc.
- Overview
- Financial Performance (Net Revenue/Sales/EBITDA/Gross Profit)
- Product Benchmarking
- Strategic Initiatives
- Danaher Corporation
- Overview
- Financial Performance (Net Revenue/Sales/EBITDA/Gross Profit)
- Product Benchmarking
- Strategic Initiatives
- Illumina, Inc.
- Overview
- Financial Performance (Net Revenue/Sales/EBITDA/Gross Profit)
- Product Benchmarking
- Strategic Initiatives
- Merck Kgaa
- Overview
- Financial Performance (Net Revenue/Sales/EBITDA/Gross Profit)
- Product Benchmarking
- Strategic Initiatives
- BD
- Overview
- Financial Performance (Net Revenue/Sales/EBITDA/Gross Profit)
- Product Benchmarking
- Strategic Initiatives
- Qiagen
- Overview
- Financial Performance (Net Revenue/Sales/EBITDA/Gross Profit)
- Product Benchmarking
- Strategic Initiatives
- Bio-Rad Laboratories Inc.
- Overview
- Financial Performance (Net Revenue/Sales/EBITDA/Gross Profit)
- Product Benchmarking
- Strategic Initiatives
- Agilent Technologies, Inc.
- Overview
- Financial Performance (Net Revenue/Sales/EBITDA/Gross Profit)
- Product Benchmarking
- Strategic Initiatives
- Hitachi, Ltd.
- Overview
- Financial Performance (Net Revenue/Sales/EBITDA/Gross Profit)
- Product Benchmarking
- Strategic Initiatives
- F. Hoffmann-La Roche Ltd
- Overview
- Financial Performance (Net Revenue/Sales/EBITDA/Gross Profit)
- Product Benchmarking
- Strategic Initiatives
- Bruker
- Overview
- Financial Performance (Net Revenue/Sales/EBITDA/Gross Profit)
- Product Benchmarking
- Strategic Initiatives
- Oxford Instruments Plc
- Overview
- Financial Performance (Net Revenue/Sales/EBITDA/Gross Profit)
- Product Benchmarking
- Strategic Initiatives
- Zeiss International
- Overview
- Financial Performance (Net Revenue/Sales/EBITDA/Gross Profit)
- Product Benchmarking
- Strategic Initiatives
- Shimadzu Corporation
- Overview
- Financial Performance (Net Revenue/Sales/EBITDA/Gross Profit)
- Product Benchmarking
- Strategic Initiatives
- Thermo Fisher Scientific Inc.
List of Tables
- Table 1 NIH common fund awards for biomedical research
- Table 2 Business grants for life science and biotech in Canada
- Table 3 PMDA-approved regenerative medicine, April, 2015-January, 2022
- Table 4 Top biologic drugs in the U.S.
- Table 5 Sequencing-related preparation procedures and their use
- Table 6 Automated nucleic acid extraction systems
- Table 7 Gene discoveries and its application in personalized treatment for neurologic diseases
- Table 8 List of FDA approved molecular tests by key players for COVID-19 diagnosis
- Table 9 Illumina workflows to address COVID-19
- Table 10 Proteomics techniques: advantages and disadvantages
- Table 11 Recent launch of automated sample preparation system by key market players
- Table 12 Manufacturers & suppliers operational in the U.S.: laboratory glassware
- Table 13 Key vendors and models for mass spectrometry instruments
- Table 14 NGS instruments: comparison
- Table 15 Cloning related service providers in the U.S.
- Table 16 Sanger sequencing cleanup kits: types
- Table 17 Protein lysis buffers for different protein locations
- Table 18 Total protein extraction reagents for laboratory use
- Table 19 Applications of proteomics in food and nutrition industry
- Table 20 Key companies adopting expansion strategy
- Table 21 Key companies adopting partnership strategy
- Table 22 Key companies adopting collaboration strategy
- Table 23 Key companies launching new products/services
- Table 24 Key companies adopting acquisition strategy
- Table 25 Key companies adopting other strategies
- Table 26 List of Secondary Sources
- Table 27 List of Abbreviations
- Table 28 Global Life Science Tools Market, by Technology, 2018 - 2030 (USD Billion)
- Table 29 Global Life Science Tools Market, by Product, 2018 - 2030 (USD Billion)
- Table 30 Global Life Science Tools Market, by End-use, 2018 - 2030 (USD Billion)
- Table 31 Global Life Science Tools Market, by Region, 2018 - 2030 (USD Billion)
- Table 32 North America Life Science Tools Market, by Country, 2018 - 2030 (USD Billion)
- Table 33 North America Life Science Tools Market, by Technology, 2018 - 2030 (USD Billion)
- Table 34 North America Life Science Tools Market, by Product, 2018 - 2030 (USD Billion)
- Table 35 North America Life Science Tools Market, by End-use, 2018 - 2030 (USD Billion)
- Table 36 U.S. Life Science Tools Market, by Technology, 2018 - 2030 (USD Billion)
- Table 37 U.S. Life Science Tools Market, by Product, 2018 - 2030 (USD Billion)
- Table 38 U.S. Life Science Tools Market, by End-use, 2018 - 2030 (USD Billion)
- Table 39 Canada Life Science Tools Market, by Technology, 2018 - 2030 (USD Billion)
- Table 40 Canada Life Science Tools Market, by Product, 2018 - 2030 (USD Billion)
- Table 41 Canada Life Science Tools Market, by End-use, 2018 - 2030 (USD Billion)
- Table 42 Europe Life Science Tools Market, by Country, 2018 - 2030 (USD Billion)
- Table 43 Europe Life Science Tools Market, by Technology, 2018 - 2030 (USD Billion)
- Table 44 Europe Life Science Tools Market, by Product, 2018 - 2030 (USD Billion)
- Table 45 Europe Life Science Tools Market, by End-use, 2018 - 2030 (USD Billion)
- Table 46 Germany Life Science Tools Market, by Technology, 2018 - 2030 (USD Billion)
- Table 47 Germany Life Science Tools Market, by Product, 2018 - 2030 (USD Billion)
- Table 48 Germany Life Science Tools Market, by End-use, 2018 - 2030 (USD Billion)
- Table 49 UK Life Science Tools Market, by Technology, 2018 - 2030 (USD Billion)
- Table 50 UK Life Science Tools Market, by Product, 2018 - 2030 (USD Billion)
- Table 51 UK Life Science Tools Market, by End-use, 2018 - 2030 (USD Billion)
- Table 52 France Life Science Tools Market, by Technology, 2018 - 2030 (USD Billion)
- Table 53 France Life Science Tools Market, by Product, 2018 - 2030 (USD Billion)
- Table 54 France Life Science Tools Market, by End-use, 2018 - 2030 (USD Billion)
- Table 55 Italy Life Science Tools Market, by Technology, 2018 - 2030 (USD Billion)
- Table 56 Italy Life Science Tools Market, by Product, 2018 - 2030 (USD Billion)
- Table 57 Italy Life Science Tools Market, by End-use, 2018 - 2030 (USD Billion)
- Table 58 Spain Life Science Tools Market, by Technology, 2018 - 2030 (USD Billion)
- Table 59 Spain Life Science Tools Market, by Product, 2018 - 2030 (USD Billion)
- Table 60 Spain Life Science Tools Market, by End-use, 2018 - 2030 (USD Billion)
- Table 61 Denmark Life Science Tools Market, by Technology, 2018 - 2030 (USD Billion)
- Table 62 Denmark Life Science Tools Market, by Product, 2018 - 2030 (USD Billion)
- Table 63 Denmark Life Science Tools Market, by End-use, 2018 - 2030 (USD Billion)
- Table 64 Norway Life Science Tools Market, by Technology, 2018 - 2030 (USD Billion)
- Table 65 Norway Life Science Tools Market, by Product, 2018 - 2030 (USD Billion)
- Table 66 Norway Life Science Tools Market, by End-use, 2018 - 2030 (USD Billion)
- Table 67 Sweden Life Science Tools Market, by Technology, 2018 - 2030 (USD Billion)
- Table 68 Sweden Life Science Tools Market, by Product, 2018 - 2030 (USD Billion)
- Table 69 Sweden Life Science Tools Market, by End-use, 2018 - 2030 (USD Billion)
- Table 70 Asia Pacific Life Science Tools Market, by Country, 2018 - 2030 (USD Billion)
- Table 71 Asia Pacific Life Science Tools Market, by Technology, 2018 - 2030 (USD Billion)
- Table 72 Asia Pacific Life Science Tools Market, by Product, 2018 - 2030 (USD Billion)
- Table 73 Asia Pacific Life Science Tools Market, by End-use, 2018 - 2030 (USD Billion)
- Table 74 China Life Science Tools Market, by Technology, 2018 - 2030 (USD Billion)
- Table 75 China Life Science Tools Market, by Product, 2018 - 2030 (USD Billion)
- Table 76 China Life Science Tools Market, by End-use, 2018 - 2030 (USD Billion)
- Table 77 Japan Life Science Tools Market, by Technology, 2018 - 2030 (USD Billion)
- Table 78 Japan Life Science Tools Market, by Product, 2018 - 2030 (USD Billion)
- Table 79 Japan Life Science Tools Market, by End-use, 2018 - 2030 (USD Billion)
- Table 80 India Life Science Tools Market, by Technology, 2018 - 2030 (USD Billion)
- Table 81 India Life Science Tools Market, by Product, 2018 - 2030 (USD Billion)
- Table 82 India Life Science Tools Market, by End-use, 2018 - 2030 (USD Billion)
- Table 83 South Korea Life Science Tools Market, by Technology, 2018 - 2030 (USD Billion)
- Table 84 South Korea Life Science Tools Market, by Product, 2018 - 2030 (USD Billion)
- Table 85 South Korea Life Science Tools Market, by End-use, 2018 - 2030 (USD Billion)
- Table 86 Australia Life Science Tools Market, by Technology, 2018 - 2030 (USD Billion)
- Table 87 Australia Life Science Tools Market, by Product, 2018 - 2030 (USD Billion)
- Table 88 Australia Life Science Tools Market, by End-use, 2018 - 2030 (USD Billion)
- Table 89 Thailand Life Science Tools Market, by Technology, 2018 - 2030 (USD Billion)
- Table 90 Thailand Life Science Tools Market, by Product, 2018 - 2030 (USD Billion)
- Table 91 Thailand Life Science Tools Market, by End-use, 2018 - 2030 (USD Billion)
- Table 92 Latin America Life Science Tools Market, by Country, 2018 - 2030 (USD Billion)
- Table 93 Latin America Life Science Tools Market, by Technology, 2018 - 2030 (USD Billion)
- Table 94 Latin America Life Science Tools Market, by Product, 2018 - 2030 (USD Billion)
- Table 95 Latin America Life Science Tools Market, by End-use, 2018 - 2030 (USD Billion)
- Table 96 Brazil Life Science Tools Market, by Technology, 2018 - 2030 (USD Billion)
- Table 97 Brazil Life Science Tools Market, by Product, 2018 - 2030 (USD Billion)
- Table 98 Brazil Life Science Tools Market, by End-use, 2018 - 2030 (USD Billion)
- Table 99 Mexico Life Science Tools Market, by Technology, 2018 - 2030 (USD Billion)
- Table 100 Mexico Life Science Tools Market, by Product, 2018 - 2030 (USD Billion)
- Table 101 Mexico Life Science Tools Market, by End-use, 2018 - 2030 (USD Billion)
- Table 102 Argentina Life Science Tools Market, by Technology, 2018 - 2030 (USD Billion)
- Table 103 Argentina Life Science Tools Market, by Product, 2018 - 2030 (USD Billion)
- Table 104 Argentina Life Science Tools Market, by End-use, 2018 - 2030 (USD Billion)
- Table 105 Middle East and Africa Life Science Tools Market, by Country, 2018 - 2030 (USD Billion)
- Table 106 Middle East and Africa Life Science Tools Market, by Technology, 2018 - 2030 (USD Billion)
- Table 107 Middle East and Africa Life Science Tools Market, by Product, 2018 - 2030 (USD Billion)
- Table 108 Middle East and Africa Life Science Tools Market, by End-use, 2018 - 2030 (USD Billion)
- Table 109 South Africa Life Science Tools Market, by Technology, 2018 - 2030 (USD Billion)
- Table 110 South Africa Life Science Tools Market, by Product, 2018 - 2030 (USD Billion)
- Table 111 South Africa Life Science Tools Market, by End-use, 2018 - 2030 (USD Billion)
- Table 112 Saudi Arabia Life Science Tools Market, by Technology, 2018 - 2030 (USD Billion)
- Table 113 Saudi Arabia Life Science Tools Market, by Product, 2018 - 2030 (USD Billion)
- Table 114 Saudi Arabia Life Science Tools Market, by End-use, 2018 - 2030 (USD Billion)
- Table 115 UAE Life Science Tools Market, by Technology, 2018 - 2030 (USD Billion)
- Table 116 UAE Life Science Tools Market, by Product, 2018 - 2030 (USD Billion)
- Table 117 UAE Life Science Tools Market, by End-use, 2018 - 2030 (USD Billion)
- Table 118 Kuwait Life Science Tools Market, by Technology, 2018 - 2030 (USD Billion)
- Table 119 Kuwait Life Science Tools Market, by Product, 2018 - 2030 (USD Billion)
- Table 120 Kuwait Life Science Tools Market, by End-use, 2018 - 2030 (USD Billion)
List of Figures
- Fig. 1 Market research process
- Fig. 2 Data triangulation techniques
- Fig. 3 Primary research pattern
- Fig. 4 Executives contacted
- Fig. 5 Market research approaches
- Fig. 6 Value-chain-based sizing & forecasting
- Fig. 7 QFD modeling for market share assessment
- Fig. 8 Market formulation & validation
- Fig. 9 Analysis of individual techniques for global market modeling
- Fig. 10 Ancillary market analysis
- Fig. 11 Commodity flow analysis modeling for nucleic acid preparation market
- Fig. 12 Key products
- Fig. 13 Comparison of 3D cell culture techniques
- Fig. 14 Technology offerings of key players in 3D cell culture market
- Fig. 15 Next-generation sequencing market: penetration of key players
- Fig. 16 Transfection electroporation market: penetration of key players
- Fig. 17 QFD modeling for market share assessment of technologies
- Fig. 18 Commodity flow analysis modeling for end users
- Fig. 19 Penetration of key players in the academic/government end-use segment
- Fig. 20 End-use specific revenues generated by Agilent Technologies
- Fig. 21 Market snapshot
- Fig. 22 Segment snapshot
- Fig. 23 Competitive landscape snapshot
- Fig. 24 Life science tools market segmentation
- Fig. 25 Market driver impact
- Fig. 26 Cell therapies under investigation, by country
- Fig. 27 Cell therapies under investigation, by type
- Fig. 28 Clinical trials conducted for gene therapy
- Fig. 29 Market restraint impact
- Fig. 30 Penetration and growth prospect mapping
- Fig. 31 Key macroeconomic challenges associated with the pandemic
- Fig. 32 Key elements to enhance the supply chain post COVID
- Fig. 33 Types of COVID-19 tests
- Fig. 34 Role of NGS to combat COVID-19 outbreak
- Fig. 35 SWOT analysis, by factor (Political & legal, economic, and technological)
- Fig. 36 Porter's five forces analysis
- Fig. 37 Life science tools market: technology outlook and key takeaways
- Fig. 38 Life science tools market: technology movement analysis
- Fig. 39 Genomic technology market estimates and forecast, 2018 - 2030 (USD Billion)
- Fig. 40 Proteomics technology market estimates and forecast, 2018 - 2030 (USD Billion)
- Fig. 41 Cell biology technology market estimates and forecast, 2018 - 2030 (USD Billion)
- Fig. 42 Other analytical & sample preparation technology market estimates and forecast, 2018 - 2030 (USD Billion)
- Fig. 43 Lab supplies & technology market estimates and forecast, 2018 - 2030 (USD Billion)
- Fig. 44 Life science tools market: product outlook and key takeaways
- Fig. 45 Life science tools market: product movement analysis
- Fig. 46 Life science tools market for cell culture systems & 3D cell culture, 2018 - 2030 (USD Billion)
- Fig. 47 Life science tools market estimates and forecast for cell culture systems & 3D cell culture by product, 2018 - 2030 (USD Billion)
- Fig. 48 Life science tools market for liquid chromatography, 2018 - 2030 (USD Billion)
- Fig. 49 Life science tools market estimates and forecast for LC, by product, 2018 - 2030 (USD Billion)
- Fig. 50 Life science tools market for mass spectrometry, 2018 - 2030 (USD Billion)
- Fig. 51 Life science tools market estimates and forecast for MS, by product, 2018 - 2030 (USD Billion)
- Fig. 52 Life science tools market estimates and forecast for NGS, 2018 - 2030 (USD Billion)
- Fig. 53 Life science tools market estimates and forecast for NGS, by product, 2018 - 2030 (USD Billion)
- Fig. 54 Life science tools market estimates and forecast for PCR & qPCR, 2018 - 2030 (USD Billion)
- Fig. 55 Life science tools market estimates and forecast for PCR & qPCR, by product, 2018 - 2030 (USD Billion)
- Fig. 56 Life science tools market for flow cytometry, 2018 - 2030 (USD Billion)
- Fig. 57 Life science tools market estimates and forecast for flow cytometry, by product, 2018 - 2030 (USD Billion)
- Fig. 58 Life science tools market for nuclear magnetic resonance spectroscopy, 2018 - 2030 (USD Billion)
- Fig. 59 Life science tools market estimates and forecast for NMR, by product, 2018 - 2030 (USD Billion)
- Fig. 60 Life science tools market for microscopy & electron microscopy, 2018 - 2030 (USD Billion)
- Fig. 61 Life science tools market estimates and forecast for microscopy & electron microscopy, by product, 2018 - 2030 (USD Billion)
- Fig. 62 Life science tools market for nucleic acid preparation, 2018 - 2030 (USD Billion)
- Fig. 63 Life science tools market estimates and forecast for NAP, by product, 2018 - 2030 (USD Billion)
- Fig. 64 Life science tools market for transfection devices & gene delivery technologies, 2018 - 2030 (USD Billion)
- Fig. 65 Life science tools market estimates and forecast for transfection devices & gene delivery technologies, by product, 2018 - 2030 (USD Billion)
- Fig. 66 Life science tools market for cloning & genome engineering, 2018 - 2030 (USD Billion)
- Fig. 67 Life science tools market estimates and forecast for cloning & genome engineering, by product, 2018 - 2030 (USD Billion)
- Fig. 68 Cloning kits, reagents, and consumables offered by Merck
- Fig. 69 Life science tools market for nucleic acid microarray, 2018 - 2030 (USD Billion)
- Fig. 70 Life science tools market for nucleic acid microarray, by product, 2018 - 2030 (USD Billion)
- Fig. 71 Life science tools market for sanger sequencing, 2018 - 2030 (USD Billion)
- Fig. 72 Life science tools market for sanger sequencing, by product, 2018 - 2030 (USD Billion)
- Fig. 73 Life science tools market for other separation technologies, 2018 - 2030 (USD Billion)
- Fig. 74 Life science tools market for other separation technologies, by product, 2018 - 2030 (USD Billion)
- Fig. 75 Life science tools market for other products & services, 2018 - 2030 (USD Billion)
- Fig. 76 Life science tools market estimates and forecast for other products & services, by product, 2018 - 2030 (USD Billion)
- Fig. 77 Life science tools market for others, 2018 - 2030 (USD Billion)
- Fig. 78 Life science tools market for others, by product, 2018 - 2030 (USD Billion)
- Fig. 79 Life science tools market: End-use outlook and key takeaways
- Fig. 80 Life science tools market: end-use movement analysis
- Fig. 81 Life science tools market for government & academic end use, 2018 - 2030 (USD Billion)
- Fig. 82 Life science tools market for biopharmaceutical companies, 2018 - 2030 (USD Billion)
- Fig. 83 Life science tools market for healthcare end use, 2018 - 2030 (USD Billion)
- Fig. 84 Life science tools market for industry end use, 2018 - 2030 (USD Billion)
- Fig. 85 Life science tools market for other end use, 2018 - 2030 (USD Billion)
- Fig. 86 Regional marketplace: key takeaways
- Fig. 87 North America: SWOT analysis
- Fig. 88 North America life sciences tools market estimates and forecasts, 2018 - 2030 (USD Billion)
- Fig. 89 Key country dynamics
- Fig. 90 U.S. life sciences tools market estimates and forecasts, 2018 - 2030 (USD Billion)
- Fig. 91 Key country dynamics
- Fig. 92 Canada life sciences tools market estimates and forecasts, 2018 - 2030 (USD Billion)
- Fig. 93 Europe: SWOT analysis
- Fig. 94 Europe life sciences tools market estimates and forecasts, 2018 - 2030 (USD Billion)
- Fig. 95 Key country dynamics
- Fig. 96 Germany life sciences tools market estimates and forecasts, 2018 - 2030 (USD Billion)
- Fig. 97 Key country dynamics
- Fig. 98 UK life sciences tools market estimates and forecasts, 2018 - 2030 (USD Billion)
- Fig. 99 Key country dynamics
- Fig. 100 France life sciences tools market estimates and forecasts, 2018 - 2030 (USD Billion)
- Fig. 101 Key country dynamics
- Fig. 102 Italy life sciences tools market estimates and forecasts, 2018 - 2030 (USD Billion)
- Fig. 103 Key country dynamics
- Fig. 104 Market scenario
- Fig. 105 Key country dynamics
- Fig. 106 Spain life sciences tools market estimates and forecasts, 2018 - 2030 (USD Billion)
- Fig. 107 Switzerland life sciences tools market estimates and forecasts, 2018 - 2030 (USD Billion)
- Fig. 108 Key country dynamics
- Fig. 109 Current and upcoming biotech companies investments in Eastern Denmark
- Fig. 110 Regulatory framework
- Fig. 111 Denmark life sciences tools market estimates and forecasts, 2018 - 2030 (USD Billion)
- Fig. 112 Key country dynamics
- Fig. 113 Top Biotechnology Companies, Based on revenue as of 2021
- Fig. 114 Regulatory framework
- Fig. 115 Norway life sciences tools market estimates and forecasts, 2018 - 2030 (USD Billion)
- Fig. 116 Key country dynamics
- Fig. 117 Top biotechnology companies, based on revenue as of 2021
- Fig. 118 Cancer prevalence
- Fig. 119 Regulatory framework
- Fig. 120 Sweden life sciences tools market estimates and forecasts, 2018 - 2030 (USD Billion)
- Fig. 121 Europe: SWOT analysis
- Fig. 122 Asia Pacific life sciences tools market estimates and forecasts, 2018 - 2030 (USD Billion)
- Fig. 123 Key country dynamics
- Fig. 124 Japan life sciences tools market estimates and forecasts, 2018 - 2030 (USD Billion)
- Fig. 125 Key country dynamics
- Fig. 126 Regulatory framework
- Fig. 127 Regulatory scenario
- Fig. 128 Reimbursement scenario
- Fig. 129 China life sciences tools market estimates and forecasts, 2018 - 2030 (USD Billion)
- Fig. 130 Key country dynamics
- Fig. 131 India life sciences tools market estimates and forecasts, 2018 - 2030 (USD Billion)
- Fig. 132 Key country dynamics
- Fig. 133 Trend of public R&D projects for personalized medicine by technology clusters
- Fig. 134 Regulatory framework
- Fig. 135 Reimbursement Scenario
- Fig. 136 South Korea life sciences tools market estimates and forecasts, 2018 - 2030 (USD Billion)
- Fig. 137 Key country dynamics
- Fig. 138 Australia life sciences tools market estimates and forecasts, 2018 - 2030 (USD Billion)
- Fig. 139 Singapore life sciences tools market estimates and forecasts, 2018 - 2030 (USD Billion)
- Fig. 140 Key country dynamics
- Fig. 141 Thailand key disease prevalence
- Fig. 142 Regulatory framework
- Fig. 143 Reimbursement scenario
- Fig. 144 Thailand life sciences tools market estimates and forecasts, 2018 - 2030 (USD Billion)
- Fig. 145 Latin America: SWOT analysis
- Fig. 146 Latin America life sciences tools market estimates and forecasts, 2018 - 2030 (USD Billion)
- Fig. 147 Key country dynamics
- Fig. 148 Regulatory scenario
- Fig. 149 Reimbursement scenario
- Fig. 150 Argentina life sciences tools estimates and forecasts, 2018 - 2030 (USD Billion)
- Fig. 151 Key country dynamics
- Fig. 152 Regulatory framework
- Fig. 153 Brazil life sciences tools market estimates and forecasts, 2018 - 2030 (USD Billion)
- Fig. 154 Key country dynamics
- Fig. 155 Mexico life sciences tools market estimates and forecasts, 2018 - 2030 (USD Billion)
- Fig. 156 MEA: SWOT analysis
- Fig. 157 MEA life sciences tools market estimates and forecasts, 2018 - 2030 (USD Billion)
- Fig. 158 Key country dynamics
- Fig. 159 Reimbursement scenario
- Fig. 160 Regulatory framework
- Fig. 161 South Africa. life sciences tools market estimates and forecasts, 2018 - 2030 (USD Billion)
- Fig. 162 Key country dynamics
- Fig. 163 Regulatory framework
- Fig. 164 UAE life sciences tools market estimates and forecasts, 2018 - 2030 (USD Billion)
- Fig. 165 Key country dynamics
- Fig. 166 Reimbursement scenario
- Fig. 167 Saudi Arabia life sciences tools market estimates and forecasts, 2018 - 2030 (USD Billion)
- Fig. 168 Key country dynamics
- Fig. 169 Key development in healthcare sector of Kuwait
- Fig. 170 Regulatory framework
- Fig. 171 Kuwait life sciences tools market estimates and forecasts, 2018 - 2030 (USD Billion)
- Fig. 172 Market participant categorization
- Fig. 173 Life science tools market share analysis, 2022
- Fig. 174 Strategic framework
Life Science Tools Market Growth & Trends:
The global life science tools market size is expected to reach USD 330.69 billion by 2030, according to a new report by Grand View Research, Inc., expanding at a CAGR of 10.8% from 2023 to 2030. This growth can be attributed to a rise in government funding for life science technologies, demand for cell and gene therapies, an increase in the adoption of biopharmaceuticals, and growing competition among prominent companies in the market.
The exponential rise of COVID-19 cases globally requires rapid diagnosis for containment of the spread of infectious disease, which boosted the demand for life science tools during the pandemic and had a positive impact on the market. Rapid diagnosis of the infection, effective treatments, and preventative plans are essential for the management of cases during the COVID-19 pandemic. The current race for the development of cost-effective point-of-contact test kits and efficient laboratory methodologies for confirmation of SARS-CoV-2 infection has driven a new frontier of diagnostic innovation. During this pandemic, the U.S. FDA granted Emergency Use Authorizations (EUAs) to several diagnostic tests to make them rapidly and easily available for use. For example, in May 2022, the U.S. FDA granted a EUA to ID NOW COVID-19 2.0, a rapid in-vitro diagnostic test by Abbott Diagnostics Scarborough, Inc. Moreover, a wide range of commercial COVID-19 tests is available in the marketplace, which will further add to revenue generation.
Additionally, the life science tools industry is expanding based on the increasing investments by the government for the advancement of research and technologies. Organizations such as The National Human Genome Research Institute (NHGRI) and the National Institutes of Health (NIH) are actively funding various life science projects. For instance, the NIH funded USD 25 million for the '4D Nucleome Program', which aims to understand gene regulation and cellular expression via the nuclear organization. Moreover, the U.S. government has funded several life sciences companies for R&D purposes. For instance, the Biomedical Advanced Research and Development Authority (BARDA) has planned to make awards worth USD 750,000 to facilitate the development of innovative technologies in the healthcare sector. Thus, the increase in government funding for life science research as well as technologies is expected to drive the market in the coming years.
Key players are also contributing to the growth of the market by providing advanced tools and techniques. Furthermore, companies are introducing new automated solutions in the market, which, in turn, provide lucrative opportunities for market growth. For instance, in February 2022, Covaris, LLC. announced the launch of truXTRAC FFPE Total NA Auto 96 Kit, a fully automated workflow comprising all necessary accessories, consumables, and reagents. This automated kit is powered by Adaptive Focused Acoustics (AFA) technology that allows both purification and extraction of RNA & DNA for FFPE (formalin fixed paraffin embedded) samples in 5 hours. The introduction of innovative solutions is expected to drive the market in the near future.
Life Science Tools Market Report Highlights:
- By technology, cell biology technology accounted for the largest share in 2022. The introduction of novel technologies for the usage and adoption of stem cells, CAR T-cells, TCR T-cells, NK T-cells, and other cell therapies is expected to boost revenue generation in this segment
- By product, the cell culture systems and 3D cell culture segment held the largest share in 2022. Cell biology is gaining popularity across multiple aspects in the life science industry, which is contributing significantly to the revenue generated by this segment
- By end-use, the healthcare segment generated the highest revenue in 2022. The rise in adoption of proteomic and genomic workflows in clinics, hospitals, and diagnostic laboratories for the treatment and diagnosis of several clinically presented abnormalities is anticipated to drive the market
- North America accounted for the largest revenue share in 2022. The rapid adoption of genomics, proteomics, oncology, and diagnostic screening in the region has contributed to regional growth. In addition, a number of major market players are continuously engaged in the development of advanced tools for life science research in this region
- Asia Pacific is expected to grow at the highest rate over the projected period. Investments by global companies in this region to utilize the untapped avenue and lucrative opportunities will drive the regional market
Table of Contents
Chapter 1 Methodology And Scope
- 1.1 Research Methodology
- 1.2 Research Assumptions
- 1.2.1 Estimates And Forecast Timeline
- 1.3 Information Procurement
- 1.3.1 Purchased Database
- 1.3.2 Gvr's Internal Database
- 1.3.3 Secondary Sources
- 1.3.4 Secondary Sources
- 1.3.5 Primary Research
- 1.3.6 Sample Size For The Study On Life Science Tools Market:
- 1.3.6.1 Primary Sources:
- 1.3.6.2 Details Of Primary Research
- 1.3.6.3 Secondary Data Sources:
- 1.4 Information Or Data Analysis
- 1.4.1 Data Analysis Models
- 1.5 Market Formulation & Validation
- 1.6 Market Model
- 1.6.1 Nucleic Acid Preparation Market
- 1.6.2 Cell Biology Market
- 1.6.2.1 Comparison Of 3d Cell Culture Techniques
- 1.6.3 Next-Generation Sequencing & Transfection Electroporation Market
- 1.6.4 Market Study, By Technology
- 1.6.4.1 Qfd Modeling For Market Share Assessment Of Technologies
- 1.6.5 Market Study, By End Use
- 1.7 Global Market: Cagr Calculation
- 1.8 Objectives
- 1.8.1 Objective 1:
- 1.8.2 Objective 2:
Chapter 2 Executive Summary
- 2.1 Market Snapshot
- 2.2 Segment Snapshot
- 2.3 Competitive Landscape Snapshot
Chapter 3 Market Variables, Trends, And Scope
- 3.1 Market Segmentation & Scope
- 3.2 Market Trends & Outlook
- 3.3 Market Lineage Outlook
- 3.3.1 Related/Ancillary Market Outlook
- 3.4 Market Dynamics
- 3.4.1 Market Driver Analysis
- 3.4.1.1 Increased Government Funding For Life Science Technologies
- 3.4.1.2 Growth Of Cell And Gene Therapies
- 3.4.1.3 Rise In The Demand For Biopharmaceuticals (Biologics & Biosimilars)
- 3.4.1.4 Technological Advancements In Life Science Tools
- 3.4.1.5 Applications Of Genomic And Proteomic Technologies For Precision Medicine
- 3.4.2 Market Restraint Analysis
- 3.4.2.1 High Cost For Some Technologies
- 3.4.2.2 Dearth Of Skilled Professionals
- 3.4.3 Market Opportunity Analysis
- 3.4.3.1 Utility In Viral Analysis
- 3.4.3.2 Rise In The Number Of Strategic Deals & Developments
- 3.4.1 Market Driver Analysis
- 3.5 Penetration And Growth Prospect Mapping For Technology, 2022 (USD Million)
- 3.6 Impact Of Covid-19 Pandemic On Global Life Science Tools Market
- 3.6.1 Impact On The Supply Chain
- 3.6.2 Impact On Life Sciences & Healthcare Industry
- 3.7 Business Environment Analysis
- 3.7.1 Swot Analysis; By Factor (Political & Legal, Economic, And Technological)
- 3.7.2 Porter's Five Forces Analysis
Chapter 4 Technology Business Analysis
- 4.1 Life Science Tools Market: Technology Movement Analysis
- 4.2 Genomic Technology
- 4.2.1 Genomic Technology Market Estimates And Forecast, 2018 - 2030 (USD Billion)
- 4.3 Proteomics Technology
- 4.3.1 Proteomics Technology Market Estimates And Forecast, 2018 - 2030 (USD Billion)
- 4.4 Cell Biology Technology
- 4.4.1 Cell Biology Technology Market Estimates And Forecast, 2018 - 2030 (USD Billion)
- 4.5 Other Analytical & Sample Preparation Technology
- 4.5.1 Other Analytical & Sample Preparation Technology Market Estimates And Forecast, 2018 - 2030 (USD Billion)
- 4.6 Lab Supplies & Technologies
- 4.6.1 Lab Supplies & Technology Market Estimates And Forecast, 2018 - 2030 (USD Billion)
Chapter 5 Product Business Analysis
- 5.1 Life Science Tools Market: Product Movement Analysis
- 5.2 Cell Culture Systems & 3d Cell Culture
- 5.2.1 Life Science Tools Market For Cell Culture Systems & 3d Cell Culture, 2018 - 2030 (USD Million)
- 5.2.2 Instruments
- 5.2.3 Consumables
- 5.2.4 Cell & Tissue Culture Services
- 5.3 Liquid Chromatography (Lc)
- 5.3.1 Life Science Tools Market For Liquid Chromatography, 2018 - 2030 (USD Million)
- 5.3.2 Instruments
- 5.3.3 Consumables
- 5.3.4 Services
- 5.4 Mass Spectrometry (Ms)
- 5.4.1 Life Science Tools Market For Mass Spectrometry, 2018 - 2030 (USD Million)
- 5.4.2 Instruments
- 5.4.3 Consumables
- 5.4.4 Services
- 5.5 Next-Generation Sequencing (Ngs)
- 5.5.1 Life Science Tools Market Estimates And Forecast For Ngs, 2018 - 2030 (USD Billion)
- 5.5.2 Instruments
- 5.5.3 Consumables
- 5.5.4 Services
- 5.6 Pcr & Qpcr
- 5.6.1 Life Science Tools Market Estimates And Forecast For Pcr & Qpcr, 2018 - 2030 (USD Million)
- 5.6.2 Instruments
- 5.6.3 Consumables
- 5.6.4 Services
- 5.7 Flow Cytometry
- 5.7.1 Life Science Tools Market For Flow Cytometry, 2018 - 2030 (USD Million)
- 5.7.2 Instruments
- 5.7.3 Consumables
- 5.7.4 Services
- 5.8 Nuclear Magnetic Resonance Spectroscopy (Nmr)
- 5.8.1 Life Science Tools Market For Nuclear Magnetic Resonance Spectroscopy, 2018 - 2030 (USD Million)
- 5.8.2 Instruments
- 5.8.3 Consumables
- 5.8.4 Services
- 5.9 Microscopy & Electron Microscopy
- 5.9.1 Life Science Tools Market For Microscopy & Electron Microscopy, 2018 - 2030 (USD Million)
- 5.9.2 Instruments
- 5.9.3 Consumables
- 5.9.4 Services
- 5.10 Nucleic Acid Preparation (Nap)
- 5.10.1 Life Science Tools Market For Nucleic Acid Preparation, 2018 - 2030 (USD Million)
- 5.10.2 Instruments
- 5.10.3 Consumables
- 5.10.4 Services
- 5.11 Transfection Devices & Gene Delivery Technologies
- 5.11.1 Life Science Tools Market For Transfection Devices & Gene Delivery Technologies, 2018 - 2030 (USD Million)
- 5.11.2 Equipment
- 5.11.3 Reagents
- 5.12 Cloning & Genome Engineering
- 5.12.1 Life Science Tools Market For Cloning & Genome Engineering, 2018 - 2030 (USD Million)
- 5.12.2 Kits, Reagents, And Consumables
- 5.12.3 Services
- 5.13 Nucleic Acid Microarray
- 5.13.1 Life Science Tools Market For Nucleic Acid Microarray, 2018 - 2030 (USD Million)
- 5.13.2 Instruments
- 5.13.3 Consumables
- 5.13.4 Services
- 5.14 Sanger Sequencing
- 5.14.1 Life Science Tools Market For Sanger Sequencing, 2018 - 2030 (USD Million)
- 5.14.2 Instrument
- 5.14.3 Consumables
- 5.14.4 Services
- 5.15 Other Separation Technologies
- 5.15.1 Life Science Tools Market For Other Separation Technologies, 2018 - 2030 (USD Million)
- 5.15.2 Instrument
- 5.15.3 Consumables
- 5.15.4 Services
- 5.16 Other Products & Services
- 5.16.1 Life Science Tools Market For Other Products & Services, 2018 - 2030 (USD Million)
- 5.16.2 Antibodies
- 5.16.3 General Supplies
- 5.16.4 Others
- 5.16.4.1 Life Science Tools Market For Others, 2018 - 2030 (USD Million)
- 5.16.4.2 Instruments
- 5.16.4.3 Consumables
- 5.16.4.4 Services
Chapter 6 End-Use Business Analysis
- 6.1 Life Science Tools Market: End-Use Movement Analysis
- 6.2 Government & Academic
- 6.2.1 Life Science Tools Market For Government & Academic End Use, 2018 - 2030 (USD Billion)
- 6.3 Biopharmaceutical Company
- 6.3.1 Life Science Tools Market For Biopharmaceutical Companies, 2018 - 2030 (USD Billion)
- 6.4 Healthcare
- 6.4.1 Life Science Tools Market For Health Care End Use, 2018 - 2030 (USD Billion)
- 6.5 Industrial Applications
- 6.5.1 Life Science Tools Market For Industry End Use, 2018 - 2030 (USD Billion)
- 6.6 Other
- 6.6.1 Life Science Tools Market For Other End Use, 2018 - 2030 (USD Billion)
Chapter 7 Life Sciences Tools Market: Regional Estimates And Trend Analysis, By Product, Technology, & End-Use
- 7.1 North America
- 7.1.1 Swot Analysis:
- 7.1.1.1 North America Life Sciences Tools Market Estimates And Forecasts, 2018 - 2030 (USD Billion)
- 7.1.2 U.S.
- 7.1.2.1 Key Country Dynamics
- 7.1.2.2 Competitive Scenario
- 7.1.2.3 Market Scenario
- 7.1.2.4 Regulatory Framework
- 7.1.2.5 Reimbursement Scenario
- 7.1.2.6 U.S. Life Sciences Tools Market Estimates And Forecasts, 2018 - 2030 (USD Billion)
- 7.1.3 Canada
- 7.1.3.1 Key Country Dynamics
- 7.1.3.2 Competitive Scenario
- 7.1.3.3 Market Scenario
- 7.1.3.4 Regulatory Framework
- 7.1.3.5 Reimbursement Scenario
- 7.1.3.6 Canada Life Sciences Tools Market Estimates And Forecasts, 2018 - 2030 (USD Billion)
- 7.1.1 Swot Analysis:
- 7.2 Europe
- 7.2.1 Swot Analysis:
- 7.2.1.1 Europe Life Sciences Tools Market Estimates And Forecasts, 2018 - 2030 (USD Billion)
- 7.2.2 Germany
- 7.2.2.1 Key Country Dynamics
- 7.2.2.2 Competitive Scenario
- 7.2.2.3 Market Scenario
- 7.2.2.4 Regulatory Framework
- 7.2.2.5 Reimbursement Scenario
- 7.2.2.6 Germany Life Sciences Tools Market Estimates And Forecasts, 2018 - 2030 (USD Billion)
- 7.2.3 UK
- 7.2.3.1 Key Country Dynamics
- 7.2.3.2 Competitive Scenario
- 7.2.3.3 Market Scenario
- 7.2.3.4 Reimbursement Scenario
- 7.2.3.5 UK Life Sciences Tools Market Estimates And Forecasts, 2018 - 2030 (USD Billion)
- 7.2.4 France
- 7.2.4.1 Key Country Dynamics
- 7.2.4.2 Competitive Scenario
- 7.2.4.3 Market Scenario
- 7.2.4.4 France Life Sciences Tools Market Estimates And Forecasts, 2018 - 2030 (USD Billion)
- 7.2.5 Italy
- 7.2.5.1 Key Country Dynamics
- 7.2.5.2 Competitive Scenario
- 7.2.5.3 Market Scenario
- 7.2.5.4 Regulatory Framework
- 7.2.5.5 Italy Life Sciences Tools Market Estimates And Forecasts, 2018 - 2030 (USD Billion)
- 7.2.6 Spain
- 7.2.6.1 Key Country Dynamics
- 7.2.6.2 Competitive Scenario
- 7.2.6.3 Market Scenario
- 7.2.6.4 Biotechnology R&D Projects Approved In Spain In 2020
- 7.2.6.5 Spain Life Sciences Tools Market Estimates And Forecasts, 2018 - 2030 (USD Billion)
- 7.2.7 Switzerland
- 7.2.7.1 Competitive Scenario
- 7.2.7.2 M&A And Collaborations, 2020-2022
- 7.2.7.3 Switzerland Life Sciences Tools Market Estimates And Forecasts, 2018 - 2030 (USD Billion)
- 7.2.8 Denmark
- 7.2.8.1 Key Country Dynamics
- 7.2.8.2 Current And Upcoming Biotech Companies Investments In Eastern Denmark
- 7.2.8.3 Regulatory Framework
- 7.2.8.4 Denmark Life Sciences Tools Market Estimates And Forecasts, 2018 - 2030 (USD Billion)
- 7.2.9 Norway
- 7.2.9.1 Key Country Dynamics
- 7.2.9.2 Top Biotechnology Companies, Based On Revenue As Of 2021
- 7.2.9.3 Regulatory Framework
- 7.2.9.4 Norway Life Sciences Tools Market Estimates And Forecasts, 2018 - 2030 (USD Billion)
- 7.2.10 Sweden
- 7.2.10.1 Key Country Dynamics
- 7.2.10.2 Market Overview
- 7.2.10.3 Cancer Prevalance
- 7.2.10.4 Regulatory Framework
- 7.2.10.5 Sweden Life Sciences Tools Market Estimates And Forecasts, 2018 - 2030 (USD Billion)
- 7.2.1 Swot Analysis:
- 7.3 Asia Pacific
- 7.3.1 Swot Analysis:
- 7.3.1.1 Asia Pacific Life Sciences Tools Market Estimates And Forecasts, 2018 - 2030 (USD Billion)
- 7.3.2 Japan
- 7.3.2.1 Key Country Dynamics
- 7.3.2.2 Competitive Scenario
- 7.3.2.3 Market Scenario
- 7.3.2.4 Regulatory Framework
- 7.3.2.5 Reimbursement Scenario
- 7.3.2.6 Japan Life Sciences Tools Market Estimates And Forecasts, 2018 - 2030 (USD Billion)
- 7.3.3 China
- 7.3.3.1 Key Country Dynamics
- 7.3.3.2 Competitive Scenario
- 7.3.3.3 Market Scenario
- 7.3.3.4 Regulatory Framework
- 7.3.3.5 Reimbursement Scenario
- 7.3.3.6 China Life Sciences Tools Market Estimates And Forecasts, 2018 - 2030 (USD Billion)
- 7.3.4 India
- 7.3.4.1 Key Country Dynamics
- 7.3.4.2 Competitive Scenario
- 7.3.4.3 Market Scenario
- 7.3.4.4 Regulatory Framework
- 7.3.4.5 India Life Sciences Tools Market Estimates And Forecasts, 2018 - 2030 (USD Billion)
- 7.3.5 South Korea
- 7.3.5.1 Key Country Dynamics
- 7.3.5.2 Competitive Scenario
- 7.3.5.3 Market Scenario
- 7.3.5.4 Trend Of Public R&D Projects For Personalized Medicine By Technology Clusters
- 7.3.5.5 Regulatory Framework
- 7.3.5.6 Reimbursement Scenario
- 7.3.5.7 South Korea Life Sciences Tools Market Estimates And Forecasts, 2018 - 2030 (USD Billion)
- 7.3.6 Australia
- 7.3.6.1 Key Country Dynamics
- 7.3.6.2 Competitive Scenario
- 7.3.6.3 Market Scenario
- 7.3.6.4 Reimbursement Scenario
- 7.3.6.5 Australia Life Sciences Tools Market Estimates And Forecasts, 2018 - 2030 (USD Billion)
- 7.3.7 Singapore
- 7.3.7.1 Key Country Dynamics
- 7.3.7.2 Competitive Scenario
- 7.3.7.3 Reimbursement Scenario
- 7.3.7.4 Singapore Life Sciences Tools Market Estimates And Forecasts, 2018 - 2030 (USD Billion)
- 7.3.8 Thailand
- 7.3.8.1 Key Country Dynamics
- 7.3.8.2 Thailand Key Disease Prevalence
- 7.3.8.3 Regulatory Framework
- 7.3.8.4 Reimbursement Scenario
- 7.3.8.5 Thailand Life Sciences Tools Market Estimates And Forecasts, 2018 - 2030 (USD Billion)
- 7.3.1 Swot Analysis:
- 7.4 Latin America
- 7.4.1 Swot Analysis:
- 7.4.1.1 Latin America Life Sciences Tools Market Estimates And Forecasts, 2018 - 2030 (USD Billion)
- 7.4.2 Argentina
- 7.4.2.1 Key Country Dynamics
- 7.4.2.2 Market Scenario
- 7.4.2.3 Regulatory Scenario
- 7.4.2.4 Reimbursement Scenario
- 7.4.2.5 Argentina Life Sciences Tools Market Estimates And Forecasts, 2018 - 2030 (USD Billion)
- 7.4.3 Brazil
- 7.4.3.1 Key Country Dynamics
- 7.4.3.2 Competitive Scenario
- 7.4.3.3 Market Scenario
- 7.4.3.4 Regulatory Framework
- 7.4.3.5 Brazil Life Sciences Tools Market Estimates And Forecasts, 2018 - 2030 (USD Billion)
- 7.4.4 Mexico
- 7.4.4.1 Key Country Dynamics
- 7.4.4.2 Competitive Scenario
- 7.4.4.3 Market Scenario
- 7.4.4.4 Mexico Life Sciences Tools Market Estimates And Forecasts, 2018 - 2030 (USD Billion)
- 7.4.1 Swot Analysis:
- 7.5 Middle East And Africa
- 7.5.1 Swot Analysis:
- 7.5.1.1 MEA Life Sciences Tools Market Estimates And Forecasts, 2018 - 2030 (USD Billion)
- 7.5.2 South Africa
- 7.5.2.1 Key Country Dynamics
- 7.5.2.2 Competitive Scenario
- 7.5.2.3 Market Scenario
- 7.5.2.4 Reimbursement Scenario
- 7.5.2.5 Regulatory Framework
- 7.5.2.6 South Africa Life Sciences Tools Market Estimates And Forecasts, 2018 - 2030 (USD Billion)
- 7.5.3 UAE
- 7.5.3.1 Key Country Dynamics
- 7.5.3.2 Competitive Scenario
- 7.5.3.3 Market Scenario
- 7.5.3.4 Regulatory Framework
- 7.5.3.5 Uae Life Sciences Tools Market Estimates And Forecasts, 2018 - 2030 (USD Billion)
- 7.5.4 Saudi Arabia
- 7.5.4.1 Key Country Dynamics
- 7.5.4.2 Competitive Scenario
- 7.5.4.3 Market Scenario
- 7.5.4.4 Regulatory Framework
- 7.5.4.5 Reimbursement Scenario
- 7.5.4.6 Saudi Arabia Life Sciences Tools Market Estimates And Forecasts, 2018 - 2030 (USD Billion)
- 7.5.5 Kuwait
- 7.5.5.1 Key Country Dynamics
- 7.5.5.2 Competitive Scenario
- 7.5.5.3 Key Development In Healthcare Sector Of Kuwait
- 7.5.5.4 Regulatory Framework
- 7.5.5.5 Kuwait Life Sciences Tools Market Estimates And Forecasts, 2018 - 2030 (USD Billion)
- 7.5.1 Swot Analysis:
Chapter 8 Competitive Landscape
- 8.1 Company Categorization
- 8.2 Company Market Positioning
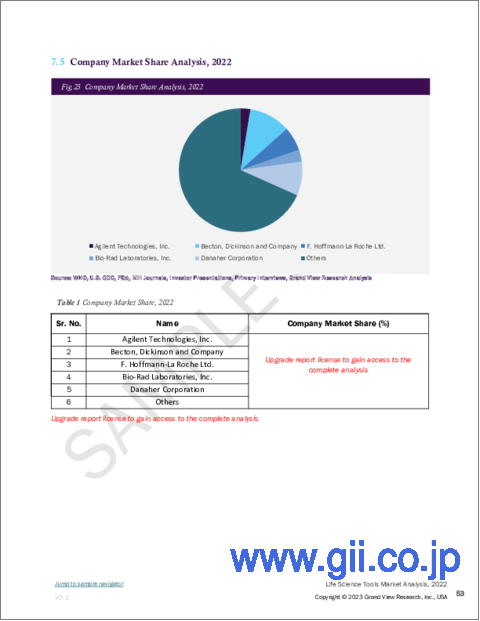
- 8.3 Company Market Share Analysis, 2022
- 8.4 Company Heat Map Analysis
- 8.5 Strategy Mapping
- 8.6 Company Profiles/Listing
- 8.6.1 Thermo Fisher Scientific Inc.
- 8.6.1.1. Overview
- 8.6.1.2. Financial Performance (Net Revenue/Sales/EBITDA/Gross Profit)
- 8.6.1.3. Product Benchmarking
- 8.6.1.4. Strategic Initiatives
- 8.6.2 Danaher Corporation
- 8.6.2.1. Overview
- 8.6.2.2. Financial Performance (Net Revenue/Sales/EBITDA/Gross Profit)
- 8.6.2.3. Product Benchmarking
- 8.6.2.4. Strategic Initiatives
- 8.6.3 Illumina, Inc.
- 8.6.3.1. Overview
- 8.6.3.2. Financial Performance (Net Revenue/Sales/EBITDA/Gross Profit)
- 8.6.3.3. Product Benchmarking
- 8.6.3.4. Strategic Initiatives
- 8.6.4 Merck Kgaa
- 8.6.4.1. Overview
- 8.6.4.2. Financial Performance (Net Revenue/Sales/EBITDA/Gross Profit)
- 8.6.4.3. Product Benchmarking
- 8.6.4.4. Strategic Initiatives
- 8.6.5 BD
- 8.6.5.1. Overview
- 8.6.5.2. Financial Performance (Net Revenue/Sales/EBITDA/Gross Profit)
- 8.6.5.3. Product Benchmarking
- 8.6.5.4. Strategic Initiatives
- 8.6.6 Qiagen
- 8.6.6.1. Overview
- 8.6.6.2. Financial Performance (Net Revenue/Sales/EBITDA/Gross Profit)
- 8.6.6.3. Product Benchmarking
- 8.6.6.4. Strategic Initiatives
- 8.6.7 Bio-Rad Laboratories Inc.
- 8.6.7.1. Overview
- 8.6.7.2. Financial Performance (Net Revenue/Sales/EBITDA/Gross Profit)
- 8.6.7.3. Product Benchmarking
- 8.6.7.4. Strategic Initiatives
- 8.6.8 Agilent Technologies, Inc.
- 8.6.8.1. Overview
- 8.6.8.2. Financial Performance (Net Revenue/Sales/EBITDA/Gross Profit)
- 8.6.8.3. Product Benchmarking
- 8.6.8.4. Strategic Initiatives
- 8.6.9 Hitachi, Ltd.
- 8.6.9.1. Overview
- 8.6.9.2. Financial Performance (Net Revenue/Sales/EBITDA/Gross Profit)
- 8.6.9.3. Product Benchmarking
- 8.6.9.4. Strategic Initiatives
- 8.6.10 F. Hoffmann-La Roche Ltd
- 8.6.10.1. Overview
- 8.6.10.2. Financial Performance (Net Revenue/Sales/EBITDA/Gross Profit)
- 8.6.10.3. Product Benchmarking
- 8.6.10.4. Strategic Initiatives
- 8.6.11 Bruker
- 8.6.11.1. Overview
- 8.6.11.2. Financial Performance (Net Revenue/Sales/EBITDA/Gross Profit)
- 8.6.11.3. Product Benchmarking
- 8.6.11.4. Strategic Initiatives
- 8.6.12 Oxford Instruments Plc
- 8.6.12.1. Overview
- 8.6.12.2. Financial Performance (Net Revenue/Sales/EBITDA/Gross Profit)
- 8.6.12.3. Product Benchmarking
- 8.6.12.4. Strategic Initiatives
- 8.6.13 Zeiss International
- 8.6.13.1. Overview
- 8.6.13.2. Financial Performance (Net Revenue/Sales/EBITDA/Gross Profit)
- 8.6.13.3. Product Benchmarking
- 8.6.13.4. Strategic Initiatives
- 8.6.14 Shimadzu Corporation
- 8.6.14.1. Overview
- 8.6.14.2. Financial Performance (Net Revenue/Sales/EBITDA/Gross Profit)
- 8.6.14.3. Product Benchmarking
- 8.6.14.4. Strategic Initiatives
- 8.6.1 Thermo Fisher Scientific Inc.