|
|
市場調査レポート
商品コード
1233085
カスタム抗体の市場規模、シェア、動向分析レポートタイプ別(モノクローナル)、サービス別(抗体開拓)、ソース別(マウス)、アプリケーション別、最終用途別、地域別、セグメント別予測、2023年~2030年Custom Antibody Market Size, Share & Trends Analysis Report By Type (Monoclonal), By Service (Antibody Development), By Source (Mice), By Application, By End-user, By Region, And Segment Forecasts, 2023 - 2030 |
||||||
|
|
|||||||
|
● お客様のご希望に応じて、既存データの加工や未掲載情報(例:国別セグメント)の追加などの対応が可能です。 詳細はお問い合わせください。 |
|||||||


| カスタム抗体の市場規模、シェア、動向分析レポートタイプ別(モノクローナル)、サービス別(抗体開拓)、ソース別(マウス)、アプリケーション別、最終用途別、地域別、セグメント別予測、2023年~2030年 |
|
出版日: 2023年02月01日
発行: Grand View Research
ページ情報: 英文 180 Pages
納期: 2~10営業日
|
- 全表示
- 概要
- 図表
- 目次
カスタム抗体市場の成長と動向
Grand View Research, Inc.の新しいレポートによると、世界のカスタム抗体市場規模は、2023年から2030年にかけて9.7%のCAGRで拡大し、2030年には3億170万米ドルに達すると予測されています。
同市場は、予測期間中に大幅な成長を遂げることが予想されます。この成長は、革新的な製品を開発するためのバイオテクノロジー新興企業による資金調達が増加していることに起因しています。さらに、新興市場における個別化診断や治療法に対する意識の高まりも、カスタム抗体市場の成長の一因となっています。
抗体の開発・生産におけるサービス拡充のための各社による投資の増加は、市場の成長をサポートすると考えられます。例えば、Absolute Antibody Ltd.は、カスタム抗体の配列、発現、エンジニアリングのサービスに参入しています。2022年8月、同社はラボスペースを増やし、次世代シーケンシング、精製、発現などの自動化技術に投資することで製造施設を拡張することを発表しました。この拡張により、組換え抗体の製造ワークフローが改善されることが期待されます。
同様に、各社はカスタム抗体の応用も向上させています。2023年1月に発表された記事によると、MilliporeSigmaは、Cell Marque Tissue Diagnostics技術による新しい抗体の開発を計画しています。ウサギポリクローナル抗体は、神経膠腫の一種であるATRXを検出するようカスタマイズされています。神経膠腫は中枢神経系に発生する腫瘍の30%を占める。この抗体により、神経病理分野でのポートフォリオの拡大が期待されます。
規制機関からの助成金による学術研究機関への金銭的支援や、企業によるサービスの割引提供は、予測期間中にカスタム抗体の発見と研究を促進すると予想されます。例えば、Absolute antibodyはカスタムサービスに対して10%の割引を提供しており、AltaBioscienceも同様の割引を期間限定で提供しています。このような割引により、研究者の全体的な生産コストが削減されることが期待されます。
しかし、カスタムモノクローナル抗体の製造コストが高いことが、カスタム抗体市場の成長を抑制することが予想されます。平均的な見積もりコストは約6,000~15,000米ドルです。このコストは、さまざまな新興企業や新興プレーヤーにとって、市場参入の障壁となっています。しかし、信頼性の高い製造試薬や技術を開発することで、初期費用を回避し、コストを削減することが可能です。
カスタム抗体市場レポートハイライト
- タイプ別では、2022年にはモノクローナル抗体分野がポリクローナルより相対的に成熟し、支配的な分野となると考えられています。企業別研究開発投資の増加は、カスタム抗体市場の成長をサポートすると予想されます。
- サービス別では、抗体開発分野が2022年のカスタム抗体市場シェアの大半を占めています。このサービス分野のプレイヤーの数とタイプは、抗体の生産と断片化よりも多く、これが成長に寄与しています。
- ソース別では、マウス分野が予測期間中に最も急速に成長すると予測されます。これは、マウスが広く入手可能な実験動物であり、カスタム抗体作製に容易に使用できるためです。
- 用途別では、感染症が2022年に最大の市場シェアを持つ主要セグメントとされており、この動向は予測期間中も維持されると思われます。この成長は、発展途上国における新興諸国の感染症に起因していると考えられます。
- 最終用途別では、学術・研究機関分野が2022年に最大の市場シェアを獲得し、急成長する分野と推定されます。この成長の背景には、政府や企業別助成金や資金援助が増加していることが挙げられます。
- 北米は、2022年の全体市場シェアの44.91%を占め、同市場において強力な地域的地位を確立しています。がんの罹患率の増加や研究開発費の高さが、同地域で製品開発に取り組む企業を後押ししています。
目次
第1章 調査手法と範囲
- 情報調達
- 情報またはデータ分析
- 市場範囲とセグメントの定義
- 市場モデル
- 市場調査、企業の市場シェア別
- 地域分析
第2章 エグゼクティブサマリー
- 市場のスナップショット
- セグメントのスナップショット
- 競合情勢のスナップショット
第3章 市場変数、動向、および範囲
- 市場セグメンテーションと範囲
- 市場系列の見通し
- 親市場の見通し
- 関連/補助的な市場の見通し
- 市場動向と展望
- 市場力学
- カスタマイズされた診断および治療に対する需要の増加
- プレイヤー間のコラボレーションとパートナーシップの容易さ
- 規制機関別イニシアチブの増加
- 市場抑制要因分析
- 高い生産コスト
- 2022年の浸透と成長の見通しマッピング
- 事業環境分析
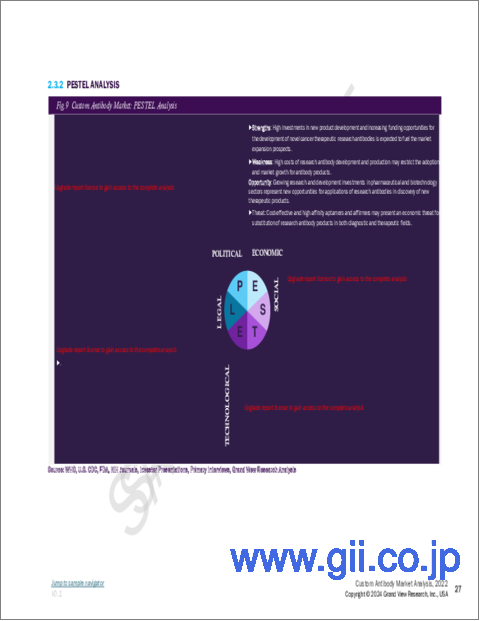
- SWOT分析;要因別(政治と法律、経済と技術)
- ポーターのファイブフォース分析
- COVID-19影響分析
第4章 タイプのビジネス分析
- カスタム抗体市場:型変動分析
- モノクローナル抗体
- ポリクローナル抗体
- 組換え抗体
- その他
第5章 サービスの事業分析
- カスタム抗体市場:サービス変動分析
- 抗体開発
- 抗体の産生と精製
- 抗体の断片化と標識
第6章 ソースのビジネス分析
- カスタム抗体市場:ソースの変動分析
- マウス
- うさぎ
- その他
第7章 アプリケーションのビジネス分析
- カスタム抗体市場:アプリケーションの変動分析
- 腫瘍学
- 感染症
- 神経学
- 幹細胞
- 免疫学
- 心血管疾患
- その他
第8章 エンドユーザーのビジネス分析
- カスタム抗体市場:エンドユーザーの変動分析
- 製薬およびバイオテクノロジー企業
- 学術・調査機関
- CRO
- 病院と診療所
第9章 地域ビジネス分析
- カスタム抗体市場シェア、地域別、2022年および2030年
- 北米
- SWOT分析
- 米国
- 主要な国のダイナミクス
- 対象疾患の有病率
- 競合シナリオ
- 規制の枠組み
- 償還シナリオ
- カナダ
- 主要な国のダイナミクス
- 対象疾患の有病率
- 競合シナリオ
- 規制の枠組み
- 償還シナリオ
- 欧州
- SWOT分析
- ドイツ
- 主要な国のダイナミクス
- 対象疾患の有病率
- 競合シナリオ
- 規制の枠組み
- 償還シナリオ
- 英国
- 主要な国のダイナミクス
- 対象疾患の有病率
- 競合シナリオ
- 規制の枠組み
- 償還シナリオ
- フランス
- 主要な国のダイナミクス
- 対象疾患の有病率
- 競合シナリオ
- 規制の枠組み
- 償還シナリオ
- イタリア
- 主要な国のダイナミクス
- 対象疾患の有病率
- 競合シナリオ
- 規制の枠組み
- 償還シナリオ
- スペイン
- 主要な国のダイナミクス
- 対象疾患の有病率
- 競合シナリオ
- 規制の枠組み
- 償還シナリオ
- デンマーク
- 主要な国のダイナミクス
- 対象疾患の有病率
- 競合シナリオ
- 規制の枠組み
- 償還シナリオ
- スウェーデン
- 主要な国のダイナミクス
- 対象疾患の有病率
- 競合シナリオ
- 規制の枠組み
- 償還シナリオ
- ノルウェー
- 主要な国のダイナミクス
- 対象疾患の有病率
- 競合シナリオ
- 規制の枠組み
- 償還シナリオ
- アジア太平洋地域
- SWOT分析
- 日本
- 主要な国のダイナミクス
- 対象疾患の有病率
- 競合シナリオ
- 規制の枠組み
- 償還シナリオ
- 中国
- 主要な国のダイナミクス
- 対象疾患の有病率
- 競合シナリオ
- 規制の枠組み
- 償還シナリオ
- インド
- 主要な国のダイナミクス
- 対象疾患の有病率
- 競合シナリオ
- 規制の枠組み
- 償還シナリオ
- 韓国
- 主要な国のダイナミクス
- 対象疾患の有病率
- 競合シナリオ
- 規制の枠組み
- 償還シナリオ
- オーストラリア
- 主要な国のダイナミクス
- 対象疾患の有病率
- 競合シナリオ
- 規制の枠組み
- 償還シナリオ
- タイ
- 主要な国のダイナミクス
- 対象疾患の有病率
- 競合シナリオ
- 規制の枠組み
- 償還シナリオ
- ラテンアメリカ
- SWOT分析
- ブラジル
- 主要な国のダイナミクス
- 対象疾患の有病率
- 競合シナリオ
- 規制の枠組み
- 償還シナリオ
- メキシコ
- 主要な国のダイナミクス
- 対象疾患の有病率
- 競合シナリオ
- 規制の枠組み
- 償還シナリオ
- アルゼンチン
- 主要な国のダイナミクス
- 対象疾患の有病率
- 競合シナリオ
- 規制の枠組み
- 償還シナリオ
- MEA
- SWOT分析
- 南アフリカ
- 主要な国のダイナミクス
- 対象疾患の有病率
- 競合シナリオ
- 規制の枠組み
- 償還シナリオ
- サウジアラビア
- 主要な国のダイナミクス
- 対象疾患の有病率
- 競合シナリオ
- 規制の枠組み
- 償還シナリオ
- アラブ首長国連邦
- 主要な国のダイナミクス
- 対象疾患の有病率
- 競合シナリオ
- 規制の枠組み
- 償還シナリオ
- クウェート
- 主要な国のダイナミクス
- 対象疾患の有病率
- 競合シナリオ
- 規制の枠組み
- 償還シナリオ
第10章 競合情勢
- 参加企業の概要
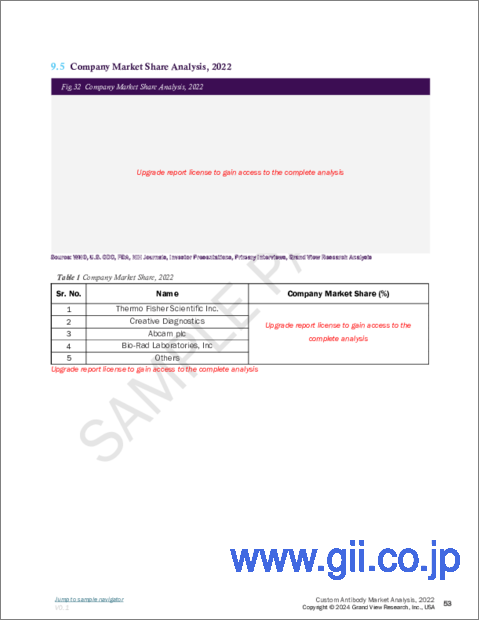
- Thermo Fisher Scientific Inc.
- Creative Diagnostics
- Abcam plc
- Bio-Rad Laboratories, Inc
- Kaneka Eurogentec S.A.
- YenZym Antibodies, LLC.
- Abmart
- Labcorp Drug Development
- LifeSpan BioSciences, Inc
- GenScript
- 財務業績
- 参加企業の分類
- 市場のリーダー
- カスタム抗体の市場シェア分析、2022年
- 戦略マッピング
- 拡張
- 取得
- コラボレーション
- 製品/サービスの発売
- パートナーシップ
- その他
List of Tables
- Table 1 List of Secondary Sources
- Table 2 List of Abbreviations
- Table 3 Global Custom Antibody Market, by Type, 2018 - 2030 (USD Million)
- Table 4 Global Custom Antibody Market, by Service, 2018 - 2030 (USD Million)
- Table 5 Global Custom Antibody Market, by Source, 2018 - 2030 (USD Million)
- Table 6 Global Custom Antibody Market, by Application, 2018 - 2030 (USD Million)
- Table 7 Global Custom Antibody Market, by End-user, 2018 - 2030 (USD Million)
- Table 8 Global Custom Antibody Market, by Region, 2018 - 2030 (USD Million)
- Table 9 North America Custom Antibody Market, by Country, 2018 - 2030 (USD Million)
- Table 10 North America Custom Antibody Market, by Type, 2018 - 2030 (USD Million)
- Table 11 North America Custom Antibody Market, by Service, 2018 - 2030 (USD Million)
- Table 12 North America Custom Antibody Market, by Source, 2018 - 2030 (USD Million)
- Table 13 North America Custom Antibody Market, by Application, 2018 - 2030 (USD Million)
- Table 14 North America Custom Antibody Market, by End-user, 2018 - 2030 (USD Million)
- Table 15 U.S. Custom Antibody Market, by Type, 2018 - 2030 (USD Million)
- Table 16 U.S. Custom Antibody Market, by Service, 2018 - 2030 (USD Million)
- Table 17 U.S. Custom Antibody Market, by Source, 2018 - 2030 (USD Million)
- Table 18 U.S. Custom Antibody Market, by Application, 2018 - 2030 (USD Million)
- Table 19 U.S. Custom Antibody Market, by End-user, 2018 - 2030 (USD Million)
- Table 20 Canada Custom Antibody Market, by Type, 2018 - 2030 (USD Million)
- Table 21 Canada Custom Antibody Market, by Service, 2018 - 2030 (USD Million)
- Table 22 Canada Custom Antibody Market, by Source, 2018 - 2030 (USD Million)
- Table 23 Canada Custom Antibody Market, by Application, 2018 - 2030 (USD Million)
- Table 24 Canada Custom Antibody Market, by End-user, 2018 - 2030 (USD Million)
- Table 25 Europe Custom Antibody Market, by Country, 2018 - 2030 (USD Million)
- Table 26 Europe Custom Antibody Market, by Type, 2018 - 2030 (USD Million)
- Table 27 Europe Custom Antibody Market, by Service, 2018 - 2030 (USD Million)
- Table 28 Europe Custom Antibody Market, by Source, 2018 - 2030 (USD Million)
- Table 29 Europe Custom Antibody Market, by Application, 2018 - 2030 (USD Million)
- Table 30 Europe Custom Antibody Market, by End-user, 2018 - 2030 (USD Million)
- Table 31 Germany Custom Antibody Market, by Type, 2018 - 2030 (USD Million)
- Table 32 Germany Custom Antibody Market, by Service, 2018 - 2030 (USD Million)
- Table 33 Germany Custom Antibody Market, by Source, 2018 - 2030 (USD Million)
- Table 34 Germany Custom Antibody Market, by Application, 2018 - 2030 (USD Million)
- Table 35 Germany Custom Antibody Market, by End-user, 2018 - 2030 (USD Million)
- Table 36 UK Custom Antibody Market, by Type, 2018 - 2030 (USD Million)
- Table 37 UK Custom Antibody Market, by Service, 2018 - 2030 (USD Million)
- Table 38 UK Custom Antibody Market, by Source, 2018 - 2030 (USD Million)
- Table 39 UK Custom Antibody Market, by Application, 2018 - 2030 (USD Million)
- Table 40 UK Custom Antibody Market, by End-user, 2018 - 2030 (USD Million)
- Table 41 France Custom Antibody Market, by Type, 2018 - 2030 (USD Million)
- Table 42 France Custom Antibody Market, by Service, 2018 - 2030 (USD Million)
- Table 43 France Custom Antibody Market, by Source, 2018 - 2030 (USD Million)
- Table 44 France Custom Antibody Market, by Application, 2018 - 2030 (USD Million)
- Table 45 France Custom Antibody Market, by End-user, 2018 - 2030 (USD Million)
- Table 46 Italy Custom Antibody Market, by Type, 2018 - 2030 (USD Million)
- Table 47 Italy Custom Antibody Market, by Service, 2018 - 2030 (USD Million)
- Table 48 Italy Custom Antibody Market, by Source, 2018 - 2030 (USD Million)
- Table 49 Italy Custom Antibody Market, by Application, 2018 - 2030 (USD Million)
- Table 50 Italy Custom Antibody Market, by End-user, 2018 - 2030 (USD Million)
- Table 51 Spain Custom Antibody Market, by Type, 2018 - 2030 (USD Million)
- Table 52 Spain Custom Antibody Market, by Service, 2018 - 2030 (USD Million)
- Table 53 Spain Custom Antibody Market, by Source, 2018 - 2030 (USD Million)
- Table 54 Spain Custom Antibody Market, by Application, 2018 - 2030 (USD Million)
- Table 55 Spain Custom Antibody Market, by End-user, 2018 - 2030 (USD Million)
- Table 56 Denmark Custom Antibody Market, by Type, 2018 - 2030 (USD Million)
- Table 57 Denmark Custom Antibody Market, by Service, 2018 - 2030 (USD Million)
- Table 58 Denmark Custom Antibody Market, by Source, 2018 - 2030 (USD Million)
- Table 59 Denmark Custom Antibody Market, by Application, 2018 - 2030 (USD Million)
- Table 60 Denmark Custom Antibody Market, by End-user, 2018 - 2030 (USD Million)
- Table 61 Sweden Custom Antibody Market, by Type, 2018 - 2030 (USD Million)
- Table 62 Sweden Custom Antibody Market, by Service, 2018 - 2030 (USD Million)
- Table 63 Sweden Custom Antibody Market, by Source, 2018 - 2030 (USD Million)
- Table 64 Sweden Custom Antibody Market, by Application, 2018 - 2030 (USD Million)
- Table 65 Sweden Custom Antibody Market, by End-user, 2018 - 2030 (USD Million)
- Table 66 Norway Custom Antibody Market, by Type, 2018 - 2030 (USD Million)
- Table 67 Norway Custom Antibody Market, by Service, 2018 - 2030 (USD Million)
- Table 68 Norway Custom Antibody Market, by Source, 2018 - 2030 (USD Million)
- Table 69 Norway Custom Antibody Market, by Application, 2018 - 2030 (USD Million)
- Table 70 Norway Custom Antibody Market, by End-user, 2018 - 2030 (USD Million)
- Table 71 Asia Pacific Custom Antibody Market, by Country, 2018 - 2030 (USD Million)
- Table 72 Asia Pacific Custom Antibody Market, by Type, 2018 - 2030 (USD Million)
- Table 73 Asia Pacific Custom Antibody Market, by Service, 2018 - 2030 (USD Million)
- Table 74 Asia Pacific Custom Antibody Market, by Source, 2018 - 2030 (USD Million)
- Table 75 Asia Pacific Custom Antibody Market, by Application, 2018 - 2030 (USD Million)
- Table 76 Asia Pacific Custom Antibody Market, by End-user, 2018 - 2030 (USD Million)
- Table 77 China Custom Antibody Market, by Type, 2018 - 2030 (USD Million)
- Table 78 China Custom Antibody Market, by Service, 2018 - 2030 (USD Million)
- Table 79 China Custom Antibody Market, by Source, 2018 - 2030 (USD Million)
- Table 80 China Custom Antibody Market, by Application, 2018 - 2030 (USD Million)
- Table 81 China Custom Antibody Market, by End-user, 2018 - 2030 (USD Million)
- Table 82 Japan Custom Antibody Market, by Type, 2018 - 2030 (USD Million)
- Table 83 Japan Custom Antibody Market, by Service, 2018 - 2030 (USD Million)
- Table 84 Japan Custom Antibody Market, by Source, 2018 - 2030 (USD Million)
- Table 85 Japan Custom Antibody Market, by Application, 2018 - 2030 (USD Million)
- Table 86 Japan Custom Antibody Market, by End-user, 2018 - 2030 (USD Million)
- Table 87 India Custom Antibody Market, by Type, 2018 - 2030 (USD Million)
- Table 88 India Custom Antibody Market, by Service, 2018 - 2030 (USD Million)
- Table 89 India Custom Antibody Market, by Source, 2018 - 2030 (USD Million)
- Table 90 India Custom Antibody Market, by Application, 2018 - 2030 (USD Million)
- Table 91 India Custom Antibody Market, by End-user, 2018 - 2030 (USD Million)
- Table 92 South Korea Custom Antibody Market, by Type, 2018 - 2030 (USD Million)
- Table 93 South Korea Custom Antibody Market, by Service, 2018 - 2030 (USD Million)
- Table 94 South Korea Custom Antibody Market, by Source, 2018 - 2030 (USD Million)
- Table 95 South Korea Custom Antibody Market, by Application, 2018 - 2030 (USD Million)
- Table 96 South Korea Custom Antibody Market, by End-user, 2018 - 2030 (USD Million)
- Table 97 Australia Custom Antibody Market, by Type, 2018 - 2030 (USD Million)
- Table 98 Australia Custom Antibody Market, by Service, 2018 - 2030 (USD Million)
- Table 99 Australia Custom Antibody Market, by Source, 2018 - 2030 (USD Million)
- Table 100 Australia Custom Antibody Market, by Application, 2018 - 2030 (USD Million)
- Table 101 Australia Custom Antibody Market, by End-user, 2018 - 2030 (USD Million)
- Table 102 Thailand Custom Antibody Market, by Type, 2018 - 2030 (USD Million)
- Table 103 Thailand Custom Antibody Market, by Service, 2018 - 2030 (USD Million)
- Table 104 Thailand Custom Antibody Market, by Source, 2018 - 2030 (USD Million)
- Table 105 Thailand Custom Antibody Market, by Application, 2018 - 2030 (USD Million)
- Table 106 Thailand Custom Antibody Market, by End-user, 2018 - 2030 (USD Million)
- Table 107 Latin America Custom Antibody Market, by Country, 2018 - 2030 (USD Million)
- Table 108 Latin America Custom Antibody Market, by Type, 2018 - 2030 (USD Million)
- Table 109 Latin America Custom Antibody Market, by Service, 2018 - 2030 (USD Million)
- Table 110 Latin America Custom Antibody Market, by Source, 2018 - 2030 (USD Million)
- Table 111 Latin America Custom Antibody Market, by Application, 2018 - 2030 (USD Million)
- Table 112 Latin America Custom Antibody Market, by End-user, 2018 - 2030 (USD Million)
- Table 113 Brazil Custom Antibody Market, by Type, 2018 - 2030 (USD Million)
- Table 114 Brazil Custom Antibody Market, by Service, 2018 - 2030 (USD Million)
- Table 115 Brazil Custom Antibody Market, by Source, 2018 - 2030 (USD Million)
- Table 116 Brazil Custom Antibody Market, by Application, 2018 - 2030 (USD Million)
- Table 117 Brazil Custom Antibody Market, by End-user, 2018 - 2030 (USD Million)
- Table 118 Mexico Custom Antibody Market, by Type, 2018 - 2030 (USD Million)
- Table 119 Mexico Custom Antibody Market, by Service, 2018 - 2030 (USD Million)
- Table 120 Mexico Custom Antibody Market, by Source, 2018 - 2030 (USD Million)
- Table 121 Mexico Custom Antibody Market, by Application, 2018 - 2030 (USD Million)
- Table 122 Mexico Custom Antibody Market, by End-user, 2018 - 2030 (USD Million)
- Table 123 Argentina Custom Antibody Market, by Type, 2018 - 2030 (USD Million)
- Table 124 Argentina Custom Antibody Market, by Service, 2018 - 2030 (USD Million)
- Table 125 Argentina Custom Antibody Market, by Source, 2018 - 2030 (USD Million)
- Table 126 Argentina Custom Antibody Market, by Application, 2018 - 2030 (USD Million)
- Table 127 Argentina Custom Antibody Market, by End-user, 2018 - 2030 (USD Million)
- Table 128 Middle East & Africa Custom Antibody Market, by Type, 2018 - 2030 (USD Million)
- Table 129 Middle East & Africa Custom Antibody Market, by Service, 2018 - 2030 (USD Million)
- Table 130 Middle East & Africa Custom Antibody Market, by Source, 2018 - 2030 (USD Million)
- Table 131 Middle East & Africa Custom Antibody Market, by Application, 2018 - 2030 (USD Million)
- Table 132 Middle East & Africa Custom Antibody Market, by End-user, 2018 - 2030 (USD Million)
- Table 133 Middle East & Africa Custom Antibody Market, by Type, 2018 - 2030 (USD Million)
- Table 134 South Africa Custom Antibody Market, by Service, 2018 - 2030 (USD Million)
- Table 135 South Africa Custom Antibody Market, by Source, 2018 - 2030 (USD Million)
- Table 136 South Africa Custom Antibody Market, by Application, 2018 - 2030 (USD Million)
- Table 137 South Africa Custom Antibody Market, by End-user, 2018 - 2030 (USD Million)
- Table 138 South Africa Custom Antibody Market, by Type, 2018 - 2030 (USD Million)
- Table 139 Saudi Arabia Custom Antibody Market, by Service, 2018 - 2030 (USD Million)
- Table 140 Saudi Arabia Custom Antibody Market, by Source, 2018 - 2030 (USD Million)
- Table 141 Saudi Arabia Custom Antibody Market, by Application, 2018 - 2030 (USD Million)
- Table 142 Saudi Arabia Custom Antibody Market, by End-user, 2018 - 2030 (USD Million)
- Table 143 Saudi Arabia Custom Antibody Market, by Type, 2018 - 2030 (USD Million)
- Table 144 UAE Custom Antibody Market, by Service, 2018 - 2030 (USD Million)
- Table 145 UAE Custom Antibody Market, by Source, 2018 - 2030 (USD Million)
- Table 146 UAE Custom Antibody Market, by Application, 2018 - 2030 (USD Million)
- Table 147 UAE Custom Antibody Market, by End-user, 2018 - 2030 (USD Million)
- Table 148 UAE Custom Antibody Market, by Type, 2018 - 2030 (USD Million)
- Table 149 Kuwait Custom Antibody Market, by Service, 2018 - 2030 (USD Million)
- Table 150 Kuwait Custom Antibody Market, by Source, 2018 - 2030 (USD Million)
- Table 151 Kuwait Custom Antibody Market, by Application, 2018 - 2030 (USD Million)
- Table 152 Kuwait Custom Antibody Market, by End-user, 2018 - 2030 (USD Million)
List of Figures
- Fig. 1 Market research process
- Fig. 2 Information Procurement
- Fig. 3 Primary Research Pattern
- Fig. 4 Market Research Approaches
- Fig. 5 Value Chain-Based Sizing & Forecasting
- Fig. 6 Market Formulation & Validation
- Fig. 7 Custom Antibody Market Segmentation
- Fig. 8 Market Snapshot, 2022
- Fig. 9 Market Trends & Outlook
- Fig. 10 Market Driver Relevance Analysis (Current & Future Impact)
- Fig. 11 Market Restraint Relevance Analysis (Current & Future Impact)
- Fig. 12 Market Challenge Relevance Analysis (Current & Future Impact)
- Fig. 13 SWOT Analysis, By Factor (Political & Legal, Economic and Technological)
- Fig. 14 Porter's Five Forces Analysis
- Fig. 15 Market Penetration Vs Growth Prospect Mapping, 2022
- Fig. 16 Global Custom Antibody Market: Type Movement Analysis
- Fig. 17 Global Custom Antibody Market, for Monoclonal antibodies, 2018 - 2030 (USD Million)
- Fig. 18 Global Custom Antibody Market, for Polyclonal Antibodies, 2018 - 2030 (USD Million)
- Fig. 19 Global Custom Antibody Market, for Recombinant Antibodies, 2018 - 2030 (USD Million)
- Fig. 20 Global Custom Antibody Market, for Others, 2018 - 2030 (USD Million)
- Fig. 21 Global Custom Antibody Market: Service Movement Analysis
- Fig. 22 Global Custom Antibody Market, for Antibody development, 2018 - 2030 (USD Million)
- Fig. 23 Global Custom Antibody Market, for Antibody production & Purification, 2018 - 2030 (USD Million)
- Fig. 24 Global Custom Antibody Market, for Antibody Fragmentation & labelling, 2018 - 2030 (USD Million)
- Fig. 25 Global Custom Antibody Market: Source Movement Analysis
- Fig. 26 Global Custom Antibody Market, for Mice, 2018 - 2030 (USD Million)
- Fig. 27 Global Custom Antibody Market, for Rabbit, 2018 - 2030 (USD Million)
- Fig. 28 Global Custom Antibody Market, for Others, 2018 - 2030 (USD Million)
- Fig. 29 Global Custom Antibody Market: Application Movement Analysis
- Fig. 30 Global Custom Antibody Market, for Oncology, 2018 - 2030 (USD Million)
- Fig. 31 Global Custom Antibody Market, for Infectious Diseases, 2018 - 2030 (USD Million)
- Fig. 32 Global Custom Antibody Market, for Neurology, 2018 - 2030 (USD Million)
- Fig. 33 Global Custom Antibody Market, for Stem cells, 2018 - 2030 (USD Million)
- Fig. 34 Global Custom Antibody Market, for Immunology, 2018 - 2030 (USD Million)
- Fig. 35 Global Custom Antibody Market, for Cardiovascular Diseases, 2018 - 2030 (USD Million)
- Fig. 36 Global Custom Antibody Market, for Others, 2018 - 2030 (USD Million)
- Fig. 37 Global Custom Antibody Market: End-user Movement Analysis
- Fig. 38 Global Custom Antibody Market, for Pharmaceutical & Biotechnology Companies, 2018 - 2030 (USD Million)
- Fig. 39 Global Custom Antibody Market, for Academic & Research Institutes, 2018 - 2030 (USD Million)
- Fig. 40 Global Custom Antibody Market, for CRO, 2018 - 2030 (USD Million)
- Fig. 41 Global Custom Antibody Market, for Hospitals and Clinics, 2018 - 2030 (USD Million)
- Fig. 42 Regional Marketplace: Key Takeaways
- Fig. 43 Regional Outlook, 2022 & 2030
- Fig. 44 Global Custom Antibody Market: Region Movement Analysis
- Fig. 45 North America Custom Antibody Market, 2018 - 2030 (USD Million)
- Fig. 46 U.S. Custom Antibody Market, 2018 - 2030 (USD Million)
- Fig. 47 Canada Custom Antibody Market, 2018 - 2030 (USD Million)
- Fig. 48 Europe Custom Antibody Market, 2018 - 2030 (USD Million)
- Fig. 49 Germany Custom Antibody Market, 2018 - 2030 (USD Million)
- Fig. 50 UK Custom Antibody Market, 2018 - 2030 (USD Million)
- Fig. 51 France Custom Antibody Market, 2018 - 2030 (USD Million)
- Fig. 52 Italy Custom Antibody Market, 2018 - 2030 (USD Million)
- Fig. 53 Spain Custom Antibody Market, 2018 - 2030 (USD Million)
- Fig. 54 Denmark Custom Antibody Market, 2018 - 2030 (USD Million)
- Fig. 55 Sweden Custom Antibody Market, 2018 - 2030 (USD Million)
- Fig. 56 Norway Custom Antibody Market, 2018 - 2030 (USD Million)
- Fig. 57 Asia Pacific Custom Antibody Market, 2018 - 2030 (USD Million)
- Fig. 58 Japan Custom Antibody Market, 2018 - 2030 (USD Million)
- Fig. 59 China Custom Antibody Market, 2018 - 2030 (USD Million)
- Fig. 60 India Custom Antibody Market, 2018 - 2030 (USD Million)
- Fig. 61 Australia Custom Antibody Market, 2018 - 2030 (USD Million)
- Fig. 62 South Korea Custom Antibody Market, 2018 - 2030 (USD Million)
- Fig. 63 Thailand Custom Antibody Market, 2018 - 2030 (USD Million)
- Fig. 64 Latin America Custom Antibody Market, 2018 - 2030 (USD Million)
- Fig. 65 Brazil Custom Antibody Market, 2018 - 2030 (USD Million)
- Fig. 66 Mexico Custom Antibody Market, 2018 - 2030 (USD Million)
- Fig. 67 Argentina Custom Antibody Market, 2018 - 2030 (USD Million)
- Fig. 68 Middle East and Africa Custom Antibody Market, 2018 - 2030 (USD Million)
- Fig. 69 South Africa Custom Antibody Market, 2018 - 2030 (USD Million)
- Fig. 70 Saudi Arabia Custom Antibody Market, 2018 - 2030 (USD Million)
- Fig. 71 UAE Custom Antibody Market, 2018 - 2030 (USD Million)
- Fig. 72 Kuwait Custom Antibody Market, 2018 - 2030 (USD Million)
Custom Antibody Market Growth & Trends:
The global custom antibody market size is expected to reach USD 301.7 million by 2030, expanding at a CAGR of 9.7% from 2023 to 2030, according to a new report by Grand View Research, Inc. The market is expected to witness substantial growth during the forecast period. This growth is attributed to the increasing fundraising by biotech startups for developing innovative products. Additionally, rising awareness of personalized diagnostic and therapeutic treatments in emerging markets is also a contributing factor to the growth of the custom antibody market.
Increasing investment by the players to expand their services in the development and production of antibodies is likely to support the growth of the market. For instance, Absolute Antibody Ltd. is into the services of custom antibody sequencing, expression, and engineering. In August 2022, the company announced the expansion of its manufacturing facility by increasing the lab space and investing in automated technology such as next-generation sequencing, purification, and expression. The expansion is expected to improve the production workflow for recombinant antibodies.
Similarly, companies are also improving the application of custom antibodies. According to an article published in January 2023, MilliporeSigma is planning to develop new antibodies through its Cell Marque Tissue Diagnostics technology. The rabbit polyclonal antibody is customized to detect a type of glioma, ATRX. Gliomas account for 30% of tumors in the central nervous system. Through this antibody, the company is anticipated to expand its portfolio in neuropathology.
Monetary support to academic and research institutions through grants from regulatory bodies and discount offers on services by companies are anticipated to enhance custom antibody discovery and research during the forecast period. For instance, Absolute antibody offers 10% off on custom services, while a similar discount is also offered by AltaBioscience for a limited time period. The discounts are expected to reduce the overall cost of production for researchers.
However, the high cost of producing custom monoclonal antibodies is expected to restrain the growth of the custom antibody market. The average estimated cost is around USD 6,000 to 15,000. The cost acts as a market entry barrier for various startups and emerging players. However, the cost can be reduced by developing reliable production reagents and techniques to avoid the upfront cost.
Custom Antibody Market Report Highlights:
- By type, the monoclonal antibody segment is considered to be a relatively more mature and dominant segment than polyclonal in 2022. The increasing R&D investment by companies is expected to support the growth of the custom antibody market
- By service, the antibody development segment captured the majority of the custom antibody market share in 2022. The number and type of players in this service segment are greater than antibody production and fragmentation, which is contributing to the growth
- By source, the mice segment is estimated to be the fastest-growing during the forecast period. This is because mice are widely available lab animals and can be easily used for custom antibody production
- By application, infectious disease is considered the key segment with the largest market share in 2022, and this trend is likely to be maintained over the forecast period. This growth can be attributed to the emerging infectious diseases in developing countries
- By end-users, the academic and research institutions segment is estimated to be the fastest-growing segment, with the largest market share in 2022. The growth is attributed to the increasing grants and financial assistance from governments and companies
- North America has established a strong regional position in the market with 44.91% of the overall market share in 2022. The increasing incidence rate of cancer and high R&D expenditure are encouraging companies to undertake product development in the region
Table of Contents
Chapter 1. Methodology and Scope
- 1.1. Information Procurement
- 1.2. Information or Data Analysis
- 1.3. Market Scope & Segment Definition
- 1.4. Market Model
- 1.4.1. Market Study, By Company Market Share
- 1.4.2. Regional Analysis
Chapter 2. Executive Summary
- 2.1. Market Snapshot
- 2.2. Segment Snapshot
- 2.3. Competitive Landscape Snapshot
Chapter 3. Market Variables, Trends, & Scope
- 3.1. Market Segmentation and Scope
- 3.2. Market Lineage Outlook
- 3.2.1. Parent Market Outlook
- 3.2.2. Related/Ancillary Market Outlook
- 3.3. Market Trends and Outlook
- 3.4. Market Dynamics
- 3.4.1. Increasing demand for customized diagnostics and therapeutics
- 3.4.2. Ease of collaboration and partnerships amongst players
- 3.4.3. Increasing initiatives by the regulatory bodies
- 3.5. Market Restraint Analysis
- 3.5.1. High cost of production
- 3.6. Penetration and Growth Prospect Mapping 2022
- 3.7. Business Environment Analysis
- 3.7.1. SWOT Analysis; By Factor (Political & Legal, Economic And Technological)
- 3.7.2. Porter's Five Forces Analysis
- 3.8. COVID-19 Impact Analysis
Chapter 4. Type Business Analysis
- 4.1. Custom Antibody Market: Type Movement Analysis
- 4.2. Monoclonal Antibodies
- 4.2.1. Monoclonal Antibodies Market, 2018 - 2030 (USD Million)
- 4.3. Polyclonal Antibodies
- 4.3.1. Polyclonal Antibodies Market, 2018 - 2030 (USD Million)
- 4.4. Recombinant Antibodies
- 4.4.1. Recombinant Antibodies Market, 2018 - 2030 (USD Million)
- 4.5. Others
- 4.5.1. Others Market, 2018 - 2030 (USD Million)
Chapter 5. Service Business Analysis
- 5.1. Custom Antibody Market: Service Movement Analysis
- 5.2. Antibody Development
- 5.2.1. Antibody Development Market, 2018 - 2030 (USD Million)
- 5.3. Antibody Production & Purification
- 5.3.1. Antibody Production & Purification Market, 2018 - 2030 (USD Million)
- 5.4. Antibody Fragmentation & Labelling
- 5.4.1. Antibody Fragmentation & Labelling Market, 2018 - 2030 (USD Million)
Chapter 6. Source Business Analysis
- 6.1. Custom Antibody Market: Source Movement Analysis
- 6.2. Mice
- 6.2.1. Mice Market, 2018 - 2030 (USD Million)
- 6.3. Rabbit
- 6.3.1. Rabbit Market, 2018 - 2030 (USD Million)
- 6.4. Others
- 6.4.1. Others Market, 2018 - 2030 (USD Million)
Chapter 7. Application Business Analysis
- 7.1. Custom Antibody Market: Application Movement Analysis
- 7.2. Oncology
- 7.2.1. Oncology Market, 2018 - 2030 (USD Million)
- 7.3. Infectious Diseases
- 7.3.1. Infectious Diseases Market, 2018 - 2030 (USD Million)
- 7.4. Neurology
- 7.4.1. Neurology Market, 2018 - 2030 (USD Million)
- 7.5. Stem cells
- 7.5.1. Stem cells Market, 2018 - 2030 (USD Million)
- 7.6. Immunology
- 7.6.1. Immunology Market, 2018 - 2030 (USD Million)
- 7.7. Cardiovascular Diseases
- 7.7.1. Cardiovascular Diseases Market, 2018 - 2030 (USD Million)
- 7.8. Others
- 7.8.1. Others Market, 2018 - 2030 (USD Million)
Chapter 8. End-user Business Analysis
- 8.1. Custom Antibody Market: End-user Movement Analysis
- 8.2. Pharmaceutical & Biotechnology Companies
- 8.2.1. Pharmaceutical & Biotechnology Companies Market, 2018 - 2030 (USD Million)
- 8.3. Academic & Research Institutes
- 8.3.1. Academic & Research Institutes Market, 2018 - 2030 (USD Million)
- 8.4. CRO
- 8.4.1. CRO Market, 2018 - 2030 (USD Million)
- 8.5. Hospitals and Clinics
- 8.5.1. Hospitals and Clinics Market, 2018 - 2030 (USD Million)
Chapter 9. Regional Business Analysis
- 9.1. Custom Antibody Market Share By Region, 2022 & 2030
- 9.2. North America
- 9.2.1. SWOT Analysis
- 9.2.2. North America Custom Antibody Market, 2018 - 2030 (USD Million)
- 9.2.3. U.S.
- 9.2.3.1. Key Country Dynamics
- 9.2.3.2. Target Disease Prevalence
- 9.2.3.3. Competitive Scenario
- 9.2.3.4. Regulatory Framework
- 9.2.3.5. Reimbursement Scenario
- 9.2.3.6. U.S. Custom Antibody Market, 2018 - 2030 (USD MILLION)
- 9.2.4. Canada
- 9.2.4.1. Key Country Dynamics
- 9.2.4.2. Target Disease Prevalence
- 9.2.4.3. Competitive Scenario
- 9.2.4.4. Regulatory Framework
- 9.2.4.5. Reimbursement Scenario
- 9.2.4.6. Canada Custom Antibody Market, 2018 - 2030 (USD Million)
- 9.3. Europe
- 9.3.1. SWOT Analysis
- 9.3.2. Europe Custom Antibody Market, 2018 - 2030 (USD Million)
- 9.3.3. Germany
- 9.3.3.1. Key Country Dynamics
- 9.3.3.2. Target Disease Prevalence
- 9.3.3.3. Competitive Scenario
- 9.3.3.4. Regulatory Framework
- 9.3.3.5. Reimbursement Scenario
- 9.3.3.6. Germany Custom Antibody Market, 2018 - 2030 (USD Million)
- 9.3.4. UK
- 9.3.4.1. Key Country Dynamics
- 9.3.4.2. Target Disease Prevalence
- 9.3.4.3. Competitive Scenario
- 9.3.4.4. Regulatory Framework
- 9.3.4.5. Reimbursement Scenario
- 9.3.4.6. UK Custom Antibody Market, 2018 - 2030 (USD Million)
- 9.3.5. France
- 9.3.5.1. Key Country Dynamics
- 9.3.5.2. Target Disease Prevalence
- 9.3.5.3. Competitive Scenario
- 9.3.5.4. Regulatory Framework
- 9.3.5.5. Reimbursement Scenario
- 9.3.5.6. France Custom Antibody Market, 2018 - 2030 (USD Million)
- 9.3.6. Italy
- 9.3.6.1. Key Country Dynamics
- 9.3.6.2. Target Disease Prevalence
- 9.3.6.3. Competitive Scenario
- 9.3.6.4. Regulatory Framework
- 9.3.6.5. Reimbursement Scenario
- 9.3.6.6. Italy Custom Antibody Market, 2018 - 2030 (USD Million)
- 9.3.7. Spain
- 9.3.7.1. Key Country Dynamics
- 9.3.7.2. Target Disease Prevalence
- 9.3.7.3. Competitive Scenario
- 9.3.7.4. Regulatory Framework
- 9.3.7.5. Reimbursement Scenario
- 9.3.7.6. Spain Custom Antibody Market, 2018 - 2030 (USD Million)
- 9.3.8. Denmark
- 9.3.8.1. Key Country Dynamics
- 9.3.8.2. Target Disease Prevalence
- 9.3.8.3. Competitive Scenario
- 9.3.8.4. Regulatory Framework
- 9.3.8.5. Reimbursement Scenario
- 9.3.8.6. Denmark Custom Antibody Market, 2018 - 2030 (USD Million)
- 9.3.9. Sweden
- 9.3.9.1. Key Country Dynamics
- 9.3.9.2. Target Disease Prevalence
- 9.3.9.3. Competitive Scenario
- 9.3.9.4. Regulatory Framework
- 9.3.9.5. Reimbursement Scenario
- 9.3.9.6. Sweden Custom Antibody Market, 2018 - 2030 (USD Million)
- 9.3.10. Norway
- 9.3.10.1. Key Country Dynamics
- 9.3.10.2. Target Disease Prevalence
- 9.3.10.3. Competitive Scenario
- 9.3.10.4. Regulatory Framework
- 9.3.10.5. Reimbursement Scenario
- 9.3.10.6. Norway Custom Antibody Market, 2018 - 2030 (USD Million)
- 9.4. Asia Pacific
- 9.4.1. SWOT Analysis
- 9.4.2. Asia Pacific Custom Antibody Market, 2018 - 2030 (USD Million)
- 9.4.3. Japan
- 9.4.3.1. Key Country Dynamics
- 9.4.3.2. Target Disease Prevalence
- 9.4.3.3. Competitive Scenario
- 9.4.3.4. Regulatory Framework
- 9.4.3.5. Reimbursement Scenario
- 9.4.3.6. Japan Custom Antibody Market, 2018 - 2030 (USD Million)
- 9.4.4. China
- 9.4.4.1. Key Country Dynamics
- 9.4.4.2. Target Disease Prevalence
- 9.4.4.3. Competitive Scenario
- 9.4.4.4. Regulatory Framework
- 9.4.4.5. Reimbursement Scenario
- 9.4.4.6. China Custom Antibody Market, 2018 - 2030 (USD Million)
- 9.4.5. India
- 9.4.5.1. Key Country Dynamics
- 9.4.5.2. Target Disease Prevalence
- 9.4.5.3. Competitive Scenario
- 9.4.5.4. Regulatory Framework
- 9.4.5.5. Reimbursement Scenario
- 9.4.5.6. India Custom Antibody Market, 2018 - 2030 (USD Million)
- 9.4.6. South Korea
- 9.4.6.1. Key Country Dynamics
- 9.4.6.2. Target Disease Prevalence
- 9.4.6.3. Competitive Scenario
- 9.4.6.4. Regulatory Framework
- 9.4.6.5. Reimbursement Scenario
- 9.4.6.6. South Korea Custom Antibody Market, 2018 - 2030 (USD Million)
- 9.4.7. Australia
- 9.4.7.1. Key Country Dynamics
- 9.4.7.2. Target Disease Prevalence
- 9.4.7.3. Competitive Scenario
- 9.4.7.4. Regulatory Framework
- 9.4.7.5. Reimbursement Scenario
- 9.4.7.6. Australia Custom Antibody Market, 2018 - 2030 (USD Million)
- 9.4.8. Thailand
- 9.4.8.1. Key Country Dynamics
- 9.4.8.2. Target Disease Prevalence
- 9.4.8.3. Competitive Scenario
- 9.4.8.4. Regulatory Framework
- 9.4.8.5. Reimbursement Scenario
- 9.4.8.6. Thailand Custom Antibody Market, 2018 - 2030 (USD Million)
- 9.5. Latin America
- 9.5.1. SWOT Analysis
- 9.5.2. Latin America Custom Antibody Market, 2018 - 2030 (USD Million)
- 9.5.3. Brazil
- 9.5.3.1. Key Country Dynamics
- 9.5.3.2. Target Disease Prevalence
- 9.5.3.3. Competitive Scenario
- 9.5.3.4. Regulatory Framework
- 9.5.3.5. Reimbursement Scenario
- 9.5.3.6. Brazil Custom Antibody Market, 2018 - 2030 (USD Million)
- 9.5.4. Mexico
- 9.5.4.1. Key Country Dynamics
- 9.5.4.2. Target Disease Prevalence
- 9.5.4.3. Competitive Scenario
- 9.5.4.4. Regulatory Framework
- 9.5.4.5. Reimbursement Scenario
- 9.5.4.6. Mexico Custom Antibody Market, 2018 - 2030 (USD Million)
- 9.5.5. Argentina
- 9.5.5.1. Key Country Dynamics
- 9.5.5.2. Target Disease Prevalence
- 9.5.5.3. Competitive Scenario
- 9.5.5.4. Regulatory Framework
- 9.5.5.5. Reimbursement Scenario
- 9.5.5.6. Argentina Custom Antibody Market, 2018 - 2030 (USD Million)
- 9.6. MEA
- 9.6.1. SWOT Analysis
- 9.6.2. MEA Custom Antibody Market, 2018 - 2030 (USD Million)
- 9.6.3. South Africa
- 9.6.3.1. Key Country Dynamics
- 9.6.3.2. Target Disease Prevalence
- 9.6.3.3. Competitive Scenario
- 9.6.3.4. Regulatory Framework
- 9.6.3.5. Reimbursement Scenario
- 9.6.3.6. South Africa Custom Antibody Market, 2018 - 2030 (USD Million)
- 9.6.4. Saudi Arabia
- 9.6.4.1. Key Country Dynamics
- 9.6.4.2. Target Disease Prevalence
- 9.6.4.3. Competitive Scenario
- 9.6.4.4. Regulatory Framework
- 9.6.4.5. Reimbursement Scenario
- 9.6.4.6. Saudi Arabia Custom Antibody Market, 2018 - 2030 (USD Million)
- 9.6.5. UAE
- 9.6.5.1. Key Country Dynamics
- 9.6.5.2. Target Disease Prevalence
- 9.6.5.3. Competitive Scenario
- 9.6.5.4. Regulatory Framework
- 9.6.5.5. Reimbursement Scenario
- 9.6.5.6. UAE Custom Antibody Market, 2018 - 2030 (USD Million)
- 9.6.6. Kuwait
- 9.6.6.1. Key Country Dynamics
- 9.6.6.2. Target Disease Prevalence
- 9.6.6.3. Competitive Scenario
- 9.6.6.4. Regulatory Framework
- 9.6.6.5. Reimbursement Scenario
- 9.6.6.6. Kuwait Custom Antibody Market, 2018 - 2030 (USD Million)
Chapter 10. Competitive Landscape
- 10.1. Participant's overview
- 10.1.1. Thermo Fisher Scientific Inc.
- 10.1.2. Creative Diagnostics
- 10.1.3. Abcam plc
- 10.1.4. Bio-Rad Laboratories, Inc
- 10.1.5. Kaneka Eurogentec S.A.
- 10.1.6. YenZym Antibodies, LLC.
- 10.1.7. Abmart
- 10.1.8. Labcorp Drug Development
- 10.1.9. LifeSpan BioSciences, Inc
- 10.1.10. GenScript
- 10.2. Financial performance
- 10.3. Participant categorization
- 10.3.1. Market Leaders
- 10.3.2. Custom Antibody Market Share Analysis, 2022
- 10.3.3. Strategy Mapping
- 10.3.3.1. Expansion
- 10.3.3.2. Acquisition
- 10.3.3.3. Collaborations
- 10.3.3.4. Product/Service Launch
- 10.3.3.5. Partnerships
- 10.3.3.6. Others