|
|
市場調査レポート
商品コード
1511818
米国の汚泥管理・脱水市場規模、シェア、動向分析レポート:カテゴリー別、供給源別、サービス別、セグメント別予測、2024年~2030年U.S. Sludge Management And Dewatering Market Size, Share & Trends Analysis Report By Category (CWT, POTW, FOTW), By Source (Municipal, Industrial), By Services, And Segment Forecasts, 2024 - 2030 |
||||||
|
|||||||
カスタマイズ可能
|
|||||||

| 米国の汚泥管理・脱水市場規模、シェア、動向分析レポート:カテゴリー別、供給源別、サービス別、セグメント別予測、2024年~2030年 |
|
出版日: 2024年06月07日
発行: Grand View Research
ページ情報: 英文 125 Pages
納期: 2~10営業日
|

全表示
- 概要
- 図表
- 目次
米国の汚泥管理・脱水市場の成長と動向:
Grand View Research, Inc.の最新レポートによると、米国の汚泥管理・脱水市場規模は2030年までに38億8,500万米ドルに達する見込みで、2024年から2030年までのCAGRは2.1%で拡大すると予測されています。
汚泥・廃水処理プラントの新設や既存プラントのアップグレードのプロジェクト数が増加していることが、市場成長の促進要因となっています。
これらの新しい処理プラントの建設は、住宅、商業、工業活動によって発生する大量の汚泥や廃水を処理するために実施されています。このことは、予測期間中、米国における汚泥管理・脱水需要に貢献すると予想されます。
米国の人口増加は、新しい廃水処理プラントの必要性に寄与しています。人口の増加に伴い、廃水の発生量も比例して増加します。人口の増加は、住宅、商業、工業活動の増加を意味します。これらすべての要因が、国内での廃水生成量の増加に寄与しています。環境保護と持続可能性に対する国民の意識は高まっています。このような社会の変化は、農業や造園における汚泥のリサイクルや再利用を含む、廃棄物管理におけるより環境に優しい慣行を推し進め、市場の成長をさらに促進しています。
汚泥管理に関して連邦政府が定めた規制や基準により、汚泥管理サービスに対する需要が高まっています。環境保護庁(EPA)は汚泥管理に厳しい基準を設けており、効果的な汚泥管理方法を監視・促進するために政府によって多くの規制も可決されています。
例えば、超党派インフラ法案(BIL)は、地域経済を支援し、既存の連邦インフラ構想を活用して、国内の十分なサービスを受けていない地域における廃水処理インフラの必要性に対処することを目的としています。
都市化の進展も、廃水管理に対する需要の高まりにつながっています。人口密度の高い地域では、汚泥の不適切な処理は、病気の蔓延など重大な健康被害につながる可能性があります。多くの人々が人口密集地域に居住しているため、効果的な廃水処理の必要性が最も重要になっています。効果的な汚泥管理は、汚泥の安全な処分または再利用を保証し、公衆衛生を守ります。
Veolia、Texas Sludge Disposal、Iceboat Water Technologies LLC、U.S. Ecology, Inc.は、米国の汚泥管理・脱水市場の主要プレーヤーです。これらの企業の戦略には通常、パートナーシップや提携、M&A、新サービスの立ち上げなどによる市場範囲の拡大が含まれます。
例えば、2022年11月、J. P. Mascaro &Sons社は廃棄物収集とリサイクルの3年契約を140万米ドルで獲得しました。J. P. Mascaro &Sons社は、リサイクル、輸送、堆肥化、リサイクル施設の戦略的インフラを地元地域に有しており、この地域の主要な自治体サービスプロバイダーとなっています。
米国汚泥管理・脱水市場レポートハイライト
- カテゴリー別では、公営処理施設(POTW)分野が2023年に75.7%の最大売上シェアで市場をリードしました。これらの処理施設は、生活排水を処理するように設計されています。様々な供給源から廃水を集め、都市廃水や産業廃水、汚泥の貯蔵、処理、処分に使用されるあらゆる装置やシステムが含まれます。
- 廃水処理システムの分散化により、敷地内施設分野は予測期間中最も速いCAGRで推移すると予想されます。この国の人口増加と都市化の進行は、汚泥処理と脱水に対する、便利で費用対効果の高い地域密着型ソリューションの必要性を煽っています。
- 排出源に基づくと、自治体セグメントは2023年に51.70%の最大収益シェアで市場をリードしました。自治体セグメントの主な促進要因の1つは、都市部における廃水処理サービスに対する需要の高まりです。都市が拡大しインフラが老朽化するにつれて、公衆衛生と環境を守るための効果的な廃水処理の必要性が高まっています。
- 産業分野では、効率改善と環境への影響低減のために、先進的な汚泥管理・脱水技術への投資が増加しており、汚泥からの有益な再利用と資源回収の機会を模索しているため、予測期間中のCAGRは最も早いと予想されます。
- サービス別では、処理分野が2023年に51.7%の最大の収益シェアを占め、予測期間中最も速いCAGRで成長すると予測されます。
- 2023年6月、Ground/Water Treatment &Technology, LLCはEmber Infrastructureから成長投資ファンドを受け取った。この投資により、GWTTの能力が拡大し、新規および既存の顧客にあらゆる水管理ソリューションを提供できるようになると期待されています。GWTTは、システム建設・試運転、プロセス設計・エンジニアリング、システム最適化、運転・保守、機器販売・レンタルなど、商業用水処理に関するあらゆるサービスを提供しています。
目次
第1章 調査手法と範囲
第2章 エグゼクティブサマリー
第3章 米国の汚泥管理・脱水市場:変数、動向、範囲
- 集中と成長の見通しマッピング
- 業界バリューチェーン分析
- テクノロジーの概要
- 規制の枠組み
- 市場力学
- 業界分析ツール
- 経済メガ動向分析
第4章 米国の汚泥管理・脱水市場:カテゴリー推定・動向分析
- 米国の汚泥管理・脱水市場:カテゴリー展望
- 米国の汚泥管理・脱水市場:カテゴリー変動分析と市場シェア、2023年および2030年
- カテゴリー別、2018年~2030年
第5章 米国の汚泥管理・脱水市場:供給源の推定・動向分析
- 米国の汚泥管理・脱水市場:供給源の見通し
- 米国の汚泥管理・脱水市場:供給源変動分析と市場シェア、2023年および2030年
- 供給源別、2018年~2030年
第6章 米国の汚泥管理・脱水市場:サービスの推定・動向分析
- 米国の汚泥管理・脱水市場:サービス展望
- 米国の汚泥管理・脱水市場:サービス変動分析と市場シェア、2023年および2030年
- サービス別、2018年~2030年
第7章 競合情勢
- 主要市場参入企業による最近の動向と影響分析
- 企業分類
- 企業の市場ポジショニング
- 企業市場シェア分析、2023年
- 企業ヒートマップ分析、2023年
- Competitive Dashboard Analysis
- 戦略マッピング
- 企業プロファイル
- Wastewater Transport Services
- JP Mascaro &Sons
- Franc Environmental, Inc.
- Veolia
- All Waste Corp.
- Aqua Zyme
- US Ecology, Inc.
- Waterleau
- Evoqua Water Technologies LLC
- Texas Sludge Disposal, Inc.
- Clean Harbours
- Synagro
- Merrell Bros
- Denali Water
- Bio-Nomic(Carlylon Corp.)
- DredgIT
- GFL Environmental, Inc.
- Oscar Renda
- Eagle Dynamic Solutions
- MP Environmental Services
List of Tables
- Table 1 U.S. Sludge Management & Dewatering Market Estimates and Forecasts, By Category, 2018 - 2030 (USD Million)
- Table 2 U.S. Sludge Management & Dewatering Market Estimates and Forecasts, By Source, 2018 - 2030 (USD Million)
- Table 3 U.S. Sludge Management & Dewatering Market Estimates and Forecasts, By Services, 2018 - 2030 (USD Million)
- Table 4 Recent Developments & Impact Analysis, By Key Market Participants
- Table 5 Key Companies: Contracts/Agreements
- Table 6 Key Companies: Expansions
- Table 7 Key Companies: Mergers & Acquisitions
- Table 8 Key Companies: Investments
List of Figures
- Fig. 1 Market Segmentation & Scope
- Fig. 2 Information Procurement
- Fig. 3 Data Analysis Models
- Fig. 4 Market Formulation and Validation
- Fig. 5 Data Validating & Publishing
- Fig. 6 Market Snapshot
- Fig. 7 Category & Source Segment Snapshot
- Fig. 8 Competitive Landscape Snapshot
- Fig. 9 Concentration And Growth Prospect Mapping
- Fig. 10 U.S. Sludge Management & Dewatering Market - Value Chain Analysis
- Fig. 11 Market Dynamics
- Fig. 12 Market Driver Analysis
- Fig. 13 Market Restraint Analysis
- Fig. 14 U.S. Sludge Management & Dewatering Market: PORTER's Analysis
- Fig. 15 U.S. Sludge Management & Dewatering Market: PESTEL Analysis
- Fig. 16 U.S. Sludge Management & Dewatering Market, By Category: Key Takeaways
- Fig. 17 U.S. Sludge Management & Dewatering Market: Category Movement Analysis & Market Share, 2023 & 2030
- Fig. 18 U.S. Sludge Management & Dewatering Market Estimates & Forecasts, By CWT, 2018 - 2030 (USD Million)
- Fig. 19 U.S. Sludge Management & Dewatering Market Estimates & Forecasts, By POTW, 2018 - 2030 (USD Million)
- Fig. 20 U.S. Sludge Management & Dewatering Market Estimates & Forecasts, By FOTW, 2018 - 2030 (USD Million)
- Fig. 21 U.S. Sludge Management & Dewatering Market Estimates & Forecasts, By Onsite Facilities, 2018 - 2030 (USD Million)
- Fig. 22 U.S. Sludge Management & Dewatering Market, By Source: Key Takeaways
- Fig. 23 U.S. Sludge Management & Dewatering Market: Source Movement Analysis & Market Share, 2023 & 2030
- Fig. 24 U.S. Sludge Management & Dewatering Market Estimates & Forecasts, In Municipal, 2018 - 2030 (USD Million)
- Fig. 25 U.S. Sludge Management & Dewatering Market Estimates & Forecasts, In IndU.S.trial, 2018 - 2030 (USD Million)
- Fig. 26 U.S. Sludge Management & Dewatering Market, By Services: Key Takeaways
- Fig. 27 U.S. Sludge Management & Dewatering Market: Services Movement Analysis & Market Share, 2023 & 2030
- Fig. 28 U.S. Sludge Management & Dewatering Market Estimates & Forecasts, By Collection & Hauling 2018 - 2030 (USD Million)
- Fig. 29 U.S. Sludge Management & Dewatering Market Estimates & Forecasts, By Treatment, 2018 - 2030 (USD Million)
- Fig. 30 U.S. Sludge Management & Dewatering Market Estimates & Forecasts, By Disposal, 2018 - 2030 (USD Million)
- Fig. 31 Key Company/Competition Categorization
- Fig. 32 Competitive Dashboard Analysis
- Fig. 33 Company Market Position Analysis
- Fig. 34 Strategic Framework
U.S. Sludge Management And Dewatering Market Growth & Trends:
The U.S. sludge management and dewatering market size is expected to reach USD 3885.0 million by 2030 and is anticipated to expand at a CAGR of 2.1% from 2024 to 2030, according to a new report by Grand View Research, Inc. The rising number of projects for the establishment of new sludge and wastewater treatment plants or the upgradation of existing ones is acting as a driver for the market growth.
The construction of these new treatment plants is being undertaken to handle a large volume of sludge and wastewater generated by residential, commercial, and industrial activities. This, in turn, is anticipated to contribute to the demand for sludge management and dewatering in the U.S. over the forecast period.
The rising population in the U.S. is contributing to the need for new wastewater treatment plants. As the population expands, the volume of wastewater generated also rises proportionally. More people implies more residential, commercial, and industrial activities. All these factors contribute to the increased production of wastewater in the country. There is a growing public awareness about environmental protection and sustainability. This societal shift is pushing for more eco-friendly practices in waste management, including the recycling and reuse of sludge in agriculture and landscaping, further driving the market growth.
The regulations and standards set by the federal government regarding sludge management, there has been a growing demand for sludge management services. The Environmental Protection Agency (EPA) has set strict standards for sludge management, and many regulations have also been passed by the government to monitor and promote effective sludge management practices.
For instance, the Bipartisan Infrastructure Legislation (BIL) aims to support local economies and leverage existing federal infrastructure initiatives to address the need for wastewater treatment infrastructure in underserved regions of the country.
The ongoing urbanization also leads to the rising demand for wastewater management. In densely populated areas, the improper disposal of sludge can lead to significant health hazards, including the spread of diseases. As a large number of people reside in densely populated areas, the requirement for effective wastewater treatment becomes paramount. Effective sludge management ensures the safe disposal or reuse of sludge, thus protecting public health.
Veolia, Texas Sludge Disposal, Iceboat Water Technologies LLC, and U.S. Ecology, Inc. are major players in the U.S. sludge management and dewatering market. These companies' strategies usually include expanding their market reach through partnerships and collaborations, mergers and acquisitions, and new service launches.
For instance, in November 2022, J. P. Mascaro & Sons attained a 3-year contract for waste collection and recycling is valued USD 1.4 million. J. P. Mascaro & Sons has a strategic infrastructure of recycling, transportation, composting and recycling facilities in the local region, which has allowed it to become a major municipal service provider in the area.
U.S. Sludge Management And Dewatering Market Report Highlights:
- Based on category, the publicly owned treatment works (POTW) segment led the market with the largest revenue share of 75.7% in 2023. These works are designed to treat domestic sewage. They gather wastewater from various sources and include any devices and systems used for the storage, treatment, and disposal of municipal or industrial wastewater and sludge
- The onsite facilities segment is anticipated to witness at the fastest CAGR over the forecast period, owing to the decentralization of wastewater treatment systems. The country's increasing population and ongoing urbanization fuel the requirement for localized solutions for sludge handling and dewatering, which are convenient and cost-effective
- Based on source, the municipal segment led the market with the largest revenue share of 51.70% in 2023. One of the key drivers of the municipal segment is the rising demand for wastewater treatment services in urban areas. As cities expand and infrastructure ages, there is a greater need for effective wastewater treatment to protect public health and the environment
- The industrial segment is expected to witness at the fastest CAGR over the forecast period, as industries are increasingly investing in advanced sludge management and dewatering technologies to improve efficiency and reduce environmental impacts and exploring opportunities for beneficial reuse and resource recovery from sludge
- Based on services, the treatment segment held the market with the largest revenue share of 51.7% in 2023 and is anticipated to witness at the fastest CAGR over the forecast period, owing to the need for dewatering sludge to remove water content and produce a concentrated sludge product
- In June 2023, Ground/Water Treatment & Technology, LLC received a growth investment fund from Ember Infrastructure. This investment is expected to expand GWTT's ability to deliver a full range of water management solutions to new and existing clients. GWTT is a provider of a full range of commercial water treatment services, including system construction and commissioning, process design and engineering, system optimization, operations and maintenance, and equipment sales and rentals
Table of Contents
Chapter 1 Methodology And Scope
- 1.1 Market Segmentation & Scope
- 1.2 Market Definitions
- 1.3 Research Methodology
- 1.4 Information Procurement
- 1.4.1 Purchased Database
- 1.4.2 Gvr's Internal Database
- 1.4.3 Secondary Sources
- 1.4.4 Third Party Perspective
- 1.4.5 Information Analysis
- 1.5 Information Analysis
- 1.5.1 Data Analysis Models
- 1.5.2 Market Formulation & Data Visualization
- 1.5.3 Data Validation & Publishing
- 1.6 Research Scope And Assumptions
- 1.6.1 List To Data Sources
Chapter 2 Executive Summary
- 2.1 Market Snapshot
- 2.2 Category & Source Segment Snapshot
- 2.3 Competitive Landscape Snapshot
Chapter 3 U.S. Sludge Management & Dewatering Market: Variables, Trends & Scope
- 3.1 Concentration & Growth Prospect Mapping
- 3.2 Industry Value Chain Analysis
- 3.3 Technology Overview
- 3.4 Regulatory Framework
- 3.4.1 Dewatering And Remediation General Permit (DRGP)
- 3.4.2 Hazardous Waste Compliance Monitoring
- 3.5 Market Dynamics
- 3.5.1 Market Driver Analysis
- 3.5.1.1 Continuously Growing Population, Coupled With Rising Demand For Wastewater Treatment Plants In U.S.
- 3.5.1.2 Presence Of Stringent Government Regulations For Sludge Management And Dewatering In U.S.
- 3.5.2 Market Restraint Analysis
- 3.5.2.1 High Equipment Cost Of Sludge Management And Dewatering
- 3.5.3 Market Challenge Analysis
- 3.5.1 Market Driver Analysis
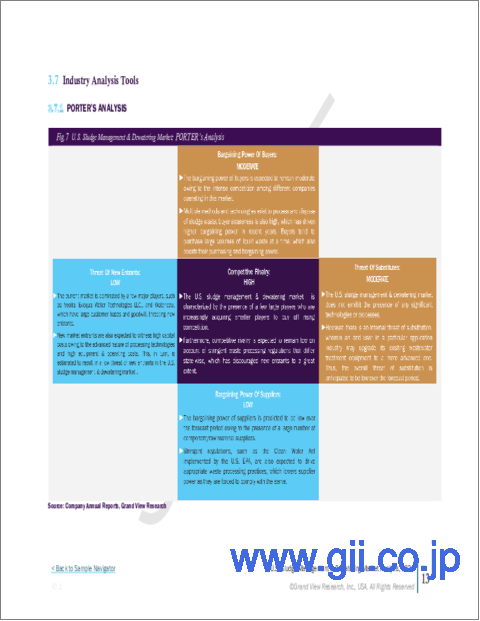
- 3.6 Industry Analysis Tools
- 3.6.1 Porter's Analysis
- 3.6.2 Macroeconomic Analysis
- 3.7 Economic Mega-Trend Analysis
- 3.7.1 Russia-Ukraine War
- 3.7.2 Covid-19 Impact
Chapter 4 U.S. Sludge Management & Dewatering Market: Category Estimates & Trend Analysis
- 4.1 U.S. Sludge Management & Dewatering Market: Category Outlook
- 4.2 U.S. Sludge Management & Dewatering Market: Category Movement Analysis & Market Share, 2023 & 2030
- 4.3 U.S. Sludge Management & Dewatering Market Estimates & Forecasts, By Category, 2018 - 2030 (USD Million)
- 4.3.1 CWT
- 4.3.2 POTW
- 4.3.3 FOTW
- 4.3.4 Onsite Facilities
Chapter 5 U.S. Sludge Management & Dewatering Market: Source Estimates & Trend Analysis
- 5.1 U.S. Sludge Management & Dewatering Market: Source Outlook
- 5.2 U.S. Sludge Management & Dewatering Market: Source Movement Analysis & Market Share, 2023 & 2030
- 5.3 U.S. Sludge Management & Dewatering Market Estimates & Forecasts, By Source, 2018 - 2030 (USD Million)
- 5.3.1 Municipal
- 5.3.2 Industrial
Chapter 6 U.S. Sludge Management & Dewatering Market: Services Estimates & Trend Analysis
- 6.1 U.S. Sludge Management & Dewatering Market: Services Outlook
- 6.2 U.S. Sludge Management & Dewatering Market: Services Movement Analysis & Market Share, 2023 & 2030
- 6.3 U.S. Sludge Management & Dewatering Market Estimates & Forecasts, By Services, 2018 - 2030 (USD Million)
- 6.3.1 Collection & Hauling
- 6.3.2 Treatment
- 6.3.3 Disposal
Chapter 7. Competitive Landscape
- 7.1. Recent Developments & Impact Analysis by Key Market Participants
- 7.2. Company Categorization
- 7.3. Company Market Positioning
- 7.4. Company Market Share Analysis, 2023
- 7.5. Company Heat Map Analysis, 2023
- 7.6. Competitive Dashboard Analysis
- 7.7. Strategy Mapping
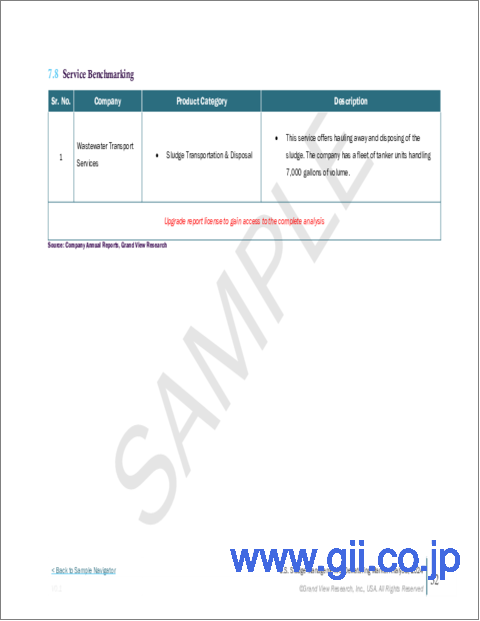
- 7.8. Company Profiles
- 7.8.1. Wastewater Transport Services
- 7.8.1.1. Participant's Overview
- 7.8.1.2. Financial Performance
- 7.8.1.3. Product Benchmarking
- 7.8.1.4. Recent Developments
- 7.8.2. J.P. Mascaro & Sons
- 7.8.2.1. Participant's Overview
- 7.8.2.2. Financial Performance
- 7.8.2.3. Product Benchmarking
- 7.8.2.4. Recent Developments
- 7.8.3. Franc Environmental, Inc.
- 7.8.3.1. Participant's Overview
- 7.8.3.2. Financial Performance
- 7.8.3.3. Product Benchmarking
- 7.8.3.4. Recent Developments
- 7.8.4. Veolia
- 7.8.4.1. Participant's Overview
- 7.8.4.2. Financial Performance
- 7.8.4.3. Product Benchmarking
- 7.8.4.4. Recent Developments
- 7.8.5. All Waste Corp.
- 7.8.5.1. Participant's Overview
- 7.8.5.2. Financial Performance
- 7.8.5.3. Product Benchmarking
- 7.8.5.4. Recent Developments
- 7.8.6. Aqua Zyme
- 7.8.6.1. Participant's Overview
- 7.8.6.2. Financial Performance
- 7.8.6.3. Product Benchmarking
- 7.8.6.4. Recent Developments
- 7.8.7. U.S. Ecology, Inc.
- 7.8.7.1. Participant's Overview
- 7.8.7.2. Financial Performance
- 7.8.7.3. Product Benchmarking
- 7.8.7.4. Recent Developments
- 7.8.8. Waterleau
- 7.8.8.1. Participant's Overview
- 7.8.8.2. Financial Performance
- 7.8.8.3. Product Benchmarking
- 7.8.8.4. Recent Developments
- 7.8.9. Evoqua Water Technologies LLC
- 7.8.9.1. Participant's Overview
- 7.8.9.2. Financial Performance
- 7.8.9.3. Product Benchmarking
- 7.8.9.4. Recent Developments
- 7.8.10. Texas Sludge Disposal, Inc.
- 7.8.10.1. Participant's Overview
- 7.8.10.2. Financial Performance
- 7.8.10.3. Product Benchmarking
- 7.8.10.4. Recent Developments
- 7.8.11. Clean Harbours
- 7.8.11.1. Participant's Overview
- 7.8.11.2. Financial Performance
- 7.8.11.3. Product Benchmarking
- 7.8.11.4. Recent Developments
- 7.8.12. Synagro
- 7.8.12.1. Participant's Overview
- 7.8.12.2. Financial Performance
- 7.8.12.3. Product Benchmarking
- 7.8.12.4. Recent Developments
- 7.8.13. Merrell Bros
- 7.8.13.1. Participant's Overview
- 7.8.13.2. Financial Performance
- 7.8.13.3. Product Benchmarking
- 7.8.13.4. Recent Developments
- 7.8.14. Denali Water
- 7.8.14.1. Participant's Overview
- 7.8.14.2. Financial Performance
- 7.8.14.3. Product Benchmarking
- 7.8.14.4. Recent Developments
- 7.8.15. Bio-Nomic (Carlylon Corp.)
- 7.8.15.1. Participant's Overview
- 7.8.15.2. Financial Performance
- 7.8.15.3. Product Benchmarking
- 7.8.15.4. Recent Developments
- 7.8.16. DredgIT
- 7.8.16.1. Participant's Overview
- 7.8.16.2. Financial Performance
- 7.8.16.3. Product Benchmarking
- 7.8.16.4. Recent Developments
- 7.8.17. GFL Environmental, Inc.
- 7.8.17.1. Participant's Overview
- 7.8.17.2. Financial Performance
- 7.8.17.3. Product Benchmarking
- 7.8.17.4. Recent Developments
- 7.8.18. Oscar Renda
- 7.8.18.1. Participant's Overview
- 7.8.18.2. Financial Performance
- 7.8.18.3. Product Benchmarking
- 7.8.18.4. Recent Developments
- 7.8.19. Eagle Dynamic Solutions
- 7.8.19.1. Participant's Overview
- 7.8.19.2. Financial Performance
- 7.8.19.3. Product Benchmarking
- 7.8.19.4. Recent Developments
- 7.8.20. MP Environmental Services
- 7.8.20.1. Participant's Overview
- 7.8.20.2. Financial Performance
- 7.8.20.3. Product Benchmarking
- 7.8.20.4. Recent Developments
- 7.8.1. Wastewater Transport Services

