|
|
市場調査レポート
商品コード
1178738
ギター市場の規模、シェア、動向分析レポート:製品別(アコースティック、エレクトリック)、流通チャネル別(オフライン、オンライン)、地域別、セグメント別予測、2022年~2030年Guitar Market Size, Share & Trends Analysis Report By Product (Acoustic And Electric), By Distribution Channel (Offline And Online), By Region, And Segment Forecasts, 2022 - 2030 |
||||||
|
|
|||||||
|
● お客様のご希望に応じて、既存データの加工や未掲載情報(例:国別セグメント)の追加などの対応が可能です。 詳細はお問い合わせください。 |
|||||||


| ギター市場の規模、シェア、動向分析レポート:製品別(アコースティック、エレクトリック)、流通チャネル別(オフライン、オンライン)、地域別、セグメント別予測、2022年~2030年 |
|
出版日: 2022年12月23日
発行: Grand View Research
ページ情報: 英文 80 Pages
納期: 2~10営業日
|
- 全表示
- 概要
- 図表
- 目次
ギター市場の成長と動向
Grand View Research, Inc.の新しいレポートによると、世界のギター市場規模は、2023年から2030年までCAGR7.7%を記録し、2030年には184億4000万米ドルに達すると予測されています。いくつかの教育機関では、音楽をカリキュラムの一部にしています。これは、若者を従事し、ギターの需要の上昇に貢献する彼らの音楽のスキルや知識を向上させます。技術革新とインターネットの普及の発展により、音楽教育は、世界的に、より多くの学生に到達することができます。さらに、カスタマイズされたギターに対する需要の高まりが、市場の主要な促進要因となっています。
COVID-19の大流行は、市場の成長にプラスの影響を与えました。パンデミックの期間中、楽器販売が大幅に増加し、特にギターが好調でした。ギターの売り上げが伸びたことで、家にこもっている時間を利用してギターを手にする人が多くなったようです。例えば、アップル社によると、2020年2月以降、アドオンの「サウンドライブラリ」が1300万ダウンロードされ、Garage Bandの価格帯の兄弟製品であるLogic Pro XやFinal Cut Pro Xの無料体験版ダウンロードが数十万件と、Garage Bandへの関心度が高まっているとのことです。
2023年から2030年までの予測期間では、オンラインセグメントが優勢になりそうです。ミュージック・ストライブのブログ「2021」によると、フェンダーは2020年3月と4月に工場を閉鎖したにもかかわらず、2019年の実績を17.0%近く上回る7億米ドルという高水準で1年を終えています。楽器のオンライン購入の動向は予測期間中も継続します。
2022年のギター市場では、アジア太平洋地域が最大の収益シェアを獲得しました。娯楽やレジャーに費やすことができるとともに、音楽に対する人々の関心が高まっていることも、同地域におけるエレクトリックギターの需要を高めています。さらに、ここ数年、音楽ショーやフェスティバルを開催する音楽バンドの数が増加していることも、同地域のギター需要を牽引しています。したがって、アジア太平洋地域は、2022年に最大の収益を生成しました。
メーカーは主に彼らの意図されたアプリケーションによく合う非常に効率的なギターを製造するためにダイナミックな消費者の要件に集中しています。革新的なデザイン、材料、製造技術を取り入れ、高品質でコスト効率の高いギターを製造することは、ギター市場の人気のある動向の1つです。
ギター市場レポートハイライト
2023年から2030年までの予測期間において、北米が市場を独占すると予想されます。これは、米国での音楽コンサートの増加に関連してライブ音楽の概念が高まっていることに起因しています。 Michael Kelly Guitar Co.などは、この地域の最大の顧客層を引き付けるために新しいバリエーションを導入しています。
予測期間中は、エレクトリックギター分野が優位に立つと思われます。音楽への関心の高まりが、エレクトリックギター市場の成長を促進すると予想される
オフライン部門は2022年に最大の収益を生み出しました。として、それは選択の自由、価格帯、およびブランドのより多くの可視性を含むいくつかの利点を提供し、すべてのタイプの顧客のための適切なプラットフォームとなっている
目次
第1章 調査手法と範囲
- 市場セグメンテーションと範囲
- 市場の定義
- 情報調達
- 購入したデータベース
- GVRの内部データベース
- 二次情報と第三者の視点
- 1次調査
- 情報分析
- データ分析モデル
- 市場形成とデータ可視化
- データの検証と公開
第2章 エグゼクティブサマリー
- 市場の見通し
- 製品の見通し
- 流通経路の見通し
- 地域の見通し
第3章 ギター市場の変数、動向、範囲
- 市場イントロダクション
- 浸透と成長の見通しのマッピング
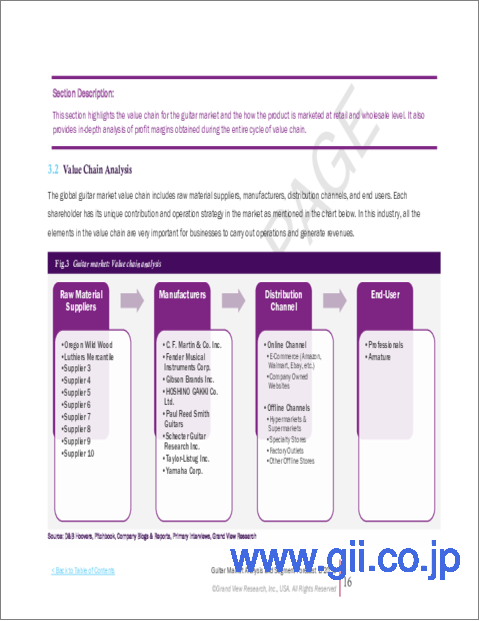
- 業界バリューチェーン分析
- 販売・小売チャネル分析
- 利益率分析
- 市場力学
- 市場促進要因分析
- 市場抑制要因分析
- 業界の課題
- 業界の機会
- 事業環境分析
- 業界分析- ポーターズ
- サプライヤーの力
- 買い手の交渉力
- 代替の脅威
- 新規参入者からの脅威
- 競争企業間の敵対関係
- 業界分析- ポーターズ
- ギター市場のロードマップ
- 市場参入戦略
- COVID-19のギター市場への影響
第4章 消費者行動分析
- 人口統計分析
- 消費者の動向と好み
- 購入決定に影響を与える要因
- 消費者製品の採用
- 所見と推奨事項
第5章 ギター市場:製品推定・動向分析
- 製品変動分析と市場シェア、2022年と2030年
- 音響
- 電気の
第6章 ギター市場:流通チャネルの推定・動向分析
- 流通チャネルの変動分析と市場シェア、2022年と2030年
- オフライン
- オンライン
第7章 ギター市場:地域推定・動向分析
- 地域別変動分析と市場シェア、2022年と2030年
- 北米
- 米国
- 欧州
- 英国
- ドイツ
- フランス
- アジア太平洋地域
- 中国
- 韓国
- 日本
- 中南米
- ブラジル
- 中東とアフリカ
- アラブ首長国連邦
第8章 競合分析
- 主要な世界企業、最近の動向、業界への影響
- 主要企業/競合の分類(主要なイノベーター、市場リーダー、新興企業)
- ベンダー情勢
- 主要企業の市場シェア分析、2022年
第9章 企業プロファイル
- CF Martin &Co. Inc.
- 会社概要
- 財務実績
- 製品のベンチマーク
- 戦略的イニシアチブ
- Fender Musical Instruments Corp.
- 会社概要
- 財務実績
- 製品のベンチマーク
- 戦略的イニシアチブ
- Gibson Brands Inc.
- 会社概要
- 財務実績
- 製品のベンチマーク
- 戦略的イニシアチブ
- HOSHINO GAKKI Co. Ltd.
- 会社概要
- 財務実績
- 製品のベンチマーク
- 戦略的イニシアチブ
- Karl Hofner GmbH &Co. KG
- 会社概要
- 財務実績
- 製品のベンチマーク
- 戦略的イニシアチブ
- Paul Reed Smith Guitars
- 会社概要
- 財務実績
- 製品のベンチマーク
- 戦略的イニシアチブ
- Rickenbacker International Corp.
- 会社概要
- 財務実績
- 製品のベンチマーク
- 戦略的イニシアチブ
- Schecter Guitar Research Inc.
- 会社概要
- 財務実績
- 製品のベンチマーク
- 戦略的イニシアチブ
- Taylor-Listug Inc.
- 会社概要
- 財務実績
- 製品のベンチマーク
- 戦略的イニシアチブ
- Yamaha Corp.
- 会社概要
- 財務実績
- 製品のベンチマーク
- 戦略的イニシアチブ
List of Tables
- 1. Guitar market - Driving factor market analysis
- 2. Guitar market - Restraint factor market analysis
- 3. Guitar operators' sales analysis 2021 vs. 2022
- 4. Acoustic guitar market estimates and forecast, 2017 - 2030 (USD Million)
- 5. Electric guitar market estimates and forecast, 2017 - 2030 (USD Million)
- 6. Guitar market estimates and forecast for offline, 2017 - 2030 (USD Million)
- 7. Guitar market estimates and forecast for online, 2017 - 2030 (USD Million)
- 8. North America guitar market estimates and forecast, 2017 - 2030 (USD Million)
- 9. North America guitar market estimates and forecast, by product, 2017 - 2030 (USD Million)
- 10. North America guitar market estimates and forecast, by distribution channel, 2017 - 2030 (USD Million)
- 11. U.S. guitar market estimates and forecast, 2017 - 2030 (USD Million)
- 12. U.S. guitar market estimates and forecast, by product, 2017 - 2030 (USD Million)
- 13. U.S. guitar market estimates and forecast, by distribution channel, 2017 - 2030 (USD Million)
- 14. Europe guitar market estimates and forecast, 2017 - 2030 (USD Million)
- 15. Europe guitar market estimates and forecast, by product, 2017 - 2030 (USD Million)
- 16. Europe guitar market estimates and forecast, by distribution channel, 2017 - 2030 (USD Million)
- 17. U.K. guitar market estimates and forecast, 2017 - 2030 (USD Million)
- 18. U.K. guitar market estimates and forecast, by product, 2017 - 2030 (USD Million)
- 19. U.K. guitar market estimates and forecast, by distribution channel, 2017 - 2030 (USD Million)
- 20. Germany guitar market estimates and forecast, 2017 - 2030 (USD Million)
- 21. Germany guitar market estimates and forecast, by product, 2017 - 2030 (USD Million)
- 22. Germany guitar market estimates and forecast, by distribution channel, 2017 - 2030 (USD Million)
- 23. France guitar market estimates and forecast, 2017 - 2030 (USD Million)
- 24. France guitar market estimates and forecast, by product, 2017 - 2030 (USD Million)
- 25. France guitar market estimates and forecast, by distribution channel, 2017 - 2030 (USD Million)
- 26. Asia Pacific guitar market estimates and forecast, 2017 - 2030 (USD Million)
- 27. Asia Pacific guitar market estimates and forecast, by product, 2017 - 2030 (USD Million)
- 28. Asia Pacific guitar market estimates and forecast, by distribution channel, 2017 - 2030 (USD Million)
- 29. China guitar market estimates and forecast, 2017 - 2030 (USD Million)
- 30. China guitar market estimates and forecast, by product, 2017 - 2030 (USD Million)
- 31. China guitar market estimates and forecast, by distribution channel, 2017 - 2030 (USD Million)
- 32. South Korea guitar market estimates and forecast, 2017 - 2030 (USD Million)
- 33. South Korea guitar market estimates and forecast, by product, 2017 - 2030 (USD Million)
- 34. South Korea guitar market estimates and forecast, by distribution channel, 2017 - 2030 (USD Million)
- 35. Japan guitar market estimates and forecast, 2017 - 2030 (USD Million)
- 36. Japan guitar market estimates and forecast, by product, 2017 - 2030 (USD Million)
- 37. Japan guitar market estimates and forecast, by distribution channel, 2017 - 2030 (USD Million)
- 38. Central & South America guitar market estimates and forecast, 2017 - 2030 (USD Million)
- 39. Central & South America guitar market estimates and forecast, by product, 2017 - 2030 (USD Million)
- 40. Central & South America guitar market estimates and forecast, by distribution channel, 2017 - 2030 (USD Million)
- 41. Brazil guitar market estimates and forecast, 2017 - 2030 (USD Million) 107
- 42. Brazil guitar market estimates and forecast, by product, 2017 - 2030 (USD Million)
- 43. Brazil guitar market estimates and forecast, by distribution channel, 2017 - 2030 (USD Million)
- 44. Middle East & Africa guitar market estimates and forecast, 2017 - 2030 (USD Million)
- 45. Middle East & Africa guitar market estimates and forecast, by product, 2017 - 2030 (USD Million)
- 46. Middle East & Africa guitar market estimates and forecast, by distribution channel, 2017 - 2030 (USD Million)
- 47. UAE guitar market estimates and forecast, 2017 - 2030 (USD Million)
- 48. UAE guitar market estimates and forecast, by product, 2017 - 2030 (USD Million)
- 49. UAE guitar market estimates and forecast, by distribution channel, 2017 - 2030 (USD Million)
- 50. Company categorization
List of Figures
- 1. Guitar market segmentation
- 2. Information procurement
- 3. Primary research pattern
- 4. Primary research approaches
- 5. Primary research process
- 6. Guitar market: Value chain analysis
- 7. Guitar sales/retail channel analysis
- 8. Guitar market: Porter's five forces analysis
- 9. Guitar market: Product share (%) analysis, 2022 & 2030
- 10. Guitar market: Distribution channel share (%) analysis, 2022 & 2030
Guitar Market Growth & Trends:
The global guitar market size is expected to reach USD 18.44 billion by 2030, registering a CAGR of 7.7% from 2023 to 2030 according to a new report by Grand View Research, Inc. Several educational institutes have made music a part of their curriculum. This will engage youngsters and enhance their music skills and knowledge, which contribute to the rise in demand for guitars. With technological innovations and the development of internet penetration, music education can reach more students, globally. Moreover, the growing demand for customized guitars is the key driving factor for the market.
The COVID-19 outbreak had a positive impact on the growth of the market. During the pandemic, music instruments sale grew considerably, especially guitars. With an increase in guitar sales, it seems as though most people are turning to the guitar during their time stuck at home. For instance, according to Apple Inc., the company saw an increasing level of interest in Garage Band with 13.0 million downloads from its add-on "Sound Library" since February 2020, and hundreds of thousands of free trial downloads of Garage Band's pricier siblings Logic Pro X and Final Cut Pro X.
The online segment is likely to dominate during the forecast period from 2023 to 2030. According to a blog by Music Strive, 2021, despite having closed factories in March and April 2020, Fender finished the year with a high of USD 700.0 million, nearly 17.0% more than what was achieved in 2019. The trend of online purchasing of the instruments will continue in the forecast period.
Asia Pacific acquired the largest revenue share in the guitar market in 2022. The rising interest of people in music along with the ability to expend on entertainment and leisure activities has also increased the demand for electric guitars in the region. Moreover, the increase in the number of musical bands organizing music shows and festivals in the last couple of years drives the guitar demands in the region. Thus, Asia Pacific generated the largest revenue in 2022.
Manufacturers are largely concentrating on dynamic consumer requirements to manufacture highly efficient guitars that well suit their intended applications. Incorporating innovative designs, materials, and manufacturing technologies to produce high-quality and cost-efficient guitars is one of the popular trends in the guitar market.
Guitar Market Report Highlights:
- North America is expected to dominate the market during the forecast period from 2023 to 2030. This is owing to the increasing concept of live music in connection with the rising number of music concerts in the U.S. Michael Kelly Guitar Co. and others, which are introducing new variants to attract the largest customer base in the region
- The electric guitar segment is likely to dominate during the forecast period. Rising interest in music is expected to propel the growth of the electric guitar market
- The offline segment generated the maximum revenue in 2022. As, it offers several advantages, including freedom of selection, price ranges, and more visibility of the brands, making them an appropriate platform for all types of customers
Table of Contents
Chapter 1. Methodology and Scope
- 1.1. Market Segmentation & Scope
- 1.2. Market Definition
- 1.3. Information Procurement
- 1.3.1. Purchased Database
- 1.3.2. GVR's Internal Database
- 1.3.3. Secondary Sources & Third-Party Perspectives
- 1.3.4. Primary Research
- 1.4. Information Analysis
- 1.4.1. Data Analysis Models
- 1.5. Market Formulation & Data Visualization
- 1.6. Data Validation & Publishing
Chapter 2. Executive Summary
- 2.1. Market Outlook
- 2.2. Product Outlook
- 2.3. Distribution Channel Outlook
- 2.4. Regional Outlook
Chapter 3. Guitar Market Variables, Trends & Scope
- 3.1. Market Introduction
- 3.2. Penetration & Growth Prospect Mapping
- 3.3. Industry Value Chain Analysis
- 3.3.1. Sales/Retail Channel Analysis
- 3.3.2. Profit Margin Analysis
- 3.4. Market Dynamics
- 3.4.1. Market Driver Analysis
- 3.4.2. Market Restraint Analysis
- 3.4.3. Industry Challenges
- 3.4.4. Industry Opportunities
- 3.5. Business Environment Analysis
- 3.5.1. Industry Analysis - Porter's
- 3.5.1.1. Supplier Power
- 3.5.1.2. Buyer Power
- 3.5.1.3. Substitution Threat
- 3.5.1.4. Threat from New Entrant
- 3.5.1.5. Competitive Rivalry
- 3.5.1. Industry Analysis - Porter's
- 3.6. Roadmap of the guitar market
- 3.7. Market Entry Strategies
- 3.8. Impact of COVID-19 on the guitar market
Chapter 4. Consumer Behavior Analysis
- 4.1. Demographic Analysis
- 4.2. Consumer Trends and Preferences
- 4.3. Factors Affecting Buying Decision
- 4.4. Consumer Product Adoption
- 4.5. Observations & Recommendations
Chapter 5. Guitar Market: Product Estimates & Trend Analysis
- 5.1. Product Movement Analysis & Market Share, 2022 & 2030
- 5.2. Acoustic
- 5.2.1. Market estimates and forecast, 2017 - 2030 (USD Million)
- 5.3. Electric
- 5.3.1. Market estimates and forecast, 2017 - 2030 (USD Million)
Chapter 6. Guitar Market Distribution Channel Estimates & Trend Analysis
- 6.1. Distribution Channel Movement Analysis & Market Share, 2022 & 2030
- 6.2. Offline
- 6.2.1. Market estimates and forecast, through offline, 2017 - 2030 (USD Million)
- 6.3. Online
- 6.3.1. Market estimates and forecast, through online, 2017 - 2030 (USD Million)
Chapter 7. Guitar Market: Regional Estimates & Trend Analysis
- 7.1. Regional Movement Analysis & Market Share, 2022 & 2030
- 7.2. North America
- 7.2.1. Market estimates and forecast, 2017 - 2030 (USD Million)
- 7.2.2. Market estimates and forecast, by product, 2017 - 2030 (USD Million)
- 7.2.3. Market estimates and forecast, by distribution channel, 2017 - 2030 (USD Million)
- 7.2.4. U.S.
- 7.2.4.1. Market estimates and forecast, 2017 - 2030 (USD Million)
- 7.2.4.2. Market estimates and forecast, by product, 2017 - 2030 (USD Million)
- 7.2.4.3. Market estimates and forecast, by distribution channel, 2017 - 2030 (USD Million)
- 7.3. Europe
- 7.3.1. Market estimates and forecast, 2017 - 2030 (USD Million)
- 7.3.2. Market estimates and forecast, by product, 2017 - 2030 (USD Million)
- 7.3.3. Market estimates and forecast, by distribution channel, 2017 - 2030 (USD Million)
- 7.3.4. U.K.
- 7.3.4.1. Market estimates and forecast, 2017 - 2030 (USD Million)
- 7.3.4.2. Market estimates and forecast, by product, 2017 - 2030 (USD Million)
- 7.3.4.3. Market estimates and forecast, by distribution channel, 2017 - 2030 (USD Million)
- 7.3.5. Germany
- 7.3.5.1. Market estimates and forecast, 2017 - 2030 (USD Million)
- 7.3.5.2. Market estimates and forecast, by product, 2017 - 2030 (USD Million)
- 7.3.5.3. Market estimates and forecast, by distribution channel, 2017 - 2030 (USD Million)
- 7.3.6. France
- 7.3.6.1. Market estimates and forecast, 2017 - 2030 (USD Million)
- 7.3.6.2. Market estimates and forecast, by product, 2017 - 2030 (USD Million)
- 7.3.6.3. Market estimates and forecast, by distribution channel, 2017 - 2030 (USD Million)
- 7.4. Asia Pacific
- 7.4.1. Market estimates and forecast, 2017 - 2030 (USD Million)
- 7.4.2. Market estimates and forecast, by product, 2017 - 2030 (USD Million)
- 7.4.3. Market estimates and forecast, by distribution channel, 2017 - 2030 (USD Million)
- 7.4.4. China
- 7.4.4.1. Market estimates and forecast, 2017 - 2030 (USD Million)
- 7.4.4.2. Market estimates and forecast, by product, 2017 - 2030 (USD Million)
- 7.4.4.3. Market estimates and forecast, by distribution channel, 2017 - 2030 (USD Million)
- 7.4.5. South Korea
- 7.4.5.1. Market estimates and forecast, 2017 - 2030 (USD Million)
- 7.4.5.2. Market estimates and forecast, by product, 2017 - 2030 (USD Million)
- 7.4.5.3. Market estimates and forecast, by distribution channel, 2017 - 2030 (USD Million)
- 7.4.6. Japan
- 7.4.6.1. Market estimates and forecast, 2017 - 2030 (USD Million)
- 7.4.6.2. Market estimates and forecast, by product, 2017 - 2030 (USD Million)
- 7.4.6.3. Market estimates and forecast, by distribution channel, 2017 - 2030 (USD Million)
- 7.5. Central & South America
- 7.5.1. Market estimates and forecast, 2017 - 2030 (USD Million)
- 7.5.2. Market estimates and forecast, by product, 2017 - 2030 (USD Million)
- 7.5.3. Market estimates and forecast, by distribution channel, 2017 - 2030 (USD Million)
- 7.5.4. Brazil
- 7.5.4.1. Market estimates and forecast, 2017 - 2030 (USD Million)
- 7.5.4.2. Market estimates and forecast, by product, 2017 - 2030 (USD Million)
- 7.5.4.3. Market estimates and forecast, by distribution channel, 2017 - 2030 (USD Million)
- 7.6. Middle East & Africa
- 7.6.1. Market estimates and forecast, 2017 - 2030 (USD Million)
- 7.6.2. Market estimates and forecast, by product, 2017 - 2030 (USD Million)
- 7.6.3. Market estimates and forecast, by distribution channel, 2017 - 2030 (USD Million)
- 7.6.4. UAE
- 7.6.4.1. Market estimates and forecast, 2017 - 2030 (USD Million)
- 7.6.4.2. Market estimates and forecast, by product, 2017 - 2030 (USD Million)
- 7.6.4.3. Market estimates and forecast, by distribution channel, 2017 - 2030 (USD Million)
Chapter 8. Competitive Analysis
- 8.1. Key global players, recent developments & their impact on the industry
- 8.2. Key Company/Competition Categorization (Key innovators, Market leaders, Emerging players)
- 8.3. Vendor Landscape
- 8.3.1. Key company market share analysis, 2022
Chapter 9. Company Profiles
- 9.1. C. F. Martin & Co. Inc.
- 9.1.1. Company Overview
- 9.1.2. Financial Performance
- 9.1.3. Product Benchmarking
- 9.1.4. Strategic Initiatives
- 9.2. Fender Musical Instruments Corp.
- 9.2.1. Company Overview
- 9.2.2. Financial Performance
- 9.2.3. Product Benchmarking
- 9.2.4. Strategic Initiatives
- 9.3. Gibson Brands Inc.
- 9.3.1. Company Overview
- 9.3.2. Financial Performance
- 9.3.3. Product Benchmarking
- 9.3.4. Strategic Initiatives
- 9.4. HOSHINO GAKKI Co. Ltd.
- 9.4.1. Company Overview
- 9.4.2. Financial Performance
- 9.4.3. Product Benchmarking
- 9.4.4. Strategic Initiatives
- 9.5. Karl Hofner GmbH & Co. KG
- 9.5.1. Company Overview
- 9.5.2. Financial Performance
- 9.5.3. Product Benchmarking
- 9.5.4. Strategic Initiatives
- 9.6. Paul Reed Smith Guitars
- 9.6.1. Company Overview
- 9.6.2. Financial Performance
- 9.6.3. Product Benchmarking
- 9.6.4. Strategic Initiatives
- 9.7. Rickenbacker International Corp.
- 9.7.1. Company Overview
- 9.7.2. Financial Performance
- 9.7.3. Product Benchmarking
- 9.7.4. Strategic Initiatives
- 9.8. Schecter Guitar Research Inc.
- 9.8.1. Company Overview
- 9.8.2. Financial Performance
- 9.8.3. Product Benchmarking
- 9.8.4. Strategic Initiatives
- 9.9. Taylor-Listug Inc.
- 9.9.1. Company Overview
- 9.9.2. Financial Performance
- 9.9.3. Product Benchmarking
- 9.9.4. Strategic Initiatives
- 9.10. Yamaha Corp.
- 9.10.1. Company Overview
- 9.10.2. Financial Performance
- 9.10.3. Product Benchmarking
- 9.10.4. Strategic Initiatives