|
|
市場調査レポート
商品コード
1178702
再生可能メタノールの市場規模、シェア、動向分析レポート:原料別(再生可能エネルギー、農業廃棄物)、用途別(ホルムアルデヒド、MTBE)、地域別、セグメント別予測、2023年~2030年Renewable Methanol Market Size, Share & Trends Analysis Report By Feedstock (Renewable Energy, Agriculture Waste), By Application (Formaldehyde, MTBE), By Region, And Segment Forecasts, 2023 - 2030 |
||||||
|
|
|||||||
|
● お客様のご希望に応じて、既存データの加工や未掲載情報(例:国別セグメント)の追加などの対応が可能です。 詳細はお問い合わせください。 |
|||||||


| 再生可能メタノールの市場規模、シェア、動向分析レポート:原料別(再生可能エネルギー、農業廃棄物)、用途別(ホルムアルデヒド、MTBE)、地域別、セグメント別予測、2023年~2030年 |
|
出版日: 2022年12月02日
発行: Grand View Research
ページ情報: 英文 77 Pages
納期: 2~10営業日
|
- 全表示
- 概要
- 図表
- 目次
再生可能メタノール市場の成長と動向
Grand View Research, Inc.の新しいレポートによると、再生可能メタノールの世界市場規模は、2023年から2030年までCAGR55.0%で拡大し、2030年までに206億8000万米ドルに達すると予測されています。この成長は、酢酸、ホルムアルデヒド、プラスチックなどの化学産業における用途の増加による再生可能メタノールの需要増が主な要因です。さらに、バイオメタノールは主に自動車、船舶、業務用ボイラー、台所用品などの燃料として使用されています。燃料はそのままでも、ガソリンと組み合わせてバイオディーゼルにしたり、メチルtert-ブチルエーテル(MTBE)やジメチルエーテル(DME)として使用することができます。
再生可能メタノールには、バイオメタノールとeメタノールの2種類があります。バイオメタノールは、バイオマス(農業廃棄物、森林廃棄物)、都市ごみ、黒液などを原料として生産され、eメタノールは、CO2や電気を原料として生産されます。この生産過程で必要となるCO2は、再生可能な資源から回収(直接空気捕集またはBECCS)するか、グリーン水素を使用します。
年間数十億トンのメタノールを必要とする潜在的な市場に対して、石油ベースの炭化水素と石油化学製品の大部分は、直接またはメタノール誘導体を通じてグリーンメタノールに置き換えることができます。バイオメタノールを用いた芳香族やプラスチックの生産は、急速に増加しています。これによって、グリーン経済への移行がより容易になります。
アジア太平洋の新興国における産業活動の増加と、北米および欧州の一部における化学産業の高成長が相まって、これらの地域全体でバイオ燃料の高い需要が発生しています。中国、インド、日本などの国々では、必需品の調達に従来の店舗訪問よりもeコマース・プラットフォームへの依存度が高いことが反映されています。このため、この地域では自動車保有台数が増加し、自動車の排ガスを抑制するための需要が急増し、これらの新興経済圏でバイオメタノールガソリン混合物への依存度が高まっています。
再生可能メタノール市場のレポートハイライト
水力発電、風力発電、地熱発電などの再生可能エネルギーによる電力生産の増加により、再生可能エネルギーは予測期間中に最も高い成長率を記録すると予想されます。
さらに、アジア太平洋、中米、中東などの新興経済諸国における工業化の進展と住宅インフラ開発の拡大により、工業部門から大量のCO2が発生し、世界的に製品の配合が容易になりました。
ホルムアルデヒド用途は、化粧品、塗料、食品分野の防腐剤など、幅広い産業用途があるため、予測期間中に最も高い成長率を記録すると予想されます。
アジア太平洋地域は、自動車産業や建設業の成長に伴う産業活動の急増により、プラスチックや溶剤の市場が急速に発展しており、収益面で最も高い成長率(55.5%)を記録すると予測されます。
目次
第1章 調査手法と範囲
- 市場セグメンテーションと範囲
- 市場の定義
- 情報調達
- 情報分析
- 市場形成とデータ可視化
- データの検証と公開
- 調査範囲と前提
- データソースのリスト
第2章 エグゼクティブサマリー
- 市場の見通し
- 部分スナップショット
- 競合情勢のスナップショット
第3章 市場変数、動向、範囲
- 市場系列の見通し
- 世界の再生可能メタノール市場の見通し
- 業界バリューチェーン分析
- 原材料トレンド分析
- 製造動向分析
- 販売チャネル分析
- 規制の枠組み
- 価格に影響を与える要因
- COVID-19パンデミックの影響
- 欧州の地政学的紛争の影響
- 市場力学
- 市場促進要因分析
- 市場抑制要因分析
- 市場機会分析
- 業界の課題分析
第4章 再生可能メタノール市場:サプライヤーのポートフォリオ分析
- 原材料サプライヤー一覧
- ポートフォリオ分析/Kraljicマトリックス
- エンゲージメントモデル
- 交渉戦略
- 調達のベストプラクティス
第5章 再生可能メタノール市場:原料推定・動向分析
- 原料の変動分析と市場シェア、2022年と2030年(キロトン)(100万米ドル)
- 再生可能メタノールの市場規模、予測、トレンド分析、原料別、2018~2030年(キロトン)(100万米ドル)
第6章 再生可能メタノール市場:アプリケーションの推定・動向分析
- アプリケーションの変動分析と市場シェア、2022年と2030年(キロトン)(100万米ドル)
- 再生可能メタノールの市場規模、予測、トレンド分析、用途別、2018~2030年(キロトン)(100万米ドル)
第7章 再生可能メタノール市場:地域推定・動向分析
- 2022年と2030年の地域変動分析と市場シェア
- 北米
- 米国
- カナダ
- メキシコ
- 欧州
- ドイツ
- イタリア
- ベルギー
- フランス
- スペイン
- オランダ
- デンマーク
- アジア太平洋地域
- 中国
- インド
- 日本
- ASEAN
- 中南米
- ブラジル
- チリ
- 中東とアフリカ
- 北米
第8章 再生可能メタノール市場-競合分析
- 主要な市場参入企業別最近の開発と影響分析
- 企業/競合の分類(主要なイノベーター、マーケットリーダー、新興企業)
- ベンダー情勢
- ディストリビューターおよびチャネルパートナーのリスト
- 潜在的なエンドユーザーのリスト
- 主要企業の市場ポジショニング分析、2022年
- 主要メーカー別の生産能力
- 主要取引と戦略的提携分析
第9章 企業プロファイル
- Advanced Chemical Technologies
- 会社概要
- 財務実績
- 製品のベンチマーク
- 戦略的イニシアチブ
- BASF SE
- 会社概要
- 財務実績
- 製品のベンチマーク
- 戦略的イニシアチブ
- Carbon Recycling International
- 会社概要
- 財務実績
- 製品のベンチマーク
- 戦略的イニシアチブ
- BASF SE
- 会社概要
- 財務実績
- 製品のベンチマーク
- 戦略的イニシアチブ
- Enerkem
- 会社概要
- 財務実績
- 製品のベンチマーク
- 戦略的イニシアチブ
- Fraunhofer
- 会社概要
- 財務実績
- 製品のベンチマーク
- 戦略的イニシアチブ
- Innogy
- 会社概要
- 財務実績
- 製品のベンチマーク
- 戦略的イニシアチブ
- Nordic Green
- 会社概要
- 財務実績
- 製品のベンチマーク
- 戦略的イニシアチブ
- OCI NV
- 会社概要
- 財務実績
- 製品のベンチマーク
- 戦略的イニシアチブ
- Sodra
- 会社概要
- 財務実績
- 製品のベンチマーク
- 戦略的イニシアチブ
- Uniper SE
- 会社概要
- 財務実績
- 製品のベンチマーク
- 戦略的イニシアチブ
- Vertimass LLC
- 会社概要
- 財務実績
- 製品のベンチマーク
- 戦略的イニシアチブ
List of Tables
- Table 1 Renewable Methanol Market Estimates & Forecasts, By Feedstock, 2018 - 2030 (Kilotons)
- Table 2 Renewable Methanol Market Estimates & Forecasts, By Feedstock, 2018 - 2030 (USD Million)
- Table 3 Renewable Methanol Market Estimates & Forecasts, By Application, 2018 - 2030 (Kilotons)
- Table 4 Renewable Methanol Market Estimates & Forecasts, By Application, 2018 - 2030 (USD Million)
- Table 5 North America Renewable Methanol market estimates & forecasts, by Feedstock, 2018 - 2030 (USD Million)
- Table 6 North America Renewable Methanol market estimates & forecasts, by Feedstock, 2018 - 2030 (KiloTons)
- Table 7 North America Renewable Methanol market estimates & forecasts, by Application, 2018 - 2030 (USD Million)
- Table 8 North America Renewable Methanol market estimates & forecasts, by Application, 2018 - 2030 (KiloTons)
- Table 9 U.S.Renewable Methanol market estimates & forecasts, by Feedstock, 2018 - 2030 (USD Million)
- Table 10 U.S.Renewable Methanol market estimates & forecasts, by Feedstock, 2018 - 2030 (KiloTons)
- Table 11 U.S.Renewable Methanol market estimates & forecasts, by Application, 2018 - 2030 (USD Million)
- Table 12 U.S.Renewable Methanol market estimates & forecasts, by Application, 2018 - 2030 (KiloTons)
- Table 13 Canada Renewable Methanol market estimates & forecasts, by Feedstock, 2018 - 2030 (USD Million)
- Table 14 Canada Renewable Methanol market estimates & forecasts, by Feedstock, 2018 - 2030 (KiloTons)
- Table 15 Canada Renewable Methanol market estimates & forecasts, by Application, 2018 - 2030 (USD Million)
- Table 16 Canada Renewable Methanol market estimates & forecasts, by Application, 2018 - 2030 (KiloTons)
- Table 17 Mexico Renewable Methanol market estimates & forecasts, by Feedstock, 2018 - 2030 (USD Million)
- Table 18 Mexico Renewable Methanol market estimates & forecasts, by Feedstock, 2018 - 2030 (KiloTons)
- Table 19 Mexico Renewable Methanol market estimates & forecasts, by Application, 2018 - 2030 (USD Million)
- Table 20 Mexico Renewable Methanol market estimates & forecasts, by Application, 2018 - 2030 (KiloTons)
- Table 21 Europe Renewable Methanol market estimates & forecasts, by Feedstock, 2018 - 2030 (USD Million)
- Table 22 Europe Renewable Methanol market estimates & forecasts, by Feedstock, 2018 - 2030 (KiloTons)
- Table 23 Europe Renewable Methanol market estimates & forecasts, by Application, 2018 - 2030 (USD Million)
- Table 24 Europe Renewable Methanol market estimates & forecasts, by Application, 2018 - 2030 (KiloTons)
- Table 25 Germany Renewable Methanol market estimates & forecasts, by Feedstock, 2018 - 2030 (USD Million)
- Table 26 Germany Renewable Methanol market estimates & forecasts, by Feedstock, 2018 - 2030 (KiloTons)
- Table 27 Germany Renewable Methanol market estimates & forecasts, by Application, 2018 - 2030 (USD Million)
- Table 28 Germany Renewable Methanol market estimates & forecasts, by Application, 2018 - 2030 (KiloTons)
- Table 29 Spain Renewable Methanol market estimates & forecasts, by Feedstock, 2018 - 2030 (USD Million)
- Table 30 Spain Renewable Methanol market estimates & forecasts, by Feedstock, 2018 - 2030 (KiloTons)
- Table 31 Spain Renewable Methanol market estimates & forecasts, by Application, 2018 - 2030 (USD Million)
- Table 32 Spain Renewable Methanol market estimates & forecasts, by Application, 2018 - 2030 (KiloTons)
- Table 33 France Renewable Methanol market estimates & forecasts, by Feedstock, 2018 - 2030 (USD Million)
- Table 34 France Renewable Methanol market estimates & forecasts, by Feedstock, 2018 - 2030 (KiloTons)
- Table 35 France Renewable Methanol market estimates & forecasts, by Application, 2018 - 2030 (USD Million)
- Table 36 France Renewable Methanol market estimates & forecasts, by Application, 2018 - 2030 (KiloTons)
- Table 37 Belgium Renewable Methanol market estimates & forecasts, by Feedstock, 2018 - 2030 (USD Million)
- Table 38 Belgium Renewable Methanol market estimates & forecasts, by Feedstock, 2018 - 2030 (KiloTons)
- Table 39 Belgium Renewable Methanol market estimates & forecasts, by Application, 2018 - 2030 (USD Million)
- Table 40 Belgium Renewable Methanol market estimates & forecasts, by Application, 2018 - 2030 (KiloTons)
- Table 41 Netherlands Renewable Methanol market estimates & forecasts, by Feedstock, 2018 - 2030 (USD Million)
- Table 42 Netherlands Renewable Methanol market estimates & forecasts, by Feedstock, 2018 - 2030 (KiloTons)
- Table 43 Netherlands Renewable Methanol market estimates & forecasts, by Application, 2018 - 2030 (USD Million)
- Table 44 Netherlands Renewable Methanol market estimates & forecasts, by Application, 2018 - 2030 (KiloTons)
- Table 45 Denmark Renewable Methanol market estimates & forecasts, by Feedstock, 2018 - 2030 (USD Million)
- Table 46 Denmark Renewable Methanol market estimates & forecasts, by Feedstock, 2018 - 2030 (KiloTons)
- Table 47 Denmark Renewable Methanol market estimates & forecasts, by Application, 2018 - 2030 (USD Million)
- Table 48 Denmark Renewable Methanol market estimates & forecasts, by Application, 2018 - 2030 (KiloTons)
- Table 49 ItalyRenewable Methanol market estimates & forecasts, by Feedstock, 2018 - 2030 (USD Million)
- Table 50 Italy Renewable Methanol market estimates & forecasts, by Feedstock, 2018 - 2030 (KiloTons)
- Table 51 Italy Renewable Methanol market estimates & forecasts, by Application, 2018 - 2030 (USD Million)
- Table 52 ItalyRenewable Methanol market estimates & forecasts, by Application, 2018 - 2030 (KiloTons)
- Table 53 Asia Pacific Renewable Methanol market estimates & forecasts, by Feedstock, 2018 - 2030 (USD Million)
- Table 54 Asia Pacific Renewable Methanol market estimates & forecasts, by Feedstock, 2018 - 2030 (KiloTons)
- Table 55 Asia Pacific Renewable Methanol market estimates & forecasts, by Application, 2018 - 2030 (USD Million)
- Table 56 Asia Pacific Renewable Methanol market estimates & forecasts, by Application, 2018 - 2030 (KiloTons)
- Table 57 China Renewable Methanol market estimates & forecasts, by Feedstock, 2018 - 2030 (USD Million)
- Table 58 China Renewable Methanol market estimates & forecasts, by Feedstock, 2018 - 2030 (KiloTons)
- Table 59 China Renewable Methanol market estimates & forecasts, by Application, 2018 - 2030 (USD Million)
- Table 60 China Renewable Methanol market estimates & forecasts, by Application, 2018 - 2030 (KiloTons)
- Table 61 India Renewable Methanol market estimates & forecasts, by Feedstock, 2018 - 2030 (USD Million)
- Table 62 India Renewable Methanol market estimates & forecasts, by Feedstock, 2018 - 2030 (KiloTons)
- Table 63 India Renewable Methanol market estimates & forecasts, by Application, 2018 - 2030 (USD Million)
- Table 64 India Renewable Methanol market estimates & forecasts, by Application, 2018 - 2030 (KiloTons)
- Table 65 Japan Renewable Methanol market estimates & forecasts, by Feedstock, 2018 - 2030 (USD Million)
- Table 66 Japan Renewable Methanol market estimates & forecasts, by Feedstock, 2018 - 2030 (KiloTons)
- Table 67 Japan Renewable Methanol market estimates & forecasts, by Application, 2018 - 2030 (USD Million)
- Table 68 Japan Renewable Methanol market estimates & forecasts, by Application, 2018 - 2030 (KiloTons)
- Table 69 ASEAN Renewable Methanol market estimates & forecasts, by Feedstock, 2018 - 2030 (USD Million)
- Table 70 ASEAN Renewable Methanol market estimates & forecasts, by Feedstock, 2018 - 2030 (KiloTons)
- Table 71 ASEAN Renewable Methanol market estimates & forecasts, by Application, 2018 - 2030 (USD Million)
- Table 72 ASEAN Renewable Methanol market estimates & forecasts, by Application, 2018 - 2030 (KiloTons)
- Table 73 Central and South America Renewable Methanol market estimates & forecasts, by Feedstock, 2018 - 2030 (USD Million)
- Table 74 Central and South America Renewable Methanol market estimates & forecasts, by Feedstock, 2018 - 2030 (KiloTons)
- Table 75 Central and South America Renewable Methanol market estimates & forecasts, by Application, 2018 - 2030 (USD Million)
- Table 76 Central and South America Renewable Methanol market estimates & forecasts, by Application, 2018 - 2030 (KiloTons)
- Table 77 Brazil Renewable Methanol market estimates & forecasts, by Feedstock, 2018 - 2030 (USD Million)
- Table 78 Brazil Renewable Methanol market estimates & forecasts, by Feedstock, 2018 - 2030 (KiloTons)
- Table 79 Brazil Renewable Methanol market estimates & forecasts, by Application, 2018 - 2030 (USD Million)
- Table 80 Brazil Renewable Methanol market estimates & forecasts, by Application, 2018 - 2030 (KiloTons)
- Table 81 Chile Renewable Methanol market estimates & forecasts, by Feedstock, 2018 - 2030 (USD Million)
- Table 82 Chile Renewable Methanol market estimates & forecasts, by Feedstock, 2018 - 2030 (KiloTons)
- Table 83 Chile Renewable Methanol market estimates & forecasts, by Application, 2018 - 2030 (USD Million)
- Table 84 Chile Renewable Methanol market estimates & forecasts, by Application, 2018 - 2030 (KiloTons)
- Table 85 Middle East and Africa Renewable Methanol market estimates & forecasts, by Feedstock, 2018 - 2030 (USD Million)
- Table 86 Middle East and Africa Renewable Methanol market estimates & forecasts, by Feedstock, 2018 - 2030 (KiloTons)
- Table 87 Middle East and Africa Renewable Methanol market estimates & forecasts, by Application, 2018 - 2030 (USD Million)
- Table 88 Middle East and Africa Renewable Methanol market estimates & forecasts, by Application, 2018 - 2030 (KiloTons)
- Table 89 Key global players & recent development & their impact
- Table 90 List of Key Manufacturers
- Table 91 List of Key Distributors and Channel Partners
- Table 92 List of Potential End Users
List of Figures
- Fig. 1 Renewable Methanol Market Segmentation
- Fig. 2 Information Procurement
- Fig. 3 Data Analysis Models
- Fig. 4 Market Formulation And Validation
- Fig. 5 Data Validating & Publishing
- Fig. 6 Market Snapshot
- Fig. 7 Segmental Snapshot
- Fig. 8 Competitive Landscape Snapshot
- Fig. 9 Renewable Methanol Market, Segmental Outlook, 2022 (USD Million)
- Fig. 10 Renewable Methanol Market Volume and Revenue, (2018 - 2030) (Kilotons) (USD Million)
- Fig. 11 Renewable Methanol Market Value Chain Analysis
- Fig. 12 Renewable Methanol Prices, 2018 - 2030 (USD/Ton)
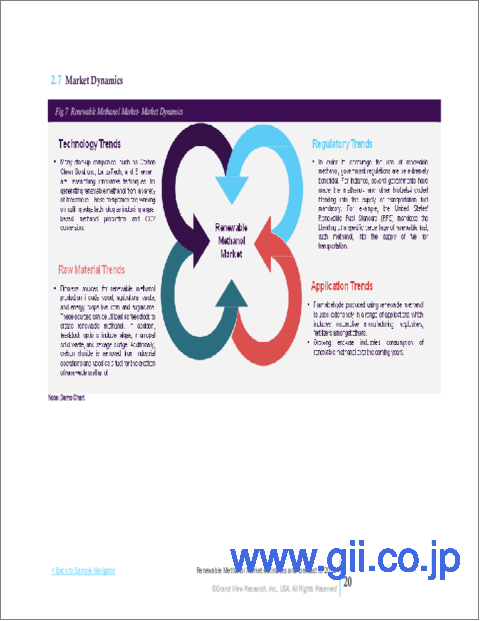
- Fig. 13 Renewable Methanol - Market Dynamics
- Fig. 14 Renewable Methanol Market Driver Impact
- Fig. 15 Renewable Methanol Market Restraint Impact
- Fig. 16 Renewable Methanol Market Revenue Share, By Feedstock, 2022& 2030 (%)
- Fig. 17 Renewable Methanol Market Revenue Share, By Application, 2022& 2030 (%)
- Fig. 18 Strategic Framework
Renewable Methanol Market Growth & Trends:
The global renewable methanol market size is expected to reach USD 20.68 billion by 2030, as per the new report by Grand View Research, Inc., expanding at a CAGR of 55.0% from 2023 to 2030. The growth is majorly driven by increasing demand for renewable methanol owing to the increasing applications in the chemical industry, including acetic acid, formaldehyde, and plastics. Furthermore, biomethanol is primarily used as fuel for automobiles, ships, commercial boilers, and kitchen appliances. The fuel can be used as-is, in combination with gasoline to make biodiesel, or as methyl tert-butyl ether (MTBE) and dimethylether (DME).
There are two types of renewable methanol: bio and e-methanol. Bio methanol is produced via biomass (agriculture waste and forest waste), municipal solid waste, and black liquor, whereas e-methanol is produced through CO2 or electricity. The CO2 required in this production process is captured from renewable sources (via direct air capture or BECCS) or using green hydrogen.
The majority of petroleum-based hydrocarbons and petrochemicals can be replaced by green methanol, either directly or through methanol derivatives, for a potential market that needs billions of tons of methanol annually. The production of aromatics and plastics using biomethanol is rapidly increasing. This would make the transition to a green economy more easily.
Increasing industrial activities in the emerging economies of Asia Pacific coupled with high growth in the chemical industry in North America and parts of Europe have led to high demand for biofuel across these regions. Countries such as China, India, and Japan have reflected heavy dependency on e-commerce platforms over conventional store visits for procuring essentials. This led to an increase in vehicle fleet operating in the region and a surge in demand to curb vehicular emissions, thus increasing dependency on biomethanol gasoline blends across these emerging economies.
Renewable Methanol Market Report Highlights:
- Renewable energy is expected to register the highest growth rate over the forecast period owing to the increasing production of renewable electricity from hydro sources, wind power, and geothermal electricity channels
- Furthermore, increasing industrialization and expanding residential infrastructure development across emerging economies of Asia Pacific, Central America, the Middle East, and others have led to the heavy generation of CO2 from the industrial sectors that eased the formulation of the product globally
- The formaldehyde application segment is expected to register the highest growth rate over the forecast period owing to a wide range of industrial applications, which includes cosmetics, paints, and preservatives in the food sector
- Asia Pacific is expected to register the highest growth rate of 55.5% in terms of revenue over the forecast period owing to the rapid development of the plastics and solvents markets in the region due to a surge in industrial activities, coupled with the growth of the automotive and construction sectors
Table of Contents
Chapter 1 Methodology And Scope
- 1.1 Market Segmentation & Scope
- 1.2 Market Definitions
- 1.3 Information Procurement
- 1.3.1 Information Analysis
- 1.3.2 Market Formulation & Data Visualization
- 1.3.3 Data Validation & Publishing
- 1.4 Research Scope And Assumptions
- 1.4.1 List Of Data Sources
Chapter 2 Executive Summary
- 2.1 Market Outlook
- 2.2 Segmental Snapshot
- 2.3 Competitive Landscape Snapshot
Chapter 3 Market Variables, Trends & Scope
- 3.1 Market Lineage Outlook
- 3.1.1 Global Renewable Methanol Market Outlook
- 3.2 Penetration & Growth Prospect Mapping, 2018 - 2030
- 3.3 Industry Value Chain Analysis
- 3.3.1 Raw Material Trend Analysis
- 3.3.2 Manufacturing Trend Analysis
- 3.3.3 Sales Channel Analysis
- 3.4 Regulatory Framework
- 3.5 Price Trend Analysis, 2018 - 2030
- 3.5.1 Factors Influencing Prices
- 3.6 Impact of the COVID-19 Pandemic
- 3.7 Impact of European Geopolitical Conflict
- 3.8 Market Dynamics
- 3.8.1 Market Driver Analysis
- 3.8.2 Market Restraint Analysis
- 3.8.3 Market Opportunity Analysis
- 3.8.4 Industry Challenges Analysis
Chapter 4 Renewable Methanol Market: Suppliers Portfolio Analysis
- 4.1 List of Raw Material Suppliers
- 4.2 Portfolio Analysis/Kraljic Matrix
- 4.3 Engagement Model
- 4.4 Negotiation Strategies
- 4.5 Sourcing Best Practices
Chapter 5 Renewable Methanol Market: Feedstock Estimates & Trend Analysis
- 5.1 Feedstock Movement Analysis & Market Share, 2022 & 2030 (Kilotons) (USD Million)
- 5.2 Renewable Methanol Market Size, Forecasts, And Trend Analysis, By Feedstock, 2018 - 2030 (Kilotons) (USD Million)
- 5.2.1 Global Renewable Methanol Market Estimates & Forecasts By Agriculture Based, 2018 - 2030 (Kilotons) (USD Million)
- 5.2.2 Global Renewable Methanol Market Estimates & Forecasts By Municipal Waste, 2018 - 2030 (Kilotons) (USD Million)
- 5.2.2 Global Renewable Methanol Market Estimates & Forecasts By Renewable Energy, 2018 - 2030 (Kilotons) (USD Million)
- 5.2.2 Global Renewable Methanol Market Estimates & Forecasts By Others, 2018 - 2030 (Kilotons) (USD Million)
Chapter 6 Renewable Methanol Market: Application Estimates & Trend Analysis
- 6.1 Application Movement Analysis & Market Share, 2022 & 2030 (Kilotons) (USD Million)
- 6.2 Renewable Methanol Market Size, Forecasts, And Trend Analysis, By Application, 2018 - 2030 (Kilotons) (USD Million)
- 6.2.1 Global Renewable Methanol Market Estimates & Forecasts By Formaldehyde, 2018 - 2030 (Kilotons) (USD Million)
- 6.2.2 Global Renewable Methanol Market Estimates & Forecasts By Gasoline, 2018 - 2030 (Kilotons) (USD Million)
- 6.2.3 Global Renewable Methanol Market Estimates & Forecasts By MTBE, 2018 - 2030 (Kilotons) (USD Million)
- 6.2.4 Global Renewable Methanol Market Estimates & Forecasts By Di-methyl Ether, 2018 - 2030 (Kilotons) (USD Million)
- 6.2.5 Global Renewable Methanol Market Estimates & Forecasts By MTO, 2018 - 2030 (Kilotons) (USD Million)
- 6.2.6 Global Renewable Methanol Market Estimates & Forecasts By Acetic Acid, 2018 - 2030 (Kilotons) (USD Million)
- 6.2.7 Global Renewable Methanol Market Estimates & Forecasts ByOthers, 2018 - 2030 (Kilotons) (USD Million)
Chapter 7 Renewable Methanol Market: Regional Estimates & Trend Analysis
- 7.1 Regional Movement Analysis & Market Share, 2022& 2030
- 7.2 Market Size, Forecasts, And Trend Analysis, 2018 - 2030
- 7.2.1 North America
- 7.2.1.1 North America Renewable Methanol Market Estimates & Forecasts, 2018 - 2030 (Kilotons) (USD Million)
- 7.2.1.2 North America Renewable Methanol Market Estimates & Forecasts, By Feedstock, 2018 - 2030 (Kilotons) (USD Million)
- 7.2.1.3 North America Renewable Methanol Market Estimates & Forecasts, By Application, 2018 - 2030 (Kilotons) (USD Million)
- 7.2.1.5 U.S.
- 7.2.1.5.1 U.S. Renewable Methanol Market Estimates & Forecasts, By Feedstock, 2018 - 2030 (Kilotons) (USD Million)
- 7.2.1.5.2 U.S. Renewable Methanol Market Estimates & Forecasts, By Application, 2018 - 2030 (Kilotons) (USD Million)
- 7.2.1.6 Canada
- 7.2.1.6.1 Canada Renewable Methanol Market Estimates & Forecasts, By Feedstock, 2018 - 2030 (Kilotons) (USD Million)
- 7.2.1.6.2 Canada Renewable Methanol Market Estimates & Forecasts, By Application, 2018 - 2030 (Kilotons) (USD Million)
- 7.2.1.7 Mexico
- 7.2.1.7.1 Mexico Renewable Methanol Market Estimates & Forecasts, By Feedstock, 2018 - 2030 (Kilotons) (USD Million)
- 7.2.1.7.2 Mexico Renewable Methanol Market Estimates & Forecasts, By Application, 2018 - 2030 (Kilotons) (USD Million)
- 7.2.2 Europe
- 7.2.2.1 Europe Renewable Methanol Market Estimates & Forecasts, 2018 - 2030 (Kilotons) (USD Million)
- 7.2.2.2 Europe Renewable Methanol Market Estimates & Forecasts, By Feedstock, 2018 - 2030 (Kilotons) (USD Million)
- 7.2.2.3 Europe Renewable Methanol Market Estimates & Forecasts, By Application, 2018 - 2030 (Kilotons) (USD Million)
- 7.2.2.4 Germany
- 7.2.2.4.1 Germany Renewable Methanol Market Estimates & Forecasts, By Feedstock, 2018 - 2030 (Kilotons) (USD Million)
- 7.2.2.4.2 Germany Renewable Methanol Market Estimates & Forecasts, By Application, 2018 - 2030 (Kilotons) (USD Million)
- 7.2.2.5 Italy
- 7.2.2.5.1 Italy Renewable Methanol Market Estimates & Forecasts, By Feedstock, 2018 - 2030 (Kilotons) (USD Million)
- 7.2.2.5.2 Italy Renewable Methanol Market Estimates & Forecasts, By Application, 2018 - 2030 (Kilotons) (USD Million)
- 7.2.2.6 Belgium
- 7.2.2.6.1 Belgium Renewable Methanol Market Estimates & Forecasts, By Feedstock, 2018 - 2030 (Kilotons) (USD Million)
- 7.2.2.6.2 Belgium Renewable Methanol Market Estimates & Forecasts, By Application, 2018 - 2030 (Kilotons) (USD Million)
- 7.2.2.7 France
- 7.2.2.7.1 France Renewable Methanol Market Estimates & Forecasts, By Feedstock, 2018 - 2030 (Kilotons) (USD Million)
- 7.2.2.7.2 France Renewable Methanol Market Estimates & Forecasts, By Application, 2018 - 2030 (Kilotons) (USD Million)
- 7.2.2.8 Spain
- 7.2.2.8.1 SpainRenewable Methanol Market Estimates & Forecasts, By Feedstock, 2018 - 2030 (Kilotons) (USD Million)
- 7.2.2.8.2 SpainRenewable Methanol Market Estimates & Forecasts, By Application, 2018 - 2030 (Kilotons) (USD Million)
- 7.2.2.9 Netherlands
- 7.2.2.9.1 Netherlands Renewable Methanol Market Estimates & Forecasts, By Feedstock, 2018 - 2030 (Kilotons) (USD Million)
- 7.2.2.9.2 Netherlands Renewable Methanol Market Estimates & Forecasts, By Application, 2018 - 2030 (Kilotons) (USD Million)
- 7.2.2.10 Denmark
- 7.2.2.10.1 DenmarkRenewable Methanol Market Estimates & Forecasts, By Feedstock, 2018 - 2030 (Kilotons) (USD Million)
- 7.2.2.10.2 DenmarkRenewable Methanol Market Estimates & Forecasts, By Application, 2018 - 2030 (Kilotons) (USD Million)
- 7.2.3 Asia Pacific
- 7.2.3.1 Asia Pacific Renewable Methanol Market Estimates & Forecasts, 2018 - 2030 (Kilotons) (USD Million)
- 7.2.3.2 Asia Pacific Renewable Methanol Market Estimates & Forecasts, By Feedstock, 2018 - 2030 (Kilotons) (USD Million)
- 7.2.3.3 Asia Pacific Renewable Methanol Market Estimates & Forecasts, By Application, 2018 - 2030 (Kilotons) (USD Million)
- 7.2.3.4 China
- 7.2.3.4.1 China Renewable Methanol Market Estimates & Forecasts, By Feedstock, 2018 - 2030 (Kilotons) (USD Million)
- 7.2.3.4.2 China Renewable Methanol Market Estimates & Forecasts, By Application, 2018 - 2030 (Kilotons) (USD Million)
- 7.2.3.5 India
- 7.2.3.5.1 India Renewable Methanol Market Estimates & Forecasts, By Feedstock, 2018 - 2030 (Kilotons) (USD Million)
- 7.2.3.5.2 India Renewable Methanol Market Estimates & Forecasts, By Application, 2018 - 2030 (Kilotons) (USD Million)
- 7.2.3.6 Japan
- 7.2.3.6.1 Japan Renewable Methanol Market Estimates & Forecasts, By Feedstock, 2018 - 2030 (Kilotons) (USD Million)
- 7.2.3.6.2 Japan Renewable Methanol Market Estimates & Forecasts, By Application, 2018 - 2030 (Kilotons) (USD Million)
- 7.2.3.7 ASEAN
- 7.2.3.7.1 ASEANRenewable Methanol Market Estimates & Forecasts, By Feedstock, 2018 - 2030 (Kilotons) (USD Million)
- 7.2.3.7.2 ASEANRenewable Methanol Market Estimates & Forecasts, By Application, 2018 - 2030 (Kilotons) (USD Million)
- 7.2.4 Central & South America
- 7.2.4.1 Central & South America Renewable Methanol Market Estimates & Forecasts, 2018 - 2030 (Kilotons) (USD Million)
- 7.2.4.2 Central & South America Renewable Methanol Market Estimates & Forecasts, By Feedstock, 2018 - 2030 (Kilotons) (USD Million)
- 7.2.4.3 Central & South America Renewable Methanol Market Estimates & Forecasts, By Application, 2018 - 2030 (Kilotons) (USD Million)
- 7.2.4.4 Brazil
- 7.2.4.4.1 Brazil Renewable Methanol Market Estimates & Forecasts, By Feedstock, 2018 - 2030 (Kilotons) (USD Million)
- 7.2.4.4.2 Brazil Renewable Methanol Market Estimates & Forecasts, By Application, 2018 - 2030 (Kilotons) (USD Million)
- 7.2.4.5 Chile
- 7.2.4.5.1 ChileRenewable Methanol Market Estimates & Forecasts, By Feedstock, 2018 - 2030 (Kilotons) (USD Million)
- 7.2.4.5.2 ChileRenewable Methanol Market Estimates & Forecasts, By Application, 2018 - 2030 (Kilotons) (USD Million)
- 7.2.5 Middle East & Africa
- 7.2.5.1 Middle East & Africa Renewable Methanol Market Estimates & Forecasts, 2018 - 2030 (Kilotons) (USD Million)
- 7.2.5.2 Middle East & Africa Renewable Methanol Market Estimates & Forecasts, By Feedstock, 2018 - 2030 (Kilotons) (USD Million)
- 7.2.5.4 Middle East & Africa Renewable Methanol Market Estimates & Forecasts, By End-Use, 2018 - 2030 (Kilotons) (USD Million)
- 7.2.1 North America
Chapter 8 Renewable Methanol Market - Competitive Analysis
- 8.1 Recent Development & Impact Analysis, By Key Market Participants
- 8.2 Company/Competition Categorization (Key innovators, Market leaders, Emerging Players)
- 8.3 Vendor Landscape
- 8.3.1 List of Distributors And Channel Partners
- 8.3.2 List of Potential End-Users
- 8.4 Key Company Market Positioning Analysis, 2022
- 8.5 Production Capacities, By Key Manufacturers
- 8.6 Major Deals & Strategic Alliances Analysis
Chapter 9 Company Profiles
- 9.1 Advanced Chemical Technologies
- 9.1.1 Company Overview
- 9.1.2 Financial Performance
- 9.1.3 Product Benchmarking
- 9.1.4 Strategic Initiatives
- 9.2 BASF SE
- 9.2.1 Company Overview
- 9.2.2 Financial Performance
- 9.2.3 Product Benchmarking
- 9.2.4 Strategic Initiatives
- 9.3 Carbon Recycling International
- 9.3.1 Company Overview
- 9.3.2 Financial Performance
- 9.3.3 Product Benchmarking
- 9.3.4 Strategic Initiatives
- 9.4 BASF SE
- 9.4.1 Company Overview
- 9.4.2 Financial Performance
- 9.4.3 Product Benchmarking
- 9.4.4 Strategic Initiatives
- 9.5 Enerkem
- 9.5.1 Company Overview
- 9.5.2 Financial Performance
- 9.5.3 Product Benchmarking
- 9.5.4 Strategic Initiatives
- 9.6 Fraunhofer
- 9.6.1 Company Overview
- 9.6.2 Financial Performance
- 9.6.3 Product Benchmarking
- 9.6.4 Strategic Initiatives
- 9.7 Innogy
- 9.7.1 Company Overview
- 9.7.2 Financial Performance
- 9.7.3 Product Benchmarking
- 9.7.4 Strategic Initiatives
- 9.8 Nordic Green
- 9.8.1 Company Overview
- 9.8.2 Financial Performance
- 9.8.3 Product Benchmarking
- 9.8.4 Strategic Initiatives
- 9.9 OCI N.V.
- 9.9.1 Company Overview
- 9.9.2 Financial Performance
- 9.9.3 Product Benchmarking
- 9.9.4 Strategic Initiatives
- 9.10 Sodra
- 9.10.1 Company Overview
- 9.10.2 Financial Performance
- 9.10.3 Product Benchmarking
- 9.10.4 Strategic Initiatives
- 9.11 Uniper SE
- 9.11.1 Company Overview
- 9.11.2 Financial Performance
- 9.11.3 Product Benchmarking
- 9.11.4 Strategic Initiatives
- 9.12 Vertimass LLC
- 9.12.1 Company Overview
- 9.12.2 Financial Performance
- 9.12.3 Product Benchmarking
- 9.12.4 Strategic Initiatives