|
|
市場調査レポート
商品コード
1178677
ノートPC周辺機器の市場規模、シェア、動向分析レポート:タイプ別(電子、非電子)、最終用途別(個人、商用)、流通チャネル別(オフライン、eコマース)、セグメント別予測、2023年~2030年Laptop Accessories Market Size, Share & Trends Analysis Report By Type (Electronic, Non-electronic), By End-use (Personal, Commercial), By Distribution Channel (Offline, E-commerce), And Segment Forecasts, 2023 - 2030 |
||||||
|
|
|||||||
|
● お客様のご希望に応じて、既存データの加工や未掲載情報(例:国別セグメント)の追加などの対応が可能です。 詳細はお問い合わせください。 |
|||||||


| ノートPC周辺機器の市場規模、シェア、動向分析レポート:タイプ別(電子、非電子)、最終用途別(個人、商用)、流通チャネル別(オフライン、eコマース)、セグメント別予測、2023年~2030年 |
|
出版日: 2022年12月28日
発行: Grand View Research
ページ情報: 英文 143 Pages
納期: 2~10営業日
|
- 全表示
- 概要
- 図表
- 目次
ノートPC周辺機器市場の成長と動向
Grand View Research, Inc.の最新レポートによると、2030年のノートPC周辺機器の世界市場規模は656億3000万米ドルで、2023年から2030年までのCAGRは6.3%を記録しました。ノートPC周辺機器の需要は、主にeスポーツの人気の高まりと、産業界におけるプロセスオートメーションの採用によってもたらされています。パソコンの売上は10年前に減少すると予測されていましたが、最近になって10年ぶりの大幅な増加が見られるようになりました。市場調査会社Canalysによると、2021年のPC出荷台数は2019年から11%増の2億9700万台に達しました。IDCは、同年の出荷台数を前年比13.1%増の3億200万台と予測しています。ノートPCの活況がアクセサリーの需要を押し上げます。
ファッション動向の改善、可処分所得の増加、消費者のライフスタイル&嗜好の変化が、業界の成長を後押しすると予想されます。パンデミックにより、2020年第1四半期から世界各地でロックダウンが実施されました。COVID-19の大流行による在宅勤務や在宅学習の動向は、ノートパソコンやデスクトップシステムなどのパソコン市場全体に恩恵を与え、2020年の販売台数は3億200万台を超え、前年比13%増、2014年以来最多となります。これは、ノートパソコンの各種アクセサリーの販売にも良い兆しをもたらしています。Canlys Researchの調査によると、2020年の最終四半期にPC市場の成長が加速し、デスクトップ、ノートブック、ワークステーションの出荷台数は前年比25%増となり、過去最高の9030万台となりました。
2020年の世界PC市場の成長は、ノートブックとモバイルワークステーションが一手に引き受けた。これらのデバイスの出荷台数は、2019年から25%増加し、2億3510万台となっています。したがって、COVID-19のパンデミック時のPC業界の著しい成長は、業界の成長をさらに増大させた。COVID-19パンデミック時にノートPCなどのパソコンの出荷台数が増加したことで、マウスやキーボードなどのノートPC用アクセサリーの需要がさらに高まり、市場の成長に寄与しました。電子タイプは2022年に最大の収益シェアを占め、近い将来大きな成長が見込まれます。
在宅勤務の増加やオンライン学習の推進により、戸締り規制が緩和されたため、ノートパソコンの需要が増加しました。eコマースでは、新品や再生品の検索が増加しています。このようなノートパソコンの需要増は、ワイヤレスキーボードやマウスなどの電子アクセサリーの需要も押し上げています。ノートパソコンが持ち運びできない性能と機能性を備えているため、企業はオフィスインフラにさらに機器を追加しています。2022年の業界では、オフライン部門が優位に立ちました。これは主に、消費者の大部分が依然として電子機器の物理的な買い物を好むためです。その結果、特にインド、中国、ブラジルなどの成長国において、小売店数の増加によりオフラインチャネルを通じた製品販売が改善されると予測されます。
製品の認知度向上と、新たに設立された戦略的ビジネスユニットを通じて拡大するAPAC諸国における大手国際企業の強いプレゼンスが、予測期間を通じてセグメントの成長を支えることになりそうです。2022年の収益シェアは、アジア太平洋地域が最大となっています。アジア太平洋地域では、ノートPC周辺機器の主要市場は、中国、日本、韓国(大韓民国)です。急速な工業化も、この地域の家電製品の成長に寄与しています。企業は、高まる製品需要に対応し、トレンドを生み出すために、製品のイノベーションに注力しています。M&Aなどの主な戦略的イニシアチブは、主要企業が新興経済諸国における足掛かりを得るのに役立っています。
ノートPC周辺機器市場レポートハイライト
在宅勤務の増加やオンライン学習の推進により、ロックダウンの制限が緩和され、ノートPCの需要が増加
予測期間中は、業務用セグメントが最も高いCAGRを記録すると予想されます。
ウェブカム、スピーカー、ポインティングデバイスなどのラップトップ用アクセサリに対するビジネス分野での需要が増加しているため、業務用セグメントの成長に有利に働くと予測されます。
アジア太平洋地域は、中国や日本などのノートPC周辺機器の主要市場の存在により、2023年から2030年にかけて最も速いCAGRを記録すると推定されます。
ノートPC周辺機器業界は細分化されているため、ベンダーは競争優位性を獲得するために、顧客に追加特典を提供するなど、成長手法を採用しています。
目次
第1章 調査手法と範囲
- 市場セグメンテーションと範囲
- 市場の定義
- 情報調達
- 購入したデータベース
- GVRの内部データベース
- 二次情報と第三者の視点
- 1次調査
- 情報分析
- データ分析モデル
- 市場形成とデータ可視化
- データの検証と公開
第2章 エグゼクティブサマリー
- 市場の見通し
- タイプ Outlook
- 最終用途の見通し
- 流通経路の見通し
- 地域の見通し
- 競合考察
第3章 ノートPC周辺機器場の変数、動向、範囲
- 市場イントロダクション
- 浸透と成長の見通しのマッピング
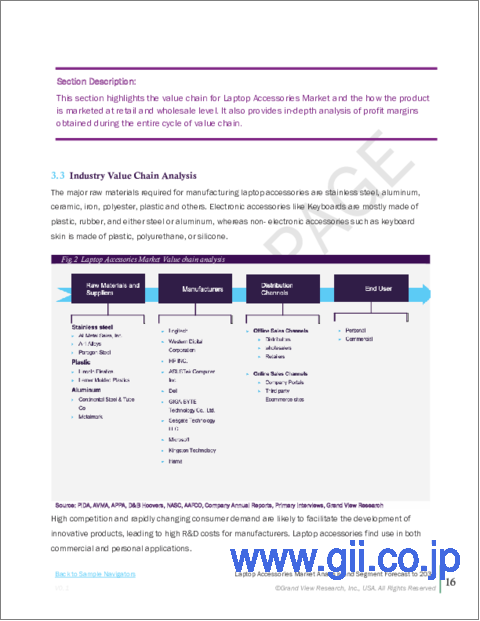
- 業界バリューチェーン分析
- 利益率分析
- 販売チャネル分析
- 市場力学
- 市場促進要因分析
- 市場抑制要因分析
- 業界の課題
- 業界の機会
- 事業環境分析
- 業界分析- ポーターズ
- サプライヤーの力
- 買い手の交渉力
- 代替の脅威
- 新規参入者からの脅威
- 競争企業間の敵対関係
- 業界分析- ポーターズ
- ノートPC周辺機器市場のロードマップ
- 市場参入戦略
- COVID-19がノートPC周辺機器市場に与える影響
第4章 消費者行動分析
- 消費者の動向と好み
- 購入決定に影響を与える要因
- 消費者製品の採用
- 所見と推奨事項
第5章 ノートPC周辺機器場:タイプの推定・動向分析
- タイプの変動分析と市場シェア、2021年と2030年
- 電子
- 充電器とアダプター
- バッテリー
- メモリードライブ
- マウスとキーボード
- オーディオデバイス
- その他(アダプタ、リーダー、冷却ファンなど)
- 非電子
- マウスパッド
- スタンド&ホルダー
- 保護ケース
- その他(キーガード、ラミネート&カバー、盗難防止、クリーニングなど)
第6章 ノートPC周辺機器場:最終用途の推定・動向分析
- 最終用途の変動分析と市場シェア、2021年と2030年
- 個人的
- 商業
第7章 ノートPC周辺機器場:流通チャネルの推定・動向分析
- 流通チャネルの変動分析と市場シェア、2021年と2030年
- オフライン
- eコマース
第8章 ノートPC周辺機器場:地域の推定・動向分析
- 地域別変動分析と市場シェア、2021年と2030年
- 北米
- 米国
- メキシコ
- 欧州
- ドイツ
- 英国
- アジア太平洋地域
- 日本
- オーストラリア
- 中南米
- ブラジル
- 中東とアフリカ
- トルコ
第9章 競合分析
- 主要な世界プレーヤー、最近の動向、業界への影響
- 主要企業/競合の分類(主要なイノベーター、市場リーダー、新興企業)
- ベンダー情勢
- 主要企業の市場シェア分析、2021年
第10章 企業プロファイル
- Logitech
- 会社概要
- 財務実績
- 製品のベンチマーク
- 戦略的イニシアチブ
- Western Hewlett-Packard Company
- 会社概要
- 財務実績
- 製品のベンチマーク
- 戦略的イニシアチブ
- HP INC.
- 会社概要
- 財務実績
- タイプのベンチマーク
- 戦略的イニシアチブ
- ASUSTeK Computer Inc.
- 会社概要
- 財務実績
- 製品のベンチマーク
- 戦略的イニシアチブ
- Dell Inc.
- 会社概要
- 財務実績
- 製品のベンチマーク
- 戦略的イニシアチブ
- GIGA-BYTE Technology Co., Ltd.
- 会社概要
- 財務実績
- 製品のベンチマーク
- 戦略的イニシアチブ
- Seagate Technology LLC
- 会社概要
- 財務実績
- 製品のベンチマーク
- 戦略的イニシアチブ
- Microsoft
- 会社概要
- 財務実績
- 製品のベンチマーク
- 戦略的イニシアチブ
- Kingston Technology
- 会社概要
- 財務実績
- 製品のベンチマーク
- 戦略的イニシアチブ
- Hama
- 会社概要
- 財務実績
- 製品のベンチマーク
- 戦略的イニシアチブ
List of Tables
- 1. Laptop Accessories Market - Driving factor market analysis.
- 2. Laptop Accessories Market - Restraint factor market analysis
- 3. Electronic laptop accessories market estimates and forecast, 2017 - 2030 (USD Billion)
- 4. Non-electronic laptop accessories market estimates and forecast, 2017 - 2030 (USD Billion)
- 5. Offline laptop accessories market estimates and forecast, 2017 - 2030 (USD Billion)
- 6. E-commerce laptop accessories market estimates and forecast, 2017 - 2030 (USD Billion)
- 7. Personal laptop accessories market estimates and forecast, 2017 - 2030 (USD Billion)
- 8. Commercial laptop accessories market estimates and forecast, 2017 - 2030 (USD Billion)
- 9. North America laptop accessories market estimates and forecast, 2017 - 2030 (USD Billion) (Million Transactions)
- 10. North America laptop accessories estimates and forecast, by type, 2017 - 2030 (USD Billion)
- 11. North America laptop accessories estimates and forecast, by distribution channel, 2017 - 2030 (Million Transactions)
- 12. North America laptop accessories market estimates and forecast, by end use, 2017 - 2030 (USD Billion)
- 13. U.S. laptop accessories market estimates and forecast, 2017 - 2030 (USD Billion) (Million Transactions)
- 14. U.S. laptop accessories estimates and forecast, by type, 2017 - 2030 (USD Billion)
- 15. U.S. laptop accessories estimates and forecast, by distribution channel, 2017 - 2030 (Million Transactions)
- 16. U.S. laptop accessories market estimates and forecast, by end use, 2017 - 2030 (USD Billion)
- 17. 13. Mexico laptop accessories market estimates and forecast, 2017 - 2030 (USD Billion) (Million Transactions)
- 18. 14. Mexico laptop accessories estimates and forecast, by type, 2017 - 2030 (USD Billion)
- 19. 15. Mexico laptop accessories estimates and forecast, by distribution channel, 2017 - 2030 (Million Transactions)
- 20. Mexico laptop accessories market estimates and forecast, by end use, 2017 - 2030 (USD Billion)
- 21. Europe laptop accessories market estimates and forecast, 2017 - 2030 (USD Billion) (Million Transactions)
- 22. Europe laptop accessories market estimates and forecast, by type, 2017 - 2030 (USD Billion)
- 23. Europe laptop accessories market estimates and forecast, by distribution channel, 2017 - 2030 (Million Transactions)
- 24. Europe laptop accessories market estimates and forecast, by end use, 2017 - 2030 (Million Transactions)
- 25. Germany laptop accessories market estimates and forecast, 2017 - 2030 (USD Billion) (Million Transactions)
- 26. Germany laptop accessories market estimates and forecast, by type, 2017 - 2030 (USD Billion)
- 27. Germany laptop accessories market estimates and forecast, by distribution channel, 2017 - 2030 (Million Transactions)
- 28. Germany laptop accessories market estimates and forecast, by end use, 2017 - 2030 (Million Transections)
- 29. U.K. laptop accessories market estimates and forecast, 2017 - 2030 (USD Billion) (Million Transactions)
- 30. U.K. laptop accessories market estimates and forecast, by type, 2017 - 2030 (USD Billion)
- 31. U.K. laptop accessories market estimates and forecast, by distribution channel, 2017 - 2030 (Million Transactions)
- 32. U.K. laptop accessories market estimates and forecast, by end use, 2017 - 2030 (Million Transactions)
- 33. Asia Pacific laptop accessories market estimates and forecast, 2017 - 2030 (USD Billion) (Million Transactions)
- 34. Asia Pacific laptop accessories estimates and forecast, by type, 2017 - 2030 (USD Billion)
- 35. Asia Pacific laptop accessories estimates and forecast, by distribution channel, 2017 - 2030 (Million Transactions)
- 36. Asia Pacific laptop accessories market estimates and forecast, by end use, 2017 - 2030 (Million Transactions)
- 37. Japan laptop accessories market estimates and forecast, 2017 - 2030 (USD Billion) (Million Transactions)
- 38. Japan laptop accessories estimates and forecast, by type, 2017 - 2030 (USD Billion)
- 39. Japan laptop accessories estimates and forecast, by distribution channel, 2017 - 2030 (Million Transactions)
- 40. Japan laptop accessories market estimates and forecast, by end use, 2017 - 2030 (Million Transactions)
- 41. Australia laptop accessories market estimates and forecast, 2017 - 2030 (USD Billion) (Million Transactions)
- 42. Australia laptop accessories estimates and forecast, by type, 2017 - 2030 (USD Billion)
- 43. Australia laptop accessories estimates and forecast, by distribution channel, 2017 - 2030 (Million Transactions)
- 44. Australia laptop accessories market estimates and forecast, by end use, 2017 - 2030 (Million Transactions)
- 45. Central & South America laptop accessories market estimates and forecast, 2017 - 2030 (USD Billion) (Million Transactions)
- 46. Central & South America laptop accessories estimates and forecast, by type, 2017 - 2030 (USD Billion)
- 47. Central & South America laptop accessories estimates and forecast, by distribution channel, 2017 - 2030 (Million Transactions)
- 48. Central & South America laptop accessories market estimates and forecast, by end use, 2017 - 2030 (Million Transactions)
- 49. Brazil laptop accessories market estimates and forecast, 2017 - 2030 (USD Billion) (Million Transactions)
- 50. Brazil laptop accessories estimates and forecast, by type, 2017 - 2030 (USD Billion)
- 51. Brazil laptop accessories estimates and forecast, by distribution channel, 2017 - 2030 (Million Transactions)
- 52. Brazil laptop accessories market estimates and forecast, by end use, 2017 - 2030 (Million Transections)
- 53. Middle East & Africa laptop accessories market estimates and forecast, 2017 - 2030 (USD Billion) (Million Transactions)
- 54. Middle East & Africa laptop accessories estimates and forecast, by type, 2017 - 2030 (USD Billion)
- 55. Middle East & Africa laptop accessories estimates and forecast, by distribution channel, 2017 - 2030 (Million Transactions)
- 56. Middle East & Africa laptop accessories market estimates and forecast, by end use, 2017 - 2030 (Million Transactions)
- 57. Turkey laptop accessories market estimates and forecast, 2017 - 2030 (USD Billion) (Million Transactions)
- 58. Turkey laptop accessories estimates and forecast, by type, 2017 - 2030 (USD Billion)
- 59. Turkey laptop accessories estimates and forecast, by distribution channel, 2017 - 2030 (Million Transactions)
- 60. Turkey laptop accessories market estimates and forecast, by end use, 2017 - 2030 (Million Transactions)
- 61. Merger and acquisition deals executed in the period of 2020 and 2021.
- 62. Company categorization
List of Figures
- 1. Laptop Accessories Market segmentation
- 2. Information procurement
- 3. Primary research pattern
- 4. Primary research approaches
- 5. Primary research process
- 6. Laptop Accessories Market - Penetration & growth prospect mapping, by type
- 7. Laptop Accessories Market - Value chain analysis
- 8. Laptop Accessories Market: Porter's Five Forces Analysis
- 9. Roadmap of the laptop accessories market
- 10. Factors affecting consumers buying decision
- 11. Laptop Accessories Market: Type share (%) analysis, 2021 & 2030
- 12. Laptop Accessories Market: Distribution channel share (%) analysis, 2021 & 2030
- 13. Laptop Accessories Market: End-use share (%) analysis, 2021 & 2030
- 14. Laptop Accessories Market: Regional share (%) analysis, 2021 & 2030
- 15. Laptop Accessories Market: Company market share, 2021(%)
Laptop Accessories Market Growth & Trends:
The global laptop accessories market size was valued at USD 65.63 billion in 2030, registering a CAGR of 6.3% from 2023 to 2030, according to a new report by Grand View Research, Inc. The demand for laptop accessories is primarily driven by the growing popularity of e-sports and the adoption of process automation in industries. Personal computer sales were predicted to decrease ten years ago, but it has only recently witnessed their first significant increase in a decade. In 2021, according to a market research firm, Canalys, PC shipments reached 297 million units in 2020, up 11% from 2019. IDC estimates 302 million shipments for the year, up 13.1% year over year. Booming sales of laptops are boosting the demand for accessories.
Improving fashion trends, rising disposable income, and changing consumer lifestyles & preferences are expected to boost the industry growth. The pandemic prompted lockdowns around the world, starting from the first quarter of 2020. The work-from-home and study-from-home trends due to the COVID-19 pandemic have benefited the overall personal computer market, including laptops and desktop systems, with sales exceeding 302 million in 2020, a 13% increase from the year before and the most since 2014. This bodes well for the sales of various laptop accessories. As per the Canlys Research study, the PC market growth accelerated in the last quarter of 2020, as shipments of desktops, notebooks and workstations increased by 25% from a year ago to reach a record 90.3 million units.
The global PC market growth in 2020 was singlehandedly driven by notebooks and mobile workstations. Shipments of these devices increased by 25% from 2019 to 235.1 million units. Therefore, the significant growth in the PC industry during the COVID-19 pandemic further augmented the industry growth. An increase in the shipments of personal computers, including notebooks and other laptops during the COVID-19 pandemic, further increased the demand for the laptop accessories, such as mouse, keyboards, and others, and contributed to market growth. The electronic type segment accounted for the largest revenue share in 2022 and is expected to witness significant growth in the near future.
Demand for laptops has increased as lockdown restrictions were eased owing to the increased need for work-from-home and the push for online learning. Increased searches for new and reconditioned devices have been observed on e-commerce platforms. This increase in demand for laptops is boosting the demand for electronic accessories, such as wireless keyboards and mouse. Businesses have added more equipment to their office infrastructure because of laptops' non-portable capabilities and functionalities. The offline segment dominated the industry in 2022. This is mainly because a large section of consumers still prefers the physical shopping of electronic appliances. As a result, an increase in the number of retail establishments is predicted to improve product sales through offline channels, particularly in growing nations, such as India, China, and Brazil.
Increased product visibility and a strong presence of large international firms in expanding APAC countries through newly established strategic business units are likely to support the segment growth throughout the forecast period. Asia Pacific accounted for the largest revenue share in 2022. In Asia Pacific, the primary markets for laptop accessories are China, Japan, and South Korea (Republic of Korea). Rapid industrialization is also contributing to the growth of consumer electronics in the region. Companies focus on product innovations to meet the rising product demand and to set trends. Strategic initiatives, such as mergers and acquisitions, help the key players gain a foothold in developing economies.
Laptop Accessories Market Report Highlights:
- The demand for laptops has increased as lockdown restrictions were eased owing to the increased need for work-from-home and the push for online learning
- The commercial segment is expected to register the highest CAGR during the forecast period
- The increasing demand for laptop accessories, such as webcams, speakers, and pointing devices, from the business sector, is expected to favor the growth of the commercial segment
- Asia Pacific is estimated to register the fastest CAGR from 2023 to 2030 due to the presence of the primary markets for laptop accessories, such as China and Japan
- Since the laptop accessories industry is fragmented, vendors are employing growth methods, such as offering additional perks to customers, to acquire a competitive advantage
Table of Contents
Chapter 1. Methodology and Scope
- 1.1. Market Segmentation & Scope
- 1.2. Market Definition
- 1.3. Information Procurement
- 1.3.1. Purchased Database
- 1.3.2. GVR's Internal Database
- 1.3.3. Secondary Sources & Third-Party Perspectives
- 1.3.4. Primary Research
- 1.4. Information Analysis
- 1.4.1. Data Analysis Models
- 1.5. Market Formulation & Data Visualization
- 1.6. Data Validation & Publishing
Chapter 2. Executive Summary
- 2.1. Market Outlook
- 2.2. Type Outlook
- 2.3. End-use Outlook
- 2.4. Distribution Channel Outlook
- 2.5. Regional Outlook
- 2.6. Competitive Insights
Chapter 3. Laptop Accessories Market Variables, Trends & Scope
- 3.1. Market Introduction
- 3.2. Penetration & Growth Prospect Mapping
- 3.3. Industry Value Chain Analysis
- 3.3.1. Profit Margin Analysis
- 3.3.2. Sales Channel Analysis
- 3.4. Market Dynamics
- 3.4.1. Market Driver Analysis
- 3.4.2. Market Restraint Analysis
- 3.4.3. Industry Challenges
- 3.4.4. Industry Opportunities
- 3.5. Business Environment Analysis
- 3.5.1. Industry Analysis - Porter's
- 3.5.1.1. Supplier Power
- 3.5.1.2. Buyer Power
- 3.5.1.3. Substitution Threat
- 3.5.1.4. Threat from New Entrant
- 3.5.1.5. Competitive Rivalry
- 3.5.1. Industry Analysis - Porter's
- 3.6. Roadmap of the Laptop Accessories Market
- 3.7. Market Entry Strategies
- 3.8. Impact of COVID-19 on the Laptop Accessories Market
Chapter 4. Consumer Behavior Analysis
- 4.1. Consumer Trends and Preferences
- 4.2. Factors Affecting Buying Decision
- 4.3. Consumer Product Adoption
- 4.4. Observations & Recommendations
Chapter 5. Laptop Accessories Market: Type Estimates & Trend Analysis
- 5.1. Type Movement Analysis & Market Share, 2021 & 2030
- 5.2. Electronic
- 5.2.1. Charger & Adapter
- 5.2.2. Battery
- 5.2.3. Memory Drives
- 5.2.4. Mouse & Keyboard
- 5.2.5. Audio Devices
- 5.2.6. Others (adapters, readers, cooling fan, etc.)
- 5.3. Non-electronic
- 5.3.1. Mouse Pad
- 5.3.2. Stand & Holder
- 5.3.3. Protective Case
- 5.3.4. Others (Key guards, laminates & covers, anti-thefts, cleaning, etc.)
Chapter 6. Laptop Accessories Market: End-use Estimates& Trend Analysis
- 6.1. End-use Movement Analysis & Market Share, 2021 & 2030
- 6.2. Personal
- 6.2.1. Market estimates and forecast, 2017 - 2030 (USD Billion)
- 6.3. Commercial
- 6.3.1. Market estimates and forecast, 2017 - 2030 (USD Billion)
Chapter 7. Laptop Accessories Market: Distribution Channel Estimates & Trend Analysis
- 7.1. Distribution Channel Movement Analysis & Market Share, 2021 & 2030
- 7.2. Offline
- 7.2.1. Market estimates and forecast, 2017 - 2030 (USD Billion)
- 7.3. E-commerce
- 7.3.1. Market estimates and forecast, 2017 - 2030 (USD Billion)
Chapter 8. Laptop Accessories Market: Regional Estimates & Trend Analysis
- 8.1. Regional Movement Analysis & Market Share, 2021 & 2030
- 8.2. North America
- 8.2.1. Market estimates and forecast, 2017 - 2030 (USD Billion)
- 8.2.2. Market estimates and forecast, by type, 2017 - 2030 (USD Billion)
- 8.2.3. Market estimates and forecast, by end use, 2017 - 2030 (USD Billion)
- 8.2.4. Market estimates and forecast, by distribution channel, 2017 - 2030 (USD Billion)
- 8.2.5. U.S.
- 8.2.5.1. Market estimates and forecast, 2017 - 2030 (USD Billion)
- 8.2.5.2. Market estimates and forecast, by type, 2017 - 2030 (USD Billion)
- 8.2.5.3. Market estimates and forecast, by end use, 2017 - 2030 (USD Billion)
- 8.2.5.4. Market estimates and forecast, by distribution channel, 2017 - 2030 (USD Billion)
- 8.2.6. Mexico
- 8.2.6.1. Market estimates and forecast, 2017 - 2030 (USD Billion)
- 8.2.6.2. Market estimates and forecast, by type, 2017 - 2030 (USD Billion)
- 8.2.6.3. Market estimates and forecast, by end use, 2017 - 2030 (USD Billion)
- 8.2.6.4. Market estimates and forecast, by distribution channel, 2017 - 2030 (USD Billion)
- 8.3. Europe
- 8.3.1. Market estimates and forecast, 2017 - 2030 (USD Billion)
- 8.3.2. Market estimates and forecast, by type, 2017 - 2030 (USD Billion)
- 8.3.3. Market estimates and forecast, by end use, 2017 - 2030 (USD Billion)
- 8.3.4. Market estimates and forecast, by distribution channel, 2017 - 2030 (USD Billion)
- 8.3.5. Germany
- 8.3.5.1. Market estimates and forecast, 2017 - 2030 (USD Billion)
- 8.3.5.2. Market estimates and forecast, by type, 2017 - 2030 (USD Billion)
- 8.3.5.3. Market estimates and forecast, by end use, 2017 - 2030 (USD Billion)
- 8.3.5.4. Market estimates and forecast, by distribution channel, 2017 - 2030 (USD Billion)
- 8.3.6. U.K.
- 8.3.6.1. Market estimates and forecast, 2017 - 2030 (USD Billion)
- 8.3.6.2. Market estimates and forecast, by type, 2017 - 2030 (USD Billion)
- 8.3.6.3. Market estimates and forecast, by end use, 2017 - 2030 (USD Billion)
- 8.3.6.4. Market estimates and forecast, by distribution channel, 2017 - 2030 (USD Billion)
- 8.4. Asia Pacific
- 8.4.1. Market estimates and forecast, 2017 - 2030 (USD Billion)
- 8.4.2. Market estimates and forecast, by type, 2017 - 2030 (USD Billion)
- 8.4.3. Market estimates and forecast, by end use, 2017 - 2030 (USD Billion)
- 8.4.4. Market estimates and forecast, by distribution channel, 2017 - 2030 (USD Billion)
- 8.4.5. Japan
- 8.4.5.1. Market estimates and forecast, 2017 - 2030 (USD Billion)
- 8.4.5.2. Market estimates and forecast, by type, 2017 - 2030 (USD Billion)
- 8.4.5.3. Market estimates and forecast, by end use, 2017 - 2030 (USD Billion)
- 8.4.5.4. Market estimates and forecast, by distribution channel, 2017 - 2030 (USD Billion)
- 8.4.6. Australia
- 8.4.6.1. Market estimates and forecast, 2017 - 2030 (USD Billion)
- 8.4.6.2. Market estimates and forecast, by type, 2017 - 2030 (USD Billion)
- 8.4.6.3. Market estimates and forecast, by end use, 2017 - 2030 (USD Billion)
- 8.4.6.4. Market estimates and forecast, by distribution channel, 2017 - 2030 (USD Billion)
- 8.5. Central and South America
- 8.5.1. Market estimates and forecast, 2017 - 2030 (USD Billion)
- 8.5.2. Market estimates and forecast, by type, 2017 - 2030 (USD Billion)
- 8.5.3. Market estimates and forecast, by end use, 2017 - 2030 (USD Billion)
- 8.5.4. Market estimates and forecast, by distribution channel, 2017 - 2030 (USD Billion)
- 8.5.5. Brazil
- 8.5.5.1. Market estimates and forecast, 2017 - 2030 (USD Billion)
- 8.5.5.2. Market estimates and forecast, by type, 2017 - 2030 (USD Billion)
- 8.5.5.3. Market estimates and forecast, by end use, 2017 - 2030 (USD Billion)
- 8.5.5.4. Market estimates and forecast, by distribution channel, 2017 - 2030 (USD Billion)
- 8.6. Middle East and Africa
- 8.6.1. Market estimates and forecast, 2017 - 2030 (USD Billion)
- 8.6.2. Market estimates and forecast, by type, 2017 - 2030 (USD Billion)
- 8.6.3. Market estimates and forecast, by end use, 2017 - 2030 (USD Billion)
- 8.6.4. Market estimates and forecast, by distribution channel, 2017 - 2030 (USD Billion)
- 8.6.5. Turkey
- 8.6.5.1. Market estimates and forecast, 2017 - 2030 (USD Billion)
- 8.6.5.2. Market estimates and forecast, by type, 2017 - 2030 (USD Billion)
- 8.6.5.3. Market estimates and forecast, by end use, 2017 - 2030 (USD Billion)
- 8.6.5.4. Market estimates and forecast, by distribution channel, 2017 - 2030 (USD Billion)
Chapter 9. Competitive Analysis
- 9.1. Key global players, recent developments & their impact on the industry
- 9.2. Key Company/Competition Categorization (Key innovators, Market leaders, Emerging players)
- 9.3. Vendor Landscape
- 9.3.1. Key company market share analysis, 2021
Chapter 10. Company Profiles
- 10.1. Logitech
- 10.1.1. Company Overview
- 10.1.2. Financial Performance
- 10.1.3. Product Benchmarking
- 10.1.4. Strategic Initiatives
- 10.2. Western Hewlett-Packard Company
- 10.2.1. Company Overview
- 10.2.2. Financial Performance
- 10.2.3. Product Benchmarking
- 10.2.4. Strategic Initiatives
- 10.3. HP INC.
- 10.3.1. Company Overview
- 10.3.2. Financial Performance
- 10.3.3. Type Benchmarking
- 10.3.4. Strategic Initiatives
- 10.4. ASUSTeK Computer Inc.
- 10.4.1. Company Overview
- 10.4.2. Financial Performance
- 10.4.3. Product Benchmarking
- 10.4.4. Strategic Initiatives
- 10.5. Dell Inc.
- 10.5.1. Company Overview
- 10.5.2. Financial Performance
- 10.5.3. Product Benchmarking
- 10.5.4. Strategic Initiatives
- 10.6. GIGA-BYTE Technology Co., Ltd.
- 10.6.1. Company Overview
- 10.6.2. Financial Performance
- 10.6.3. Product Benchmarking
- 10.6.4. Strategic Initiatives
- 10.7. Seagate Technology LLC
- 10.7.1. Company Overview
- 10.7.2. Financial Performance
- 10.7.3. Product Benchmarking
- 10.7.4. Strategic Initiatives
- 10.8. Microsoft
- 10.8.1. Company Overview
- 10.8.2. Financial Performance
- 10.8.3. Product Benchmarking
- 10.8.4. Strategic Initiatives
- 10.9. Kingston Technology
- 10.9.1. Company Overview
- 10.9.2. Financial Performance
- 10.9.3. Product Benchmarking
- 10.9.4. Strategic Initiatives
- 10.10. Hama
- 10.10.1. Company Overview
- 10.10.2. Financial Performance
- 10.10.3. Product Benchmarking
- 10.10.4. Strategic Initiatives