|
|
市場調査レポート
商品コード
1178646
エルゴノミクスチェアの市場規模、シェア、動向分析レポート:製品別、素材別(プラスチック、スチール)、最終用途別(住宅、商業)、地域別、セグメント別予測、2023年~2030年Ergonomic Chair Market Size, Share & Trends Analysis Report By Product (Swivel, Adjustable, Flexible), By Material (Plastic, Steel), By End-user (Residential, Commercial), By Region, And Segment Forecasts, 2023 - 2030 |
||||||
|
|
|||||||
|
● お客様のご希望に応じて、既存データの加工や未掲載情報(例:国別セグメント)の追加などの対応が可能です。 詳細はお問い合わせください。 |
|||||||


| エルゴノミクスチェアの市場規模、シェア、動向分析レポート:製品別、素材別(プラスチック、スチール)、最終用途別(住宅、商業)、地域別、セグメント別予測、2023年~2030年 |
|
出版日: 2022年12月22日
発行: Grand View Research
ページ情報: 英文 80 Pages
納期: 2~10営業日
|
- 全表示
- 概要
- 図表
- 目次
エルゴノミクスチェアの市場成長と動向
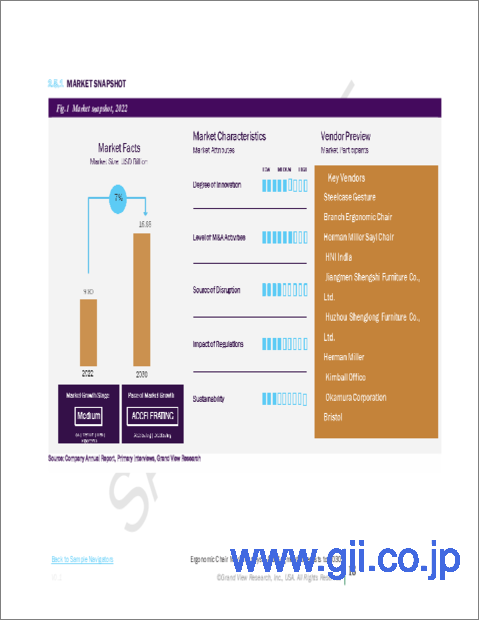
株式会社グランドビューリサーチの最新レポートによると、エルゴノミクスチェアの世界市場規模は2030年には168億8000万米ドルに達すると予測されています。同市場は2023年から2030年にかけてCAGR7%で拡大すると予測されています。企業のオフィスなどの商業空間の急速な拡大や、改装プロジェクトの急増が、今後数年間のオフィス家具の需要を促進すると予想されます。また、労働文化にかなりの変化が見られ、共同作業用のワークプレイスデザインが顕著に増加しています。
オフィス向けエルゴノミクスチェアは、企業など座っている時間が長い場所で使用されるのが一般的です。エルゴノミクスチェアの市場は、世界の労働力の拡大や従業員の健康志向の高まりなどを背景に拡大しています。
メーカー各社は、最小限のスペースで快適な作業環境を提供するため、チェアの機能を高め、人間工学に基づいたシートなど耐久性のあるオフィス家具製品を提供しています。例えば、2019年にハーマンミラー社から発売された「Cosm」。実用性と品質が高いチェアで、耐久性もかなり高いです。オフィス空間の豪華な調度品は、従業員の生産性を高めます。
多くの場所でエルゴノミクスチェア市場の巨大な需要があるため、政府と中小企業は商業インフラの拡大に集中しています。さらに、様々な生産施設は製品のイノベーションに注力しており、これがエルゴノミクスチェア市場の需要に影響を与えています。しかし、エルゴノミクスチェアの可動域の狭さや価格の高さが、市場の拡大を抑制すると予想されます。
売上を伸ばすために、製造企業は多国籍企業と協業しています。オフィスチェアを活用し、便利だと感じた人が自宅やオフィス用にエルゴノミクスチェアを購入するという戦略です。COVID-19のイントロダクションの後、リモートワークが一般的になり、今や労働者の日常業務の一部となっています。
地域ブランドから国際ブランドへと移行する消費者は、様々な色や素材が利用できることに加え、デザインや美的魅力の影響を受けています。高い耐久性、標準的な試験、BIFMA(Business and Institutional Furniture Manufacturers Association)やLEED(Leadership in Energy and Environmental Design)などの認証、保証などが、消費者が国際ブランドにシフトしていく上で一役買っているのです。
エルゴノミクスチェア市場のレポートハイライト
予測期間中、住宅用セグメントが市場を独占すると予想されます。商業分野では、雇用の新時代がついに到来しました。正社員からリモートワークへの移行に伴い、ホームオフィス用家具の市場が拡大。様々な場所でホームオフィス家具の需要が急増しているのは、このバーチャルワークの時代の到来によるものです。
スチール部門は、革新的な製品の発売が増加し、市場を独占しています。好調な経済成長と消費者の消費意欲の高まりも成長を後押ししています。エルゴノミクスチェアに使用される素材の組み合わせやカスタムメイドの動向も、同分野の成長を後押ししています。
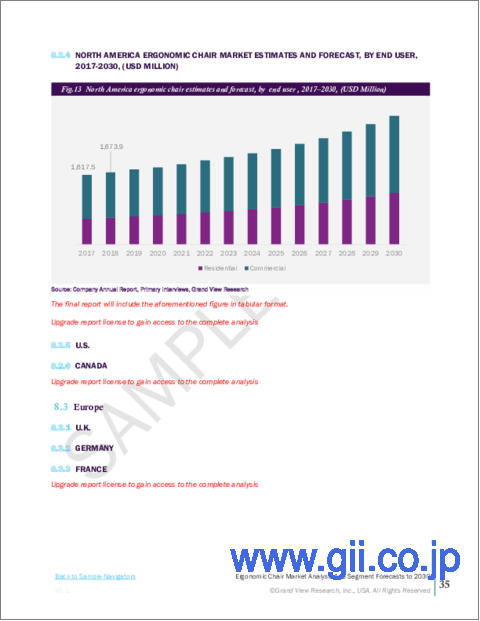
2022年、北米が最大の収益シェアを占める。人口の増加と生活水準の向上が、過去数年の同地域の建設部門の成長見通しに拍車をかけています。また、消費者の選択が個人の健康や座る習慣、環境に与える影響に対する意識の高まりが、同地域におけるエルゴノミクスチェアの需要増加に向けて着実に進んでいます。
目次
第1章 調査手法と範囲
- 市場セグメンテーションと範囲
- 市場の定義
- 情報調達
- 購入したデータベース
- GVRの内部データベース
- 二次情報と第三者の視点
- 1次調査
- 情報分析
- データ分析モデル
- 市場形成とデータ可視化
- データの検証と公開
第2章 エグゼクティブサマリー
- 市場の見通し
- 製品の見通し
- マテリアル・アウトルック
- エンドユーザーの見通し
- 地域の見通し
第3章 エルゴノミクスチェア市場の変数、動向、範囲
- 市場イントロダクション
- 浸透と成長の見通しのマッピング
- 業界バリューチェーン分析
- 販売・小売チャネル分析
- 利益率分析
- 市場力学
- 市場促進要因分析
- 市場抑制要因分析
- 業界の課題
- 業界の機会
- 事業環境分析
- 業界分析- ポーターズ
- サプライヤーの力
- 買い手の交渉力
- 代替の脅威
- 新規参入者からの脅威
- 競争企業間の敵対関係
- エルゴノミクスチェア市場のロードマップ
- 市場参入戦略
- COVID-19がエルゴノミクスチェア市場に与える影響
第4章 消費者行動分析
- 人口統計分析
- 消費者の動向と好み
- 購入決定に影響を与える要因
- コンシューマアプリケーションの採用
- 所見と推奨事項
第5章 エルゴノミクスチェア市場:製品の推定・動向分析
- 製品変動分析と市場シェア、2021年と2030年
- 回転椅子
- 調節可能な椅子
- 固定椅子
第6章 エルゴノミクスチェア市場:配置推定・動向分析
- マテリアル変動分析と市場シェア、2021年と2030年
- プラスチック
- 鋼
- その他(ビニール、メッシュ、レザー)
第7章 エルゴノミクスチェア市場:エンドユーザーの推定・動向分析
- エンドユーザーの変動分析と市場シェア、2021年と2030年
- 住宅
- 商業
第8章 エルゴノミクスチェア市場:地域の推定・動向分析
- 地域別変動分析と市場シェア、2021年と2030年
- 北米
- 米国
- カナダ
- 欧州
- 英国
- ドイツ
- フランス
- アジア太平洋地域
- 中国
- インド
- 日本
- 南米
- ブラジル
- 中東およびアフリカ
- 南アフリカ
第9章 競合分析
- 主要な世界プレーヤー、最近の動向、業界への影響
- 主要企業/競合の分類(主要なイノベーター、市場リーダー、新興企業)
- ベンダー情勢
- 主要企業の市場シェア分析、2021年
第10章 企業プロファイル
- Steelcase Gesture
- 会社概要
- 財務実績
- アプリケーションのベンチマーク
- 戦略的イニシアチブ
- Branch Ergonomic Chair
- 会社概要
- 財務実績
- アプリケーションのベンチマーク
- Herman Miller Sayl Chair
- 会社概要
- 財務実績
- アプリケーションのベンチマーク
- 戦略的イニシアチブ
- HNI India
- 会社概要
- 財務実績
- アプリケーションのベンチマーク
- 戦略的イニシアチブ
- Jiangmen Shengshi Furniture Co., Ltd.
- 会社概要
- 財務実績
- アプリケーションのベンチマーク
- 戦略的イニシアチブ
- Huzhou Shenglong Furniture Co., Ltd.
- 会社概要
- 財務実績
- アプリケーションのベンチマーク
- 戦略的イニシアチブ
- Herman Miller
- 会社概要
- 財務実績
- アプリケーションのベンチマーク
- 戦略的イニシアチブ
- Kimball Office
- 会社概要
- 財務実績
- アプリケーションのベンチマーク
- 戦略的イニシアチブ
- Okamura Corporation
- 会社概要
- 財務実績
- アプリケーションのベンチマーク
- 戦略的イニシアチブ
- Bristol
- 会社概要
- 財務実績
- 製品のベンチマーク
- 戦略的イニシアチブ
List of Tables
- 1. Ergonomic Chair market - Driving factor market analysis
- 2. Ergonomic Chair market - Restraint factor market analysis
- 3. Ergonomic Chair market estimates and forecast for swivel ergonomic chair, 2017 - 2030 (USD Million)
- 4. Ergonomic Chair market estimates and forecast for adjustable ergonomic chair, 2017 - 2030 (USD Million)
- 5. Ergonomic Chair market estimates and forecast for fixed ergonomic chair, 2017 - 2030 (USD Million)
- 6. Ergonomic Chair market estimates and forecast for plastic, 2017 - 2030 (USD Million)
- 7. Ergonomic Chair market estimates and forecast for steel, 2017 - 2030 (USD Million)
- 8. Ergonomic Chair market estimates and forecast for others, 2017 - 2030 (USD Million)
- 9. Ergonomic Chair market estimates and forecast, through residential, 2017 - 2030 (USD million)
- 10. Ergonomic Chair market estimates and forecast, through commercial, 2017 - 2030 (USD million)
- 11. North America Ergonomic Chair market estimates and forecast, 2017 - 2030 (USD Million)
- 12. North America Ergonomic Chair Market estimates and forecast, by product, 2017 - 2030 (USD Million)
- 13. North America Ergonomic Chair Market estimates and forecast, by material, 2017 - 2030 (USD Million)
- 14. North America Ergonomic Chair Market estimates and forecast, by end-user, 2017 - 2030 (USD Million)
- 15. U.S. Ergonomic Chair market estimates and forecast, 2017 - 2030 (USD Million)
- 16. U.S. Ergonomic Chair Market estimates and forecast, by product, 2017 - 2030 (USD Million)
- 17. U.S. Ergonomic Chair Market estimates and forecast, by material, 2017 - 2030 (USD Million)'
- 18. U.S. Enameled cookwar9e Market estimates and forecast, by end-user, 2017 - 2030 (USD Million)
- 19. Canada Ergonomic Chair market estimates and forecast, 2017 - 2030 (USD Million)
- 20. Canada Ergonomic Chair Market estimates and forecast, by product, 2017 - 2030 (USD Million)
- 21. Canada Ergonomic Chair Market estimates and forecast, by material, 2017 - 2030 (USD Million)
- 22. Canada Enameled cookwar9e Market estimates and forecast, by end-user, 2017 - 2030 (USD Million)
- 23. Europe Ergonomic Chair market estimates and forecast, 2017 - 2030 (USD Million)
- 24. Europe Ergonomic Chair Market estimates and forecast, by product, 2017 - 2030 (USD Million)
- 25. Europe Ergonomic Chair Market estimates and forecast, by material, 2017 - 2030 (USD Million)
- 26. Europe Ergonomic Chair Market estimates and forecast, by end-user, 2017 - 2030 (USD Million)
- 27. U.K. Ergonomic Chair market estimates and forecast, 2017 - 2030 (USD Million)
- 28. U.K. Ergonomic Chair Market estimates and forecast, by product, 2017 - 2030 (USD Million)
- 29. U.K. Ergonomic Chair Market estimates and forecast, by material, 2017 - 2030 (USD Million)
- 30. U.K. Ergonomic Chair Market estimates and forecast, by end-user, 2017 - 2030 (USD Million)
- 31. Germany Ergonomic Chair market estimates and forecast, 2017 - 2030 (USD Million)
- 32. Germany Ergonomic Chair Market estimates and forecast, by product, 2017 - 2030 (USD Million)
- 33. Germany Ergonomic Chair Market estimates and forecast, by material, 2017 - 2030 (USD Million)
- 34. Germany Ergonomic Chair Market estimates and forecast, by end-user, 2017 - 2030 (USD Million)
- 35. France Ergonomic Chair market estimates and forecast, 2017 - 2030 (USD Million)
- 36. France Ergonomic Chair Market estimates and forecast, by product, 2017 - 2030 (USD Million)
- 37. France Ergonomic Chair Market estimates and forecast, by material, 2017 - 2030 (USD Million)
- 38. France Ergonomic Chair Market estimates and forecast, by end-user, 2017 - 2030 (USD Million)
- 39. Asia Pacific Ergonomic Chair market estimates and forecast, 2017 - 2030 (USD Million)
- 40. Asia Pacific Ergonomic Chair Market estimates and forecast, by product, 2017 - 2030 (USD Million)
- 41. Asia Pacific Ergonomic Chair Market estimates and forecast, by material, 2017 - 2030 (USD Million)
- 42. Asia Pacific Ergonomic Chair Market estimates and forecast, by end-user, 2017 - 2030 (USD Million)
- 43. China Ergonomic Chair market estimates and forecast, 2017 - 2030 (USD Million)
- 44. China Ergonomic Chair Market estimates and forecast, by product, 2017 - 2030 (USD Million)
- 45. China Ergonomic Chair Market estimates and forecast, by material, 2017 - 2030 (USD Million)
- 46. China Ergonomic Chair Market estimates and forecast, by end-user, 2017 - 2030 (USD Million)
- 47. India Ergonomic Chair market estimates and forecast, 2017 - 2030 (USD Million)
- 48. India Ergonomic Chair Market estimates and forecast, by product, 2017 - 2030 (USD Million)
- 49. India Ergonomic Chair Market estimates and forecast, by material, 2017 - 2030 (USD Million)
- 50. India Ergonomic Chair Market estimates and forecast, by end-user, 2017 - 2030 (USD Million)
- 51. Japan Ergonomic Chair market estimates and forecast, 2017 - 2030 (USD Million)
- 52. Japan Ergonomic Chair Market estimates and forecast, by product, 2017 - 2030 (USD Million)
- 53. Japan Ergonomic Chair Market estimates and forecast, by material, 2017 - 2030 (USD Million)
- 54. Japan Ergonomic Chair Market estimates and forecast, by end-user, 2017 - 2030 (USD Million)
- 55. South America Ergonomic Chair market estimates and forecast, 2017 - 2030 (USD Million)
- 56. South America Ergonomic Chair Market estimates and forecast, by product, 2017 - 2030 (USD Million)
- 57. South America Ergonomic Chair Market estimates and forecast, by material, 2017 - 2030 (USD Million)
- 58. South America Ergonomic Chair Market estimates and forecast, by end-user, 2017 - 2030 (USD Million)
- 59. Brazil Ergonomic Chair market estimates and forecast, 2017 - 2030 (USD Million)
- 60. Brazil Ergonomic Chair Market estimates and forecast, by product, 2017 - 2030 (USD Million)
- 61. Table 64 Brazil Ergonomic Chair Market estimates and forecast, by material, 2017 - 2030 (USD Million)
- 62. Brazil Ergonomic Chair Market estimates and forecast, by end-user, 2017 - 2030 (USD Million)
- 63. Middle East & Africa Ergonomic Chair market estimates and forecast, 2017 - 2030 (USD Million)
- 64. Middle East & Africa Ergonomic Chair Market estimates and forecast, by product, 2017 - 2030 (USD Million)
- 65. Middle East & Africa Ergonomic Chair Market estimates and forecast, by material, 2017 - 2030 (USD Million)
- 66. Middle East & Africa Ergonomic Chair Market estimates and forecast, by end-user, 2017 - 2030 (USD Million)
- 67. South Africa Ergonomic Chair market estimates and forecast, 2017 - 2030 (USD Million)
- 68. South Africa Ergonomic Chair Market estimates and forecast, by product, 2017 - 2030 (USD Million)
- 69. South Africa Ergonomic Chair Market estimates and forecast, by material, 2017 - 2030 (USD Million)
- 70. South Africa Ergonomic Chair Market estimates and forecast, by end-user, 2017 - 2030 (USD Million)
- 71. Company categorization
List of Figures
- 1. Ergonomic chair market segmentation
- 2. Information procurement
- 3. Primary research pattern
- 4. Primary research approaches
- 5. Primary research process
- 6. Ergonomic chair market - Application growth
- 7. Ergonomic chair market - Value chain analysis
- 8. Ergonomic chair market - Retail chain analysis
- 9. Ergonomic chair market - Profit margin analysis
- 10. COVID-19 shifted spending to the home
- 11. Ergonomic chair market: Porter's Five Forces Analysis
- 12. Roadmap of Ergonomic chair market
- 13. Factors affecting consumer buying decisions in the Ergonomic chair market
- 14. Ergonomic chair market: Product share (%) analysis, 2021 & 2030
- 15. Ergonomic chair market: Material share (%) analysis, 2021 & 2030
- 16. Ergonomic chair market: end-user share (%) analysis, 2021 & 2030
- 17. Ergonomic chair market: Regional share (%) analysis, 2021 & 2030
- 18. Ergonomic chair market: Estimated company market share analysis, 2021
Ergonomic Chair Market Growth & Trends:
The global ergonomic chair market size is expected to reach USD 16.88 billion by 2030, according to a new report by Grand View Research, Inc. The market is anticipated to expand at a CAGR of 7% from 2023 to 2030. The rapid expansion of commercial spaces, such as corporate offices, and a surge in remodeling projects are expected to drive the demand for office furniture in the coming years. In addition, there has been a considerable change in work cultures and a notable rise in collaborative workplace design.
An ergonomic office chair is typically used in businesses and other settings where staff members spend a lot of time sitting down. The market for ergonomic office chairs is expanding as a result of factors including an expanding workforce and rising employee concerns about their health and well-being on a global scale.
Manufacturers are providing increased features on chairs that accept the least amount of space and offer a comfortable working environment to create durable office furniture products like ergonomic seats. For instance, Cosm was introduced by Herman Miller in 2019. It is a chair with a high level of utility and quality and is quite durable. The office spaces' luxurious furnishings increase employee productivity.
Due to the huge demand for the ergonomic chair market across many locations, the government and SMEs are concentrating on expanding the commercial infrastructure. Additionally, the various production facilities are concentrating on product innovation, which affects the demand for the ergonomic chair market. However, it is anticipated that the limited range of motion and high price of ergonomic chairs will restrain the market's expansion.
To increase sales, manufacturing companies are collaborating with MNCs. It is a strategy through which workers make use of office chairs; as they find it useful, they choose to buy ergonomic chairs for their homes/offices. Following the introduction of the COVID-19 epidemic, remote work becomes common and is now a part of the daily routine of the workforce.
Consumers shifting from regional brands to international brands are influenced by the design and aesthetic appeal, along with the availability of a variety of colors and materials. High durability, standard testing, certifications such as the Business and Institutional Furniture Manufacturers Association (BIFMA) and Leadership in Energy and Environmental Design (LEED), and warranty play a role in consumers shifting toward international brands.
Ergonomic Chair Market Report Highlights:
- The residential segment is expected to dominate the market over the forecast period. The new era of employment has finally arrived in the commercial sectors. The market for home office furniture has expanded as a result of the shift from requiring full-time staff to permitting remote work. The surge in demand for home office furniture across various locations has been facilitated by this era of virtual working
- The steel segment is dominating the market due to the increase in innovative launches. Strong economic growth and the increasing expenditure power of consumers are also primarily driving the growth. The trend of custom-made as well as a mix of materials used in ergonomic chairs is also driving the segment's growth
- North America held the largest revenue share in 2022. The increasing population and improved standard of living have spurred the growth prospects of the construction sector in the region in the past few years. Also, the increasing consciousness regarding the impact of the choices made by consumers on individual health, sitting habits as well as the environment is steadily moving towards rising demand for ergonomic chairs in the region
Table of Contents
Chapter 1. Methodology and Scope
- 1.1. Market Segmentation & Scope
- 1.2. Market Definition
- 1.3. Information Procurement
- 1.3.1. Purchased Database
- 1.3.2. GVR's Internal Database
- 1.3.3. Secondary Sources & Third-Party Perspectives
- 1.3.4. Primary Research
- 1.4. Information Analysis
- 1.4.1. Data Analysis Models
- 1.5. Market Formulation & Data Visualization
- 1.6. Data Validation & Publishing
Chapter 2. Executive Summary
- 2.1. Market Outlook
- 2.2. Product Outlook
- 2.3. Material Outlook
- 2.4. End-user Outlook
- 2.5. Regional Outlook
Chapter 3. Bathroom vanities Market Variables, Trends & Scope
- 3.1. Market Introduction
- 3.2. Penetration & Growth Prospect Mapping
- 3.3. Industry Value Chain Analysis
- 3.3.1. Sales/Retail Channel Analysis
- 3.3.2. Profit Margin Analysis
- 3.4. Market Dynamics
- 3.4.1. Market Driver Analysis
- 3.4.2. Market Restraint Analysis
- 3.4.3. Industry Challenges
- 3.4.4. Industry Opportunities
- 3.5. Business Environment Analysis
- 3.5.1. Industry Analysis - Porter's
- 3.5.2. Supplier Power
- 3.5.3. Buyer Power
- 3.5.4. Substitution Threat
- 3.5.5. Threat from New Entrants
- 3.5.6. Competitive Rivalry
- 3.6. Roadmap of Ergonomic Chair Market
- 3.7. Market Entry Strategies
- 3.8. Impact of COVID-19 on Ergonomic Chair Market
Chapter 4. Consumer Behavior Analysis
- 4.1. Demographic Analysis
- 4.2. Consumer Trends and Preferences
- 4.3. Factors Affecting Buying Decision
- 4.4. Consumer Application Adoption
- 4.5. Observations & Recommendations
Chapter 5. Ergonomic Chair Market: Product Estimates & Trend Analysis
- 5.1. Product Movement Analysis & Market Share, 2021 & 2030
- 5.2. Swivel Chair
- 5.2.1. Market estimates and forecast, 2017 - 2030 (USD Million)
- 5.3. Adjustable Chair
- 5.3.1. Market estimates and forecast, 2017 - 2030 (USD Million)
- 5.4. Fixed Chair
- 5.4.1. Market estimates and forecast, 2017 - 2030 (USD Million)
Chapter 6. Ergonomic Chair Market: Placement Estimates & Trend Analysis
- 6.1. Material Movement Analysis & Market Share, 2021 & 2030
- 6.2. Plastic
- 6.2.1. Market estimates and forecast, 2017 - 2030 (USD Million)
- 6.3. Steel
- 6.3.1. Market estimates and forecast, 2017 - 2030 (USD Million)
- 6.4. Others (Vinyl, Mesh, Leather)
- 6.4.1. Market estimates and forecast, 2017 - 2030 (USD Million)
Chapter 7. Ergonomic Chair Market: End-user Estimates & Trend Analysis
- 7.1. End-user Movement Analysis & Market Share, 2021 & 2030
- 7.2. Residential
- 7.2.1. Market estimates and forecast, 2017 - 2030 (USD Million)
- 7.3. Commercial
- 7.3.1. Market estimates and forecast, 2017 - 2030 (USD Million)
Chapter 8. Ergonomic Chair Market: Regional Estimates & Trend Analysis
- 8.1. Regional Movement Analysis & Market Share, 2021 & 2030
- 8.2. North America
- 8.2.1. Market estimates and forecast, 2017 - 2030 (USD Million)
- 8.2.2. Market estimates and forecast, by product, 2017 - 2030 (USD Million)
- 8.2.3. Market estimates and forecast, by material, 2017 - 2030 (USD Million)
- 8.2.4. Market estimates and forecast, by end-user, 2017 - 2030 (USD Million)
- 8.2.5. U.S.
- 8.2.5.1. Market estimates and forecast, 2017 - 2030 (USD Million)
- 8.2.5.2. Market estimates and forecast, by product, 2017 - 2030 (USD Million)
- 8.2.5.3. Market estimates and forecast, by material, 2017 - 2030 (USD Million)
- 8.2.5.4. Market estimates and forecast, by end-user, 2017 - 2030 (USD Million)
- 8.2.6. Canada
- 8.2.6.1. Market estimates and forecast, 2017 - 2030 (USD Million)
- 8.2.6.2. Market estimates and forecast, by product, 2017 - 2030 (USD Million)
- 8.2.6.3. Market estimates and forecast, by material, 2017 - 2030 (USD Million)
- 8.2.6.4. Market estimates and forecast, by end-user, 2017 - 2030 (USD Million)
- 8.3. Europe
- 8.3.1. Market estimates and forecast, 2017 - 2030 (USD Million)
- 8.3.2. Market estimates and forecast, by product, 2017 - 2030 (USD Million)
- 8.3.3. Market estimates and forecast, by material, 2017 - 2030 (USD Million)
- 8.3.4. Market estimates and forecast, by end-user, 2017 - 2030 (USD Million)
- 8.3.5. U.K.
- 8.3.5.1. Market estimates and forecast, 2017 - 2030 (USD Million)
- 8.3.5.2. Market estimates and forecast, by product, 2017 - 2030 (USD Million)
- 8.3.5.3. Market estimates and forecast, by material, 2017 - 2030 (USD Million)
- 8.3.5.4. Market estimates and forecast, by end-user, 2017 - 2030 (USD Million)
- 8.3.6. Germany
- 8.3.6.1. Market estimates and forecast, 2017 - 2030 (USD Million)
- 8.3.6.2. Market estimates and forecast, by product, 2017 - 2030 (USD Million)
- 8.3.6.3. Market estimates and forecast, by material, 2017 - 2030 (USD Million)
- 8.3.6.4. Market estimates and forecast, by end-user, 2017 - 2030 (USD Million)
- 8.3.7. France
- 8.3.7.1. Market estimates and forecast, 2017 - 2030 (USD Million)
- 8.3.7.2. Market estimates and forecast, by product, 2017 - 2030 (USD Million)
- 8.3.7.3. Market estimates and forecast, by material, 2017 - 2030 (USD Million)
- 8.3.7.4. Market estimates and forecast, by end-user, 2017 - 2030 (USD Million)
- 8.4. Asia Pacific
- 8.4.1. Market estimates and forecast, 2017 - 2030 (USD Million)
- 8.4.2. Market estimates and forecast, by product, 2017 - 2030 (USD Million)
- 8.4.3. Market estimates and forecast, by material, 2017 - 2030 (USD Million)
- 8.4.4. Market estimates and forecast, by end-user, 2017 - 2030 (USD Million)
- 8.4.5. China
- 8.4.5.1. Market estimates and forecast, 2017 - 2030 (USD Million)
- 8.4.5.2. Market estimates and forecast, by product, 2017 - 2030 (USD Million)
- 8.4.5.3. Market estimates and forecast, by material, 2017 - 2030 (USD Million)
- 8.4.5.4. Market estimates and forecast, by end-user, 2017 - 2030 (USD Million)
- 8.4.6. India
- 8.4.6.1. Market estimates and forecast, 2017 - 2030 (USD Million)
- 8.4.6.2. Market estimates and forecast, by product, 2017 - 2030 (USD Million)
- 8.4.6.3. Market estimates and forecast, by material, 2017 - 2030 (USD Million)
- 8.4.6.4. Market estimates and forecast, by end-user, 2017 - 2030 (USD Million)
- 8.4.7. Japan
- 8.4.7.1. Market estimates and forecast, 2017 - 2030 (USD Million)
- 8.4.7.2. Market estimates and forecast, by product, 2017 - 2030 (USD Million)
- 8.4.7.3. Market estimates and forecast, by material, 2017 - 2030 (USD Million)
- 8.4.7.4. Market estimates and forecast, by end-user, 2017 - 2030 (USD Million)
- 8.5. South America
- 8.5.1. Market estimates and forecast, 2017 - 2030 (USD Million)
- 8.5.2. Market estimates and forecast, by product, 2017 - 2030 (USD Million)
- 8.5.3. Market estimates and forecast, by material, 2017 - 2030 (USD Million)
- 8.5.4. Market estimates and forecast, by end-user, 2017 - 2030 (USD Million)
- 8.5.5. Brazil
- 8.5.5.1. Market estimates and forecast, 2017 - 2030 (USD Million)
- 8.5.5.2. Market estimates and forecast, by product, 2017 - 2030 (USD Million)
- 8.5.5.3. Market estimates and forecast, by material, 2017 - 2030 (USD Million)
- 8.5.5.4. Market estimates and forecast, by end-user, 2017 - 2030 (USD Million)
- 8.6. Middles East & Africa
- 8.6.1. Market estimates and forecast, 2017 - 2030 (USD Million)
- 8.6.2. Market estimates and forecast, by product, 2017 - 2030 (USD Million)
- 8.6.3. Market estimates and forecast, by material, 2017 - 2030 (USD Million)
- 8.6.4. Market estimates and forecast, by end-user, 2017 - 2030 (USD Million)
- 8.6.5. South Africa
- 8.6.5.1. Market estimates and forecast, 2017 - 2030 (USD Million)
- 8.6.5.2. Market estimates and forecast, by product, 2017 - 2030 (USD Million)
- 8.6.5.3. Market estimates and forecast, by material, 2017 - 2030 (USD Million)
- 8.6.5.4. Market estimates and forecast, by end-user, 2017 - 2030 (USD Million)
Chapter 9. Competitive Analysis
- 9.1. Key global players, recent developments & their impact on the industry
- 9.2. Key Company/Competition Categorization (Key innovators, Market leaders, Emerging players)
- 9.3. Vendor Landscape
- 9.3.1. Key company market share analysis, 2021
Chapter 10. Company Profiles
- 10.1. Steelcase Gesture
- 10.1.1. Company Overview
- 10.1.2. Financial Performance
- 10.1.3. Application Benchmarking
- 10.1.4. Strategic Initiatives
- 10.2. Branch Ergonomic Chair
- 10.2.1. Company Overview
- 10.2.2. Financial Performance
- 10.2.3. Application Benchmarking
- 10.3. Herman Miller Sayl Chair
- 10.3.1. Company Overview
- 10.3.2. Financial Performance
- 10.3.3. Application Benchmarking
- 10.3.4. Strategic Initiatives
- 10.4. HNI India
- 10.4.1. Company Overview
- 10.4.2. Financial Performance
- 10.4.3. Application Benchmarking
- 10.4.4. Strategic Initiatives
- 10.5. Jiangmen Shengshi Furniture Co., Ltd.
- 10.5.1. Company Overview
- 10.5.2. Financial Performance
- 10.5.3. Application Benchmarking
- 10.5.4. Strategic Initiatives
- 10.6. Huzhou Shenglong Furniture Co., Ltd.
- 10.6.1. Company Overview
- 10.6.2. Financial Performance
- 10.6.3. Application Benchmarking
- 10.6.4. Strategic Initiatives
- 10.7. Herman Miller
- 10.7.1. Company Overview
- 10.7.2. Financial Performance
- 10.7.3. Application Benchmarking
- 10.7.4. Strategic Initiatives
- 10.8. Kimball Office
- 10.8.1. Company Overview
- 10.8.2. Financial Performance
- 10.8.3. Application Benchmarking
- 10.8.4. Strategic Initiatives
- 10.9. Okamura Corporation
- 10.9.1. Company Overview
- 10.9.2. Financial Performance
- 10.9.3. Application Benchmarking
- 10.9.4. Strategic Initiatives
- 10.10. Bristol
- 10.10.1. Company Overview
- 10.10.2. Financial Performance
- 10.10.3. Product Benchmarking
- 10.10.4. Strategic Initiatives