|
|
市場調査レポート
商品コード
1178577
合成潤滑油の市場規模、シェア、動向分析レポート:製品別(エステル、PAO、PAG)、用途別(エンジンオイル、HTF、トランスミッション液、金属加工油)、地域別、セグメント別予測、2023年~2030年Synthetic Lubricants Market Size, Share & Trends Analysis Report By Product (Esters, PAO, PAG), By Application (Engine Oil, HTFs, Transmission Fluids, Metalworking Fluids), By Region, And Segment Forecasts, 2023 - 2030 |
||||||
|
|
|||||||
|
● お客様のご希望に応じて、既存データの加工や未掲載情報(例:国別セグメント)の追加などの対応が可能です。 詳細はお問い合わせください。 |
|||||||


| 合成潤滑油の市場規模、シェア、動向分析レポート:製品別(エステル、PAO、PAG)、用途別(エンジンオイル、HTF、トランスミッション液、金属加工油)、地域別、セグメント別予測、2023年~2030年 |
|
出版日: 2022年12月07日
発行: Grand View Research
ページ情報: 英文 80 Pages
納期: 2~10営業日
|
- 全表示
- 概要
- 図表
- 目次
合成潤滑油の市場成長と動向
Grand View Research, Inc.の最新レポートによると、世界の合成潤滑油市場規模は2030年までに234億米ドルに達し、2023年から2030年までCAGR3.7%で拡大すると予測されています。この市場は、世界中で成長している自動車産業が主な原動力となっています。合成潤滑油の高粘度指数は、鉱物系潤滑油と比較して摩擦を低減し、ピストン、シャフト、コンロッドなどの自動車エンジン部品で起こる摩耗や損傷を防止します。さらに、PAOベースの合成潤滑油は、広い温度範囲で性能を発揮する能力を持っています。
GCCにおける天然ガス生産の増加も、市場における合成潤滑油の需要を押し上げています。これは、製油所では、石油や油性製品の蒸留のためのリボイラーやカラムの加熱に液相のHTFを使用するという事実によるものです。さらに、使用済み潤滑油の再処理とリサイクルを行う企業は、高真空蒸留操作とともに高温でHTFを利用しています。精製と流通の中間に位置するブースターステーションでは、長距離を移動する石油製品の粘度を維持するためにHTFが使用されています。これらすべての要因が需要を促進しています。
鉱物油に比べ合成潤滑油のコストが高いことは、予測期間中、市場にマイナスの影響を及ぼすと考えられます。製造業におけるメンテナンスコストの削減に対する懸念の高まりは、集中潤滑や大量のオイルを必要とする合成潤滑油の範囲を縮小させると予想されます。したがって、高コストが引き続き市場成長の主要な抑制要因になると予想されます。
また、バイオ潤滑油の出現も市場成長の抑制要因として作用しています。バイオ潤滑油は、生分解性、メンテナンス、保管、廃棄の少なさ、排出物の削減、より優れた安全性、合成潤滑油と比較して高い引火点と粘度指数による一定の粘度などの優れた特性により、大きな需要があるとされています。北米と欧州における良好な規制シナリオと高い消費者意識が、バイオベース潤滑剤をさらに後押ししており、市場の成長を抑制しています。
合成潤滑油市場のレポートハイライト
合成潤滑油の市場成長は、鉱物系潤滑油よりも優れた性能により、乗用車および商用車のギアボックス潤滑油、エンジンオイル、トランスミッションオイルの形で自動車セクターでの用途が増加していることに起因しています。
2022年の世界市場は、アジア太平洋地域が40.0%以上の売上高シェアを獲得しています。これは、同地域で自動車産業と精製事業が成長していることに起因しています。インド、中国、シンガポールなどの国々は、低い原油価格に乗じています。このため、アジア太平洋地域では石油化学製品の生産が増加し、製品需要が伸びています。
ポリアルファオレフィン(PAO)は、2022年の収益シェアが50.0%を超え、市場を独占しています。この成長は、フォルクスワーゲンやBMWなどのブランド車におけるOEM推奨と相まって、自動車エンジンにおけるPAOの使用が増加したことに起因しています。
PAOベースの合成潤滑油には、耐摩耗性やワニス制御といった機能的な利点があるため、さまざまな産業用途で使用されるようになりました。さらに、PAOの高い粘度指数により、極端な温度環境下にある機械での使用が加速しています。
エンジンオイル用途は、2022年の売上高シェアが35.0%を超え、世界市場を独占しています。これは、特に中国やインドなどの新興国において、自動車販売台数が伸びていることに起因しています。このため、エンジンの需要が増加し、エンジンオイル用途の合成潤滑油の需要が高まることが予想されます。
2020年1月、ドイツの潤滑油メーカーであるFUCHSグループは、米国の特殊合成潤滑油メーカーであるNye Lubricants Inc.の買収を完了したと発表しました。この買収により、FUCHSグループは特殊潤滑油の製品ポートフォリオを拡大し、その地位を強化することができました
目次
第1章 調査手法と範囲
- 市場セグメンテーションと範囲
- 市場の定義
- 情報調達
- 情報分析
- 市場形成とデータ可視化
- データの検証と公開
- 調査範囲と前提
- データソースへのリスト
第2章 エグゼクティブサマリー
- 市場の見通し
- 部分スナップショット
- 競合情勢のスナップショット
第3章 市場変数、動向、範囲
- 市場系列の見通し
- 世界の合成潤滑油市場の見通し
- 業界バリューチェーン分析
- 原材料トレンド分析
- 製造動向分析
- 販売チャネル分析
- 規制の枠組み
- 価格に影響を与える要因
- COVID-19パンデミックの影響
- 欧州の地政学的紛争の影響
- 市場力学
- 市場促進要因分析
- 市場抑制要因分析
- 市場機会分析
- 業界の課題分析
第4章 合成潤滑油市場:サプライヤーポートフォリオ分析
- 原材料サプライヤー一覧
- ポートフォリオ分析/Kraljicマトリックス
- エンゲージメントモデル
- 交渉戦略
- 調達のベストプラクティス
第5章 合成潤滑油市場:製品の推定・動向分析
- 製品動向変動分析と市場シェア、2022年と2030年(キロトン)(10億米ドル)
- 合成潤滑油の市場規模と予測、トレンド分析、製品別、2018年-2030年(キロトン)(10億米ドル)
第6章 合成潤滑油市場:アプリケーションの推定・動向分析
- アプリケーションの変動分析と市場シェア、2022年と2030年(キロトン)(10億米ドル)
- 合成潤滑油の市場規模と予測、および傾向分析、用途別、2018~2030年(キロトン)(10億米ドル)
第7章 合成潤滑油市場:地域推定・動向分析
- 合成潤滑油の地域動向変動分析と市場シェア、2022年と2030年(キロトン)(10億米ドル)
- 合成潤滑油の市場規模、予測、トレンド分析、地域別、2018年~2030年(キロトン)(10億米ドル)
- 北米
- 米国
- カナダ
- メキシコ
- 欧州
- 英国
- フランス
- オランダ
- ノルウェー
- トルコ
- ドイツ
- アジア太平洋地域
- インド
- 中国
- 日本
- ラテンアメリカ
- ブラジル
- アルゼンチン
- 中東とアフリカ
- アラブ首長国連邦
- 北米
第8章 合成潤滑油市場-競合分析
- 主要な市場参入企業別最近の開発と影響分析
- 企業/競合の分類(主要なイノベーター、マーケットリーダー、新興企業)
- ベンダー情勢
- ディストリビューターおよびチャネルパートナーのリスト
- 潜在的なエンドユーザーのリスト
- 主要企業の市場ポジショニング分析、2022年
- 主要取引と戦略的提携分析
第9章 企業プロファイル
- BP Lubricants Pvt. Ltd.
- 会社概要
- 財務実績
- 製品のベンチマーク
- 戦略的イニシアチブ
- Chevron Corporation
- 会社概要
- 財務実績
- 製品のベンチマーク
- 戦略的イニシアチブ
- LANXESS
- 会社概要
- 財務実績
- 製品のベンチマーク
- 戦略的イニシアチブ
- Valvoline
- 会社概要
- 財務実績
- 製品のベンチマーク
- 戦略的イニシアチブ
- FUCHS
- 会社概要
- 財務実績
- 製品のベンチマーク
- 戦略的イニシアチブ
- Pennzoil
- 会社概要
- 財務実績
- 製品のベンチマーク
- 戦略的イニシアチブ
- Phillips 66 Company
- 会社概要
- 財務実績
- 製品のベンチマーク
- 戦略的イニシアチブ
- Motul
- 会社概要
- 財務実績
- 製品のベンチマーク
- 戦略的イニシアチブ
- AMSOIL INC.
- 会社概要
- 財務実績
- 製品のベンチマーク
- 戦略的イニシアチブ
- Agip
- 会社概要
- 財務実績
- 製品のベンチマーク
- 戦略的イニシアチブ
List of Tables
- Table 1 Synthetic Lubricants Market Volume Estimates & Forecasts, Product, 2018 - 2030 (Kilotons)
- Table 2 Synthetic Lubricants Market Revenue Estimates & Forecasts, Product, 2018 - 2030 (USD Billion)
- Table 3 Synthetic Lubricants Market Volume Estimates & Forecasts, By Application, 2018 - 2030 (Kilotons)
- Table 4 Synthetic Lubricants Market Revenue Estimates & Forecasts, By Application, 2018 - 2030 (USD Billion)
- Table 5 Global Synthetic Lubricants Market Volume Estimates & Forecasts, By Region, 2018 - 2030 (Kilotons)
- Table 6 Global Synthetic Lubricants Market Revenue Estimates & Forecasts, By Region, 2018 - 2030 (USD Billion)
- Table 7 North America Synthetic Lubricants Market Volume Estimates & Forecasts, Product, 2018 - 2030 (Kilotons)
- Table 8 North America Synthetic Lubricants Market Revenue Estimates & Forecasts, Product, 2018 - 2030 (USD Billion)
- Table 9 North America Synthetic Lubricants Market Volume Estimates & Forecasts, By Application, 2018 - 2030 (Kilotons)
- Table 10 North America Synthetic Lubricants Market Revenue Estimates & Forecasts, By Application, 2018 - 2030 (USD Billion)
- Table 11 U.S. Synthetic Lubricants Market Volume Estimates & Forecasts, Product, 2018 - 2030 (Kilotons)
- Table 12 U.S. Synthetic Lubricants Market Revenue Estimates & Forecasts, Product, 2018 - 2030 (USD Billion)
- Table 13 U.S. Synthetic Lubricants Market Volume Estimates & Forecasts, By Application, 2018 - 2030 (Kilotons)
- Table 14 U.S. Synthetic Lubricants Market Revenue Estimates & Forecasts, By Application, 2018 - 2030 (USD Billion)
- Table 15 Canada Synthetic Lubricants Market Volume Estimates & Forecasts, Product, 2018 - 2030 (Kilotons)
- Table 16 Canada Synthetic Lubricants Market Revenue Estimates & Forecasts, Product, 2018 - 2030 (USD Billion)
- Table 17 Canada Synthetic Lubricants Market Volume Estimates & Forecasts, By Application, 2018 - 2030 (Kilotons)
- Table 18 Canada Synthetic Lubricants Market Revenue Estimates & Forecasts, By Application, 2018 - 2030 (USD Billion)
- Table 19 Mexico Synthetic Lubricants Volume Estimates & Forecasts, Product, 2018 - 2030 (Kilotons)
- Table 20 Mexico Synthetic Lubricants Market Revenue Estimates & Forecasts, Product, 2018 - 2030 (USD Billion)
- Table 21 Mexico Synthetic Lubricants Market Volume Estimates & Forecasts, By Application, 2018 - 2030 (Kilotons)
- Table 22 Mexico Synthetic Lubricants Market Revenue Estimates & Forecasts, By Application, 2018 - 2030 (USD Billion)
- Table 23 Europe Synthetic Lubricants Market Volume Estimates & Forecasts, Product, 2018 - 2030 (Kilotons)
- Table 24 Europe Synthetic Lubricants Market Revenue Estimates & Forecasts, Product, 2018 - 2030 (USD Billion)
- Table 25 Europe Synthetic Lubricants Market Volume Estimates & Forecasts, By Application, 2018 - 2030 (Kilotons)
- Table 26 Europe Synthetic Lubricants Market Revenue Estimates & Forecasts, By Application, 2018 - 2030 (USD Billion)
- Table 27 U.K. Synthetic Lubricants Market Volume Estimates & Forecasts, Product, 2018 - 2030 (Kilotons)
- Table 28 U.K. Synthetic Lubricants Market Revenue Estimates & Forecasts, Product, 2018 - 2030 (USD Billion)
- Table 29 U.K. Synthetic Lubricants Market Volume Estimates & Forecasts, By Application, 2018 - 2030 (Kilotons)
- Table 30 U.K. Synthetic Lubricants Market Revenue Estimates & Forecasts, By Application, 2018 - 2030 (USD Billion)
- Table 31 Germany Synthetic Lubricants Market Volume Estimates & Forecasts, Product, 2018 - 2030 (Kilotons)
- Table 32 Germany Synthetic Lubricants Market Revenue Estimates & Forecasts, Product, 2018 - 2030 (USD Billion)
- Table 33 Germany Synthetic Lubricants Market Volume Estimates & Forecasts, By Application, 2018 - 2030 (Kilotons)
- Table 34 Germany Synthetic Lubricants Market Revenue Estimates & Forecasts, By Application, 2018 - 2030 (USD Billion)
- Table 35 France Synthetic Lubricants Market Volume Estimates & Forecasts, Product, 2018 - 2030 (Kilotons)
- Table 36 France Synthetic Lubricants Market Revenue Estimates & Forecasts, Product, 2018 - 2030 (USD Billion)
- Table 37 France Synthetic Lubricants Market Volume Estimates & Forecasts, By Application, 2018 - 2030 (Kilotons)
- Table 38 France Synthetic Lubricants Market Revenue Estimates & Forecasts, By Application, 2018 - 2030 (USD Billion)
- Table 39 Norway Synthetic Lubricants Market Volume Estimates & Forecasts, Product, 2018 - 2030 (Kilotons)
- Table 40 Norway Synthetic Lubricants Market Revenue Estimates & Forecasts, Product, 2018 - 2030 (USD Billion)
- Table 41 Norway Synthetic Lubricants Market Volume Estimates & Forecasts, By Application, 2018 - 2030 (Kilotons)
- Table 42 Norway Synthetic Lubricants Market Revenue Estimates & Forecasts, By Application, 2018 - 2030 (USD Billion)
- Table 43 Turkey Synthetic Lubricants Market Volume Estimates & Forecasts, Product, 2018 - 2030 (Kilotons)
- Table 44 Turkey Synthetic Lubricants Market Revenue Estimates & Forecasts, Product, 2018 - 2030 (USD Billion)
- Table 45 Turkey Synthetic Lubricants Market Volume Estimates & Forecasts, By Application, 2018 - 2030 (Kilotons)
- Table 46 Turkey Synthetic Lubricants Market Revenue Estimates & Forecasts, By Application, 2018 - 2030 (USD Billion)
- Table 47 Netherlands Synthetic Lubricants Market Volume Estimates & Forecasts, Product, 2018 - 2030 (Kilotons)
- Table 48 Netherlands Synthetic Lubricants Market Revenue Estimates & Forecasts, Product, 2018 - 2030 (USD Billion)
- Table 49 Netherlands Synthetic Lubricants Market Volume Estimates & Forecasts, By Application, 2018 - 2030 (Kilotons)
- Table 50 Netherlands Synthetic Lubricants Market Revenue Estimates & Forecasts, By Application, 2018 - 2030 (USD Billion)
- Table 51 Asia Pacific Synthetic Lubricants Market Volume Estimates & Forecasts, Product, 2018 - 2030 (Kilotons)
- Table 52 Asia Pacific Synthetic Lubricants Market Revenue Estimates & Forecasts, Product, 2018 - 2030 (USD Billion)
- Table 53 Asia Pacific Synthetic Lubricants Market Volume Estimates & Forecasts, By Application, 2018 - 2030 (Kilotons)
- Table 54 Asia Pacific Synthetic Lubricants Market Revenue Estimates & Forecasts, By Application N, 2018 - 2030 (USD Billion)
- Table 55 China Synthetic Lubricants Market Volume Estimates & Forecasts, Product, 2018 - 2030 (Kilotons)
- Table 56 China Synthetic Lubricants Market Revenue Estimates & Forecasts, Product, 2018 - 2030 (USD Billion)
- Table 57 China Synthetic Lubricants Market Volume Estimates & Forecasts, By Application, 2018 - 2030 (Kilotons)
- Table 58 China Synthetic Lubricants Market Revenue Estimates & Forecasts, By Application, 2018 - 2030 (USD Billion)
- Table 59 India Synthetic Lubricants Market Volume Estimates & Forecasts, Product, 2018 - 2030 (Kilotons)
- Table 60 India Synthetic Lubricants Market Revenue Estimates & Forecasts, Product, 2018 - 2030 (USD Billion)
- Table 61 India Synthetic Lubricants Market Volume Estimates & Forecasts, By Application, 2018 - 2030 (Kilotons)
- Table 62 India Synthetic Lubricants Market Revenue Estimates & Forecasts, By Application, 2018 - 2030 (USD Billion)
- Table 63 Japan Synthetic Lubricants Market Volume Estimates & Forecasts, Product, 2018 - 2030 (Kilotons)
- Table 64 Japan Synthetic Lubricants Market Revenue Estimates & Forecasts, Product, 2018 - 2030 (USD Billion)
- Table 65 Japan Synthetic Lubricants Market Volume Estimates & Forecasts, By Application, 2018 - 2030 (Kilotons)
- Table 66 Japan Synthetic Lubricants Market Revenue Estimates & Forecasts, By Application, 2018 - 2030 (USD Billion)
- Table 67 Latin America Synthetic Lubricants Market Volume Estimates & Forecasts, Product, 2018 - 2030 (Kilotons)
- Table 68 Latin America Synthetic Lubricants Market Revenue Estimates & Forecasts, Product, 2018 - 2030 (USD Billion)
- Table 69 Latin America Synthetic Lubricants Market Volume Estimates & Forecasts, By Application, 2018 - 2030 (Kilotons)
- Table 70 Latin America Synthetic Lubricants Market Revenue Estimates & Forecasts, By Application, 2018 - 2030 (USD Billion)
- Table 71 Brazil Synthetic Lubricants Market Volume Estimates & Forecasts, Product, 2018 - 2030 (Kilotons)
- Table 72 Brazil Synthetic Lubricants Market Revenue Estimates & Forecasts, Product, 2018 - 2030 (USD Billion)
- Table 73 Brazil Synthetic Lubricants Market Volume Estimates & Forecasts, By Application, 2018 - 2030 (Kilotons)
- Table 74 Brazil Synthetic Lubricants Market Revenue Estimates & Forecasts, By Application, 2018 - 2030 (USD Billion)
- Table 75 Argentina Synthetic Lubricants Market Volume Estimates & Forecasts, Product, 2018 - 2030 (Kilotons)
- Table 76 Argentina Synthetic Lubricants Market Revenue Estimates & Forecasts, Product, 2018 - 2030 (USD Billion)
- Table 77 Argentina Synthetic Lubricants Market Volume Estimates & Forecasts, By Application, 2018 - 2030 (Kilotons)
- Table 78 Argentina Synthetic Lubricants Market Revenue Estimates & Forecasts, By Application, 2018 - 2030 (USD Billion)
- Table 79 Middle East & Africa Synthetic Lubricants Market Volume Estimates & Forecasts, Product, 2018 - 2030 (Kilotons)
- Table 80 Middle East & Africa Synthetic Lubricants Market Revenue Estimates & Forecasts, Product, 2018 - 2030 (USD Billion)
- Table 81 Middle East & Africa Synthetic Lubricants Market Volume Estimates & Forecasts, By Application, 2018 - 2030 (Kilotons)
- Table 82 Middle East & Africa Synthetic Lubricants Market Revenue Estimates & Forecasts, By Application, 2018 - 2030 (USD Billion)
- Table 83 UAE Synthetic Lubricants Market Volume Estimates & Forecasts, Product, 2018 - 2030 (Kilotons)
- Table 84 UAE Synthetic Lubricants Market Revenue Estimates & Forecasts, Product, 2018 - 2030 (USD Billion)
- Table 85 UAE Synthetic Lubricants Market Volume Estimates & Forecasts, By Application, 2018 - 2030 (Kilotons)
- Table 86 UAE Synthetic Lubricants Market Revenue Estimates & Forecasts, By Application, 2018 - 2030 (USD Billion)
- Table 87 Vendor Landscape
List of Figures
- Fig. 1 Synthetic Lubricants Market Segmentation & Scope
- Fig. 2 Information Procurement
- Fig. 3 Primary Research Pattern
- Fig. 4 Primary Research Process
- Fig. 5 Primary Research Approaches
- Fig. 6 Synthetic Lubricants Market Snapshot
- Fig. 7 Synthetic Lubricants Market Revenue 2022 (USD Billion)
- Fig. 8 Synthetic Lubricants Market, 2018 - 2030 (Kilotons) (USD Billion)
- Fig. 9 Synthetic Lubricants Market: Value Chain Analysis
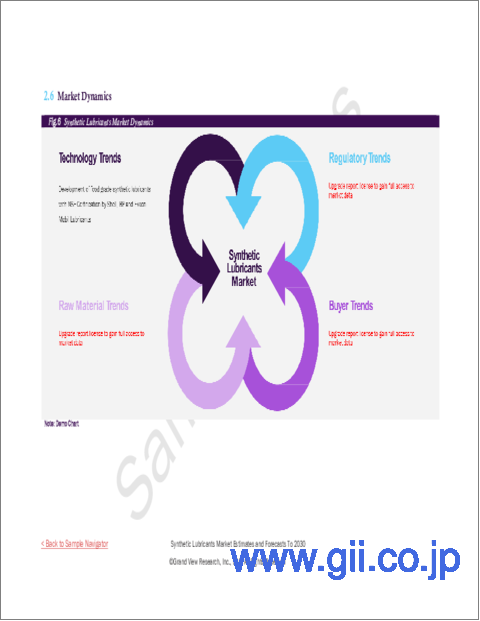
- Fig. 10 Market Dynamics
- Fig. 11 Porter's Analysis
- Fig. 12 Pestel Analysis
- Fig. 13 Synthetic Lubricants Market Volume Share, By Product, 2022 & 2030 (Kilotons)
- Fig. 14 Synthetic Lubricants Market Volume Share, By Application, 2022 & 2030 (Kilotons)
- Fig. 15 Synthetic Lubricants Volume Market, By Region, 2022 & 2030 (Kilotons)
- Fig. 16 Strategy Framework
Synthetic Lubricants Market Growth & Trends:
The global synthetic lubricants market size is expected to reach USD 23.4 billion by 2030, as per the new report by Grand View Research, Inc., expanding at a CAGR of 3.7% from 2023 to 2030. The market is majorly driven by the growing automotive industry around the globe. High viscosity index of synthetic lubricants as compared to their mineral counterparts reduces friction and prevents wear and tear, which takes place in automotive engine components such as pistons, shafts, and connecting rods. In addition, PAO-based synthetic lubricants have the ability to perform across a wide temperature range.
The growing natural gas production in GCC is also driving the demand for synthetic lubricants in the market. This is due to the fact that refineries use liquid phase HTFs for heating reboilers and columns for distillation of oil and oil-based products. Additionally, the companies which reprocess and recycle used lubricating oils utilize HTFs at high temperatures along with high vacuum distillation operations. Booster stations located in between refining and distribution channels use HTFs for maintaining viscosity of petroleum products that travel long distances. All these factors are propelling the demand.
The high cost of synthetic lubricants compared to their mineral counterparts is expected to have a negative impact on the market over the forecasted period. Rising concerns over reducing maintenance costs in the manufacturing sector are expected to trim down the scope of synthetic lubricants, where central lubrication or a huge quantity of oil is required. Therefore, high cost is expected to remain a key restraining factor for the growth of the market.
The emergence of bio-lubricants is also acting as a restraining factor in the growth of the market. Bio-lubricants have huge demand due to their superior properties, including biodegradability, low maintenance, storage and disposal, reduced emissions, better safety, and constant viscosity with higher flash points and viscosity index as compared to synthetic lubricants. The favorable regulatory scenario and higher consumer awareness in North America and Europe are further boosting the bio-based lubricants, and thus restraining the growth of the market.
Synthetic Lubricants Market Report Highlights:
- The market growth can be attributed to increasing application of synthetic lubricants in the automotive sector in the form of gearbox lubes, engine oils, and transmission oils in passenger and commercial vehicles due to their superior performance over their mineral counterparts
- Asia Pacific dominated the global market in 2022 with a revenue share of over 40.0%. This is owing to growing automobile industry and refinery business in the region. Countries such as India, China, and Singapore have capitalized on low crude oil prices. This has resulted in the increased production of petrochemicals in Asia Pacific, thus improving the product demand in the region
- Polyalphaolefins (PAOs) dominated the market with a revenue share of over 50.0% in 2022. This growth is attributed to the increased use of PAO in automotive engines coupled with OEM recommendations in brand cars such as Volkswagen and BMW
- Several functional benefits associated with PAO-based synthetic lubricants such as anti-wear and varnish control properties have fueled their usage in various industrial applications. Furthermore, high viscosity index of PAO has accelerated its usage in machinery with extreme temperature environments
- The engine oil application segment dominated the global market with a revenue share of over 35.0% in 2022. This is attributed to the growing automotive vehicle sales, especially in the emerging economies of China and India. This is expected to augment demand for engines, in turn, driving the demand for synthetic lubricants in engine oil application
- In January 2020, FUCHS Group, a German lubricants company, announced the completion of the acquisition of Nye Lubricants Inc., a U.S.-based specialty synthetic lubricant manufacturer. This acquisition helped FUCHS Group to expand and strengthen its position in the specialty lubricants product portfolio
Table of Contents
Chapter 1 Methodology and Scope
- 1.1 Market Segmentation & Scope
- 1.2 Market Definitions
- 1.3 Information Procurement
- 1.3.1 Information Analysis
- 1.3.2 Market Formulation & Data Visualization
- 1.3.3 Data Validation & Publishing
- 1.4 Research Scope And Assumptions
- 1.4.1 List To Data Sources
Chapter 2 Executive Summary
- 2.1 Market Outlook
- 2.2 Segmental Snapshot
- 2.3 Competitive Landscape Snapshot
Chapter 3 Market Variables, Trends & Scope
- 3.1 Market Lineage Outlook
- 3.1.1 Global Synthetic Lubricants Market Outlook
- 3.2 Penetration & Growth Prospect Mapping, 2018 - 2030
- 3.3 Industry Value Chain Analysis
- 3.3.1 Raw Material Trend Analysis
- 3.3.2 Manufacturing Trend Analysis
- 3.3.3 Sales Channel Analysis
- 3.4 Regulatory Framework
- 3.5 Price Trend Analysis, 2018 - 2030
- 3.5.1 Factors Influencing Prices
- 3.6 Impact of COVID - 19 Pandemic
- 3.7 Impact of European Geopolitical Conflict
- 3.8 Market Dynamics
- 3.8.1 Market Driver Analysis
- 3.8.2 Market Restraint Analysis
- 3.8.3 Market Opportunity Analysis
- 3.8.4 Industry Challenges Analysis
Chapter 4 Synthetic Lubricants Market: Suppliers Portfolio Analysis
- 4.1 List of Raw Material Suppliers
- 4.2 Portfolio Analysis/Kraljic Matrix
- 4.3 Engagement Model
- 4.4 Negotiation Strategies
- 4.5 Sourcing Best Practices
Chapter 5 Synthetic Lubricants Market: Product Estimates & Trend Analysis
- 5.1 Product Movement Analysis & Market Share, 2022 & 2030 (Kilotons) (USD Billion)
- 5.2 Synthetic Lubricants Market Size & Forecasts and Trend Analysis, By Product, 2018 - 2030 (Kilotons) (USD Billion)
- 5.2.1 Global Synthetic Lubricants Market Estimates & Forecasts By PAO, 2018 - 2030 (Kilotons) (USD Billion)
- 5.2.3 Global Synthetic Lubricants Market Estimates & Forecasts By Esters, 2018 - 2030 (Kilotons) (USD Billion)
- 5.2.4 Global Synthetic Lubricants Market Estimates & Forecasts By PAG, 2018 - 2030 (Kilotons) (USD Billion)
Chapter 6 Synthetic Lubricants Market: Application Estimates & Trend Analysis
- 6.1 Application Movement Analysis & Market Share, 2022 & 2030 (Kilotons) (USD Billion)
- 6.2 Synthetic Lubricants Market Size & Forecasts and Trend Analysis, By Application, 2018 - 2030 (Kilotons) (USD Billion)
- 6.2.1 Global Synthetic Lubricants Market Estimates & Forecasts By Engine Oil, 2018 - 2030 (Kilotons) (USD Billion)
- 6.2.2 Global Synthetic Lubricants Market Estimates & Forecasts ByHeat Transfer Fluids (HTF), 2018 - 2030 (Kilotons) (USD Billion)
- 6.2.3 Global Synthetic Lubricants Market Estimates & Forecasts ByTransmission Fluids, 2018 - 2030 (Kilotons) (USD Billion)
- 6.2.4 Global Synthetic Lubricants Market Estimates & Forecasts ByMetalworking Fluids, 2018 - 2030 (Kilotons) (USD Billion)
- 6.2.5 Global Synthetic Lubricants Market Estimates & Forecasts ByOthers, 2018 - 2030 (Kilotons) (USD Billion)
Chapter 7 Synthetic Lubricants Market: Regional Estimates & Trend Analysis
- 7.1 Synthetic Lubricants Regional Movement Analysis & Market Share, 2022 & 2030 (Kilotons) (USD Billion)
- 7.2 Synthetic Lubricants Market Size & Forecasts and Trend Analysis, By Region, 2018 - 2030 (Kilotons) (USD Billion)
- 7.2.1 North America
- 7.2.1.1 North America Synthetic Lubricants Estimates & Forecasts, 2018 - 2030 (Kilotons) (USD Billion)
- 7.2.1.2 North America Synthetic Lubricants Estimates & Forecasts, By Product, 2018 - 2030 (Kilotons) (USD Billion)
- 7.2.1.3 North America Synthetic Lubricants Estimates & Forecasts, By Application, 2018 - 2030 (Kilotons) (USD Billion)
- 7.2.1.4 U.S.
- 7.2.1.4.2 U.S. Synthetic Lubricants Estimates & Forecasts, By Product, 2018 - 2030 (Kilotons) (USD Billion)
- 7.2.1.4.2 U.S. Synthetic Lubricants Estimates & Forecasts, By Application, 2018 - 2030 (Kilotons) (USD Billion)
- 7.2.1.5 Canada
- 7.2.1.5.1 Canada Synthetic Lubricants Estimates & Forecasts, By Product, 2018 - 2030 (Kilotons) (USD Billion)
- 7.2.1.5.2 Canada Synthetic Lubricants Estimates & Forecasts, By Application, 2018 - 2030 (Kilotons) (USD Billion)
- 7.2.1.6 Mexico
- 7.2.1.6.1 Mexico Synthetic Lubricants Estimates & Forecasts, By Product, 2018 - 2030 (Kilotons) (USD Billion)
- 7.2.1.6.2 Mexico Synthetic Lubricants Estimates & Forecasts, By Application, 2018 - 2030 (Kilotons) (USD Billion)
- 7.2.2 Europe
- 7.2.2.1 Europe Synthetic Lubricants Estimates & Forecasts, 2018 - 2030 (Kilotons) (USD Billion)
- 7.2.2.2 Europe Synthetic Lubricants Estimates & Forecasts, By Product, 2018 - 2030 (Kilotons) (USD Billion)
- 7.2.2.3 Europe Synthetic Lubricants Estimates & Forecasts, By Application, 2018 - 2030 (Kilotons) (USD Billion)
- 7.2.2.4 U.K.
- 7.2.2.4.1 U.K. Synthetic Lubricants Estimates & Forecasts, By Product, 2018 - 2030 (Kilotons) (USD Billion)
- 7.2.2.4.2 U.K. Synthetic Lubricants Estimates & Forecasts, By Application, 2018 - 2030 (Kilotons) (USD Billion)
- 7.2.2.5 France
- 7.2.2.5.1 France Synthetic Lubricants Estimates & Forecasts, By Product, 2018 - 2030 (Kilotons) (USD Billion)
- 7.2.2.5.2 France Synthetic Lubricants Estimates & Forecasts, By Application, 2018 - 2030 (Kilotons) (USD Billion)
- 7.2.2.6 Netherlands
- 7.2.2.6.1 Netherlands Synthetic Lubricants Estimates & Forecasts, By Product, 2018 - 2030 (Kilotons) (USD Billion)
- 7.2.2.6.2 Netherlands Synthetic Lubricants Estimates & Forecasts, By Application, 2018 - 2030 (Kilotons) (USD Billion)
- 7.2.2.7 Norway
- 7.2.2.7.1 Norway Synthetic Lubricants Estimates & Forecasts, By Product, 2018 - 2030 (Kilotons) (USD Billion)
- 7.2.2.7.2 Norway Synthetic Lubricants Estimates & Forecasts, By Application, 2018 - 2030 (Kilotons) (USD Billion)
- 7.2.2.8 Turkey
- 7.2.2.8.1 Turkey Synthetic Lubricants Estimates & Forecasts, By Product, 2018 - 2030 (Kilotons) (USD Billion)
- 7.2.2.8.2 Turkey Synthetic Lubricants Estimates & Forecasts, By Application, 2018 - 2030 (Kilotons) (USD Billion)
- 7.2.2.9 Germany
- 7.2.2.9.1 Germany Synthetic Lubricants Estimates & Forecasts, By Product, 2018 - 2030 (Kilotons) (USD Billion)
- 7.2.2.9.2 Germany Synthetic Lubricants Estimates & Forecasts, By Application, 2018 - 2030 (Kilotons) (USD Billion)
- 7.2.3 Asia Pacific
- 7.2.3.1 Asia Pacific Synthetic Lubricants Estimates & Forecasts, 2018 - 2030 (Kilotons) (USD Billion)
- 7.2.3.2 Asia Pacific Synthetic Lubricants Estimates & Forecasts, By Product, 2018 - 2030 (Kilotons) (USD Billion)
- 7.2.3.3 Asia Pacific Synthetic Lubricants Estimates & Forecasts, By Application, 2018 - 2030 (Kilotons) (USD Billion)
- 7.2.3.4 India
- 7.2.3.4.1 India Synthetic Lubricants Estimates & Forecasts, By Product, 2018 - 2030 (Kilotons) (USD Billion)
- 7.2.3.4.2 India Synthetic Lubricants Estimates & Forecasts, By Application, 2018 - 2030 (Kilotons) (USD Billion)
- 7.2.3.5 China
- 7.2.3.5.1 China Synthetic Lubricants Estimates & Forecasts, By Product, 2018 - 2030 (Kilotons) (USD Billion)
- 7.2.3.5.2 China Synthetic Lubricants Estimates & Forecasts, By Application, 2018 - 2030 (Kilotons) (USD Billion)
- 7.2.3.6 Japan
- 7.2.3.6.1 Japan Synthetic Lubricants Estimates & Forecasts, By Product, 2018 - 2030 (Kilotons) (USD Billion)
- 7.2.3.6.2 Japan Synthetic Lubricants Estimates & Forecasts, By Application, 2018 - 2030 (Kilotons) (USD Billion)
- 7.2.4 Latin America
- 7.2.4.1 Latin America Synthetic Lubricants Estimates & Forecasts, 2018 - 2030 (Kilotons) (USD Billion)
- 7.2.4.2 Latin America Synthetic Lubricants Estimates & Forecasts, By Product, 2018 - 2030 (Kilotons) (USD Billion)
- 7.2.4.3 Latin America Synthetic Lubricants Estimates & Forecasts, By Application, 2018 - 2030 (Kilotons) (USD Billion)
- 7.2.4.4 Brazil
- 7.2.4.4.1 Brazil Synthetic Lubricants Estimates & Forecasts, By Product, 2018 - 2030 (Kilotons) (USD Billion)
- 7.2.4.4.2 Brazil Synthetic Lubricants Estimates & Forecasts, By Application, 2018 - 2030 (Kilotons) (USD Billion)
- 7.2.4.5 Argentina
- 7.2.4.5.1 Argentina Synthetic Lubricants Estimates & Forecasts, By Product, 2018 - 2030 (Kilotons) (USD Billion)
- 7.2.4.5.2 Argentina Synthetic Lubricants Estimates & Forecasts, By Application, 2018 - 2030 (Kilotons) (USD Billion)
- 7.2.5 Middle East & Africa
- 7.2.5.1 Middle East & Africa Synthetic Lubricants Estimates & Forecasts, 2018 - 2030 (Kilotons) (USD Billion)
- 7.2.5.2 Middle East & Africa Synthetic Lubricants Estimates & Forecasts, By Product, 2018 - 2030 (Kilotons) (USD Billion)
- 7.2.5.3 Middle East & Africa Synthetic Lubricants Estimates & Forecasts, By Application, 2018 - 2030 (Kilotons) (USD Billion)
- 7.2.5.4 UAE
- 7.2.5.4.1 UAE Synthetic Lubricants Estimates & Forecasts, By Product, 2018 - 2030 (Kilotons) (USD Billion)
- 7.2.5.4.2 UAE Synthetic Lubricants Estimates & Forecasts, By Application, 2018 - 2030 (Kilotons) (USD Billion)
- 7.2.1 North America
Chapter 8 Synthetic Lubricants Market - Competitive Analysis
- 8.1 Recent Development & Impact Analysis, By Key Market Participants
- 8.2 Company/Competition Categorization (Key innovators, Market leaders, Emerging Players)
- 8.3 Vendor Landscape
- 8.3.1 List of Distributors And Channel Partners
- 8.3.2 List of Potential End - Users
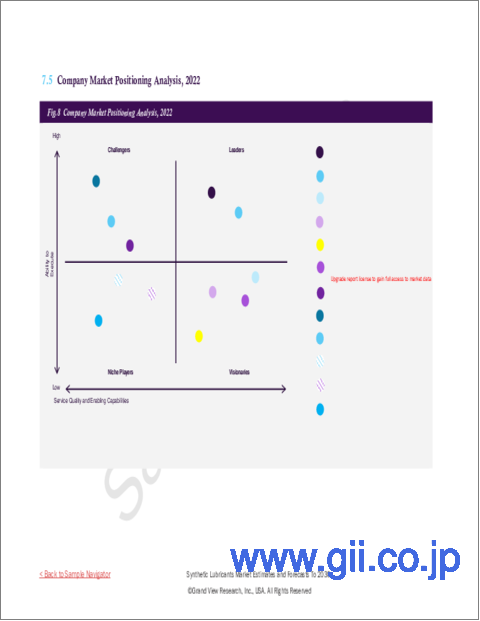
- 8.4 Key Company Market Positioning Analysis, 2022
- 8.5 Major Deals & Strategic Alliances Analysis
Chapter 9 Company Profiles
- 9.1 BP Lubricants Pvt. Ltd.
- 9.1.1 Company Overview
- 9.1.2 Financial Performance
- 9.1.3 Product Benchmarking
- 9.1.4 Strategic Initiatives
- 9.2 Chevron Corporation
- 9.2.1 Company Overview
- 9.2.2 Financial Performance
- 9.2.3 Product Benchmarking
- 9.2.4 Strategic Initiatives
- 9.3 LANXESS
- 9.3.1 Company Overview
- 9.3.2 Financial Performance
- 9.3.3 Product Benchmarking
- 9.3.4 Strategic Initiatives
- 9.4 Valvoline
- 9.4.1 Company Overview
- 9.4.2 Financial Performance
- 9.4.3 Product Benchmarking
- 9.4.4 Strategic Initiatives
- 9.5 FUCHS
- 9.5.1 Company Overview
- 9.5.2 Financial Performance
- 9.5.3 Product Benchmarking
- 9.5.4 Strategic Initiatives
- 9.6 Pennzoil
- 9.6.1 Company Overview
- 9.6.2 Financial Performance
- 9.6.3 Product Benchmarking
- 9.6.4 Strategic Initiatives
- 9.7 Phillips 66 Company
- 9.7.1 Company Overview
- 9.7.2 Financial Performance
- 9.7.3 Product Benchmarking
- 9.7.4 Strategic Initiatives
- 9.8 Motul
- 9.8.1 Company Overview
- 9.8.2 Financial Performance
- 9.8.3 Product Benchmarking
- 9.8.4 Strategic Initiatives
- 9.9 AMSOIL INC.
- 9.9.1 Company Overview
- 9.9.2 Financial Performance
- 9.9.3 Product Benchmarking
- 9.9.4 Strategic Initiatives
- 9.10 Agip
- 9.10.1 Company Overview
- 9.10.2 Financial Performance
- 9.10.3 Product Benchmarking
- 9.10.4 Strategic Initiatives