|
|
市場調査レポート
商品コード
1171100
マウスピース型矯正装置の市場規模、シェア、動向分析レポート:年齢別(成人、ティーン)、エンドユーザー別(病院、単独診療、グループ診療、その他)、地域別、セグメント別予測、2023年~2030年Clear Aligners Market Size, Share & Trends Analysis Report By Age (Adults, Teens), By End-Use (Hospitals, Standalone Practices, Group Practices, Others), By Region, And Segment Forecasts, 2023 - 2030 |
||||||
|
● お客様のご希望に応じて、既存データの加工や未掲載情報(例:国別セグメント)の追加などの対応が可能です。 詳細はお問い合わせください。 |
|||||||
| マウスピース型矯正装置の市場規模、シェア、動向分析レポート:年齢別(成人、ティーン)、エンドユーザー別(病院、単独診療、グループ診療、その他)、地域別、セグメント別予測、2023年~2030年 |
|
出版日: 2022年11月30日
発行: Grand View Research
ページ情報: 英文 100 Pages
納期: 2~10営業日
|
- 全表示
- 概要
- 図表
- 目次
マウスピース型矯正装置市場の成長と動向
Grand View Research, Inc.の新しいレポートによると、世界のマウスピース型矯正装置の市場規模は2030年までに323億米ドルに達し、予測期間中に30.08%のCAGRを記録すると予想されています。マウスピース型矯正装置は、コポリエステルやポリカーボネートプラスチックなどの熱成形材料とCAD 3Dプリント技術から開発された、目立たない矯正器具で、従来の矯正器具に代わるものとして機能しています。FDAによると、マウスピース型矯正装置システムは、継続的な優しい力によって歯の位置を調整するのに役立ち、軽度から中程度の不正咬合を治療するために開発されました。WHOによると、不正咬合は、虫歯と歯周病に次いで世界で3番目に多い歯科疾患です。不正咬合は、歯並びの悪さが問題となり、後に硬組織や軟組織の外傷など、口腔内の深刻な合併症を引き起こす可能性があります。この状態は遺伝性であり、世代を超えて受け継がれる可能性があります。
技術の進歩とカスタマイズされたマウスピース型矯正装置の需要の増加は、市場の成長を担っている重要な要因です。アライン・テクノロジーやダイナフレックスなどの企業は、常に新しいコンピュータ支援技術を市場に投入しています。例えば、アライン・テクノロジー社によるデジタル印象システムであるiTeroの発売は、軽度から中程度のずれ状態を治療するために、装着者の快適性に合わせて設計された、正確で効果的、かつカスタマイズされたマウスピース型矯正装置の開発に役立っています。2018年11月にScielo.comに掲載された記事によると、クラスI不正咬合の世界の有病率は74.7%、クラスII不正咬合は19.56%、これらの状態の有病率の上昇は、マウスピース型矯正装置の需要のエスカレートに寄与しています。
マウスピース型矯正装置の需要は、特に10代の間で急成長を示しています。例えば、アラインテクノロジー社が開発したFDA承認のインビザラインは、2020年時点で1090万人の治療に使用され、インビザラインの世界出荷数は2020年で約413,700例となっています。現在までに500万人以上のティーンエイジャーがインビザライン・マウスピース型矯正装置による矯正治療を開始しています。これは、多くのティーンエイジャーが金属製の矯正装置による不快感を避けることを好み、また審美的にも魅力的な見た目にしようとするためです。上記のような要因が複合的に作用し、市場全体の堅調な成長を支えています。
マウスピース型矯正装置市場レポートハイライト
2022年、年齢別の成人セグメントが最大の消費者セグメントとして浮上したが、目立たない特性と快適性のために10代の若者がマウスピース型矯正装置を選ぶようになっているため、10代のセグメントがより高い成長率を示すと思われます。
独立開業医がマウスピース型矯正装置システムを容易に採用し、高度なデジタル技術を備えているため、最終用途のスタンドアローンセグメントが2022年に最大のシェアを獲得しました。
ポリウレタンで構成されたインビザラインの存在が、このセグメントの優位性の主な要因となっています。また、リテーナー用途でポリウレタンを使用することで、患者の口の中に長く留まり、歯を所定の位置に保持するデバイスになります。
デジタル自動マウスピース型矯正装置の流通と販売の大部分は、オフラインチャネルを通じて行われています。エンドユーザーは、一般的にGD、歯科専門医、歯科研究所、歯科矯正医、DSO(歯科サービス機関)である
2021年の世界市場は、新技術への需要の高まり、主要プレイヤーの数の多さ、歯科疾患の有病率の上昇、高度なヘルスケアインフラにより、北米が支配的でした。
アジア太平洋地域は、歯科疾患の増加や歯科治療の増加により、予測期間中に最も高いCAGRを相互に達成すると予想されます。
目次
第1章 調査手法と範囲
- 市場セグメンテーションと範囲
- 年
- 材料の種類
- 最終用途
- 流通経路
- 地域範囲
- 調査手法
- 情報調達
- 購入したデータベース
- Gvrの内部データベース
- 二次情報
- 1次調査
- 1次調査の詳細
- 情報またはデータ分析
- データ分析モデル
- 市場の策定と検証
- モデルの詳細
- コモディティフロー分析(モデル1)
- 出来高価格分析(モデル2)
- 二次情報のリスト
- 一次情報のリスト
- 略語一覧
- 目的
第2章 エグゼクティブサマリー
- 市場の見通し
第3章 マウスピース型矯正装置市場:変数、動向、および範囲
- 市場系列の見通し
- 親市場の見通し
- 関連/補助的な市場の見通し
- 歯科用 3Dプリンティング市場
- 歯科インプラント市場
- 市場セグメンテーションと範囲
- 市場促進要因分析
- 急速に増加する不正咬合の患者数
- 歯科衛生における急速な技術的進歩
- カスタマイズされたアライナーの需要の高まり
- 市場抑制要因分析
- マウスピース型矯正装置の高コスト
- 浸透と成長の見通しのマッピング
- ポーターのファイブフォース分析
- PESTEL分析
第4章 COVID-19の影響
- COVID-19歯科業界の影響
- COVID-19がマウスピース型矯正装置に与える影響
- マウスピース型矯正装置市場COVID-19パンデミックの影響
- ギャップ分析
- 流通チャネルの分析(オンライン対直接販売)
- Align Technology, Inc.
- Envista Holdings Corporation
- Henry Schein, Inc.
- Argen Corporation
- Tp Orthodontics, Inc.
- 3m
- Straumann
- Dentsply Sirona
- Smiledirect Club
- Angel Aligner
- 売上分析
第5章 マウスピース型矯正装置市場:年齢層分析
- マウスピース型矯正装置:市場シェア分析、2022年および2030年
- 大人
- 10代
第6章 マウスピース型矯正装置市場:材料タイプセグメント分析
- マウスピース型矯正装置:市場シェア分析、2022年および2030年
- ポリウレタン
- プラスチックポリエチレンテレフタレートグリコール
- その他
第7章 マウスピース型矯正装置市場:エンドユースセグメント分析
- マウスピース型矯正装置:市場シェア分析、2022年および2030年
- 病院
- スタンドアロンのプラクティス
- グループプラクティス
- その他
第8章 マウスピース型矯正装置市場:流通チャネルセグメント分析
- マウスピース型矯正装置:市場シェア分析、2022年および2030年
- オンライン
- オフライン
第9章 マウスピース型矯正装置市場:地域分析
- マウスピース型矯正装置:市場シェア分析、2022年および2030年
- 北米
- 米国
- カナダ
- 欧州
- 英国
- ドイツ
- フランス
- イタリア
- スペイン
- ノルウェー
- デンマーク
- スウェーデン
- アジア太平洋地域
- 日本
- 中国
- インド
- オーストラリア
- 韓国
- タイ
- ラテンアメリカ
- ブラジル
- メキシコ
- アルゼンチン
- 中東・アフリカ
- 南アフリカ
- サウジアラビア
- アラブ首長国連邦
- クウェート
第10章 競合分析
- 企業プロファイル
- ALIGN TECHNOLOGY, INC.
- 会社概要
- 財務実績
- 製品のベンチマーク
- 戦略的イニシアチブ
- ENVISTA HOLDING CORPORATION
- 会社概要
- 財務実績
- 製品のベンチマーク
- 戦略的イニシアチブ
- INSTITUT STRAUMANN AG
- 会社概要
- 財務実績
- 製品のベンチマーク
- 戦略的イニシアチブ
- DENTSPLY SIRONA
- 会社概要
- 財務実績
- 製品のベンチマーク
- 戦略的イニシアチブ:
- 3M
- 会社概要
- 財務実績
- 製品のベンチマーク
- 戦略的イニシアチブ
- ARGEN CORPORATION
- 会社概要
- 財務実績
- 製品のベンチマーク
- 戦略的イニシアチブ
- HENRY SCHEIN, INC.
- 会社概要
- 財務実績
- 製品のベンチマーク
- 戦略的イニシアチブ
- TP ORTHODONTICS, INC.
- 会社概要
- 財務実績
- 製品のベンチマーク
- 戦略的イニシアチブ
- ANGEL ALIGNER
- 会社概要
- 財務実績
- 製品のベンチマーク
- 戦略的イニシアチブ
- SMILEDIRECT CLUB
- 会社概要
- 財務実績
- 製品のベンチマーク
- 戦略的イニシアチブ
- ALIGN TECHNOLOGY, INC.
List of Tables
- Table 1 List of Abbreviations
- Table 2 List of secondary sources
List of Figures
- Fig. 1 Market research process
- Fig. 2 Information procurement
- Fig. 3 Primary research pattern
- Fig. 4 Market research approaches
- Fig. 5 Value-chain-based sizing & forecasting
- Fig. 6 Market formulation & validation
- Fig. 7 Commodity flow analysis
- Fig. 8 Volume Price Analysis
- Fig. 9 Clear aligners market snapshot (2022)
- Fig. 10 Clear aligners market segmentation
- Fig. 11 Market driver relevance analysis (Current & future impact)
- Fig. 12 Market restraint relevance analysis (Current & future impact)
- Fig. 13 Penetration & growth prospect mapping
- Fig. 14 Porter's five forces analysis
- Fig. 15 SWOT analysis, by factor (political & legal, economic and technological)
- Fig. 16 Clear aligners market age outlook: Segment dashboard
- Fig. 17 Clear aligners market: Age movement analysis
- Fig. 18 Adults market, 2018 - 2030 (USD Million)
- Fig. 19 Teens market, 2018 - 2030 (USD Million)
- Fig. 20 Clear aligners market material type outlook: Segment dashboard
- Fig. 21 Clear aligners market: Material type movement analysis
- Fig. 22 Polyurethane market, 2018 - 2030 (USD Million)
- Fig. 23 Plastic polyethylene terephthalate glycol market, 2018 - 2030 (USD Million)
- Fig. 24 Others market, 2018 - 2030 (USD Million)
- Fig. 25 Clear aligners market end-use outlook: Segment dashboard
- Fig. 26 Clear aligners market: End-use movement analysis
- Fig. 27 Hospitals market, 2018 - 2030 (USD Million)
- Fig. 28 Standalone Practitioners market, 2018 - 2030 (USD Million)
- Fig. 29 Group Practitioners market, 2018 - 2030 (USD Million)
- Fig. 30 Others market, 2018 - 2030 (USD Million)
- Fig. 31 Clear aligners market distribution channel outlook: Segment dashboard
- Fig. 32 Clear aligners market: Distribution channel movement analysis
- Fig. 33 Online market, 2018 - 2030 (USD Million)
- Fig. 34 Offline market, 2018 - 2030 (USD Million)
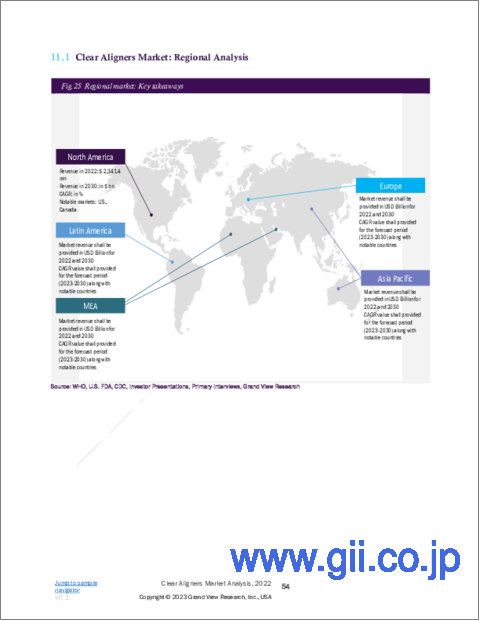
- Fig. 35 Regional market: Key takeaways
- Fig. 36 Regional outlook, 2022 & 2030
- Fig. 37 North America market, 2018 - 2030 (USD Million)
- Fig. 38 U.S. market, 2018 - 2030 (USD Million)
- Fig. 39 Canada market, 2018 - 2030 (USD Million)
- Fig. 40 Europe market, 2018 - 2030 (USD Million)
- Fig. 41 U.K. market, 2018 - 2030 (USD Million)
- Fig. 42 Germany market, 2018 - 2030 (USD Million)
- Fig. 43 France market, 2018 - 2030 (USD Million)
- Fig. 44 Italy market, 2018 - 2030 (USD Million)
- Fig. 45 Spain market, 2018 - 2030 (USD Million)
- Fig. 46 Norway market, 2018 - 2030 (USD Million)
- Fig. 47 Denmark market, 2018 - 2030 (USD Million)
- Fig. 48 Sweden market, 2018 - 2030 (USD Million)
- Fig. 49 Asia Pacific market, 2018 - 2030 (USD Million)
- Fig. 50 China market, 2018 - 2030 (USD Million)
- Fig. 51 India market, 2018 - 2030 (USD Million)
- Fig. 52 Japan market, 2018 - 2030 (USD Million)
- Fig. 53 Australia market, 2018 - 2030 (USD Million)
- Fig. 54 South Korea market, 2018 - 2030 (USD Million)
- Fig. 55 Thailand market, 2018 - 2030 (USD Million)
- Fig. 56 Latin America market, 2018 - 2030 (USD Million)
- Fig. 57 Brazil market, 2018 - 2030 (USD Million)
- Fig. 58 Mexico market, 2018 - 2030 (USD Million)
- Fig. 59 Argentina market, 2018 - 2030 (USD Million)
- Fig. 60 MEA market, 2018 - 2030 (USD Million)
- Fig. 61 South Africa market, 2018 - 2030 (USD Million)
- Fig. 62 Saudi Arabia market, 2018 - 2030 (USD Million)
- Fig. 63 UAE market, 2018 - 2030 (USD Million)
- Fig. 64 Kuwait market, 2018 - 2030 (USD Million)
Clear Aligners Market Growth & Trends:
The global clear aligners market size is expected to reach USD 32.3 billion by 2030, according to a new report by Grand View Research, Inc., registering a CAGR of 30.08% over the forecast period. Clear Aligners are invisible and discreet braces developed from thermoformed materials like copolyester or polycarbonate plastic and CAD 3D printing technology, acting as an alternative to traditional braces. According to the FDA, the clear aligner system helps in positioning the teeth through continuous gentle force and is developed to treat mild to moderate malocclusion. According to WHO, malocclusion is the third most prevalent dental disease after dental caries and periodontal disease globally. Malocclusion of the teeth causes the problem of misalignment which can later lead to severe oral health complications like hard and soft tissue trauma. This condition is hereditary and can be passed from one generation to another.
Technological advancements and the growing demand for customized clear aligners are significant factors responsible for market growth. Companies like Align Technology and DynaFlex are constantly bringing newer computer-aided technology to the market. For instance, the launch of iTero which is a digital impression system, by Align Technology is assisting in developing accurate, effective, and customized clear aligners designed in accordance with the wearer's comfort to treat mild to moderate misalignment conditions. According to an article published in Scielo.com in November 2018, the global prevalence of Class I malocclusions is 74.7%, Class II malocclusions are 19.56% and the rising prevalence of these conditions is assisting in the escalating demand for clear aligners.
The demand for customized clear aligners has witnessed a burgeoning growth, especially among teenagers. For Instance, the FDA-approved, Invisalign clear aligners developed by Align Technology, have been used in the treatment of 10.9 million people as of 2020 and worldwide Invisalign shipments were about 413,700 cases in 2020. To date, over 5 million teenagers have started orthodontic treatment with Invisalign clear aligners. This is because many teenagers prefer avoiding discomfort caused by the metal braces and also try to look esthetically appealing. The above-mentioned factors are cumulatively assisting in the overall robust market growth.
Clear Aligners Market Report Highlights:
- Adult segment by age emerged as the largest consumer segment in 2022, however, teens segment is likely to exhibit a higher growth rate as teenagers are increasingly opting for clear aligners because of their inconspicuous characteristics and comfort
- Standalone segment of end-use reciprocated the largest share in 2022 as standalone practitioners are readily adopting clear aligner systems and are equipped with advanced digital technologies
- The presence of invisalign made up of polyurethane is the primary factor responsible for segment dominance. Additionally, using polyurethane in a retainer application results in a device that will stay in a patient's mouth for a longer time and hold the teeth in place.
- A major portion of distribution and sales of digitally automated clear aligners is through offline channels. The end-users are generally GDs, dental specialists, dental laboratories, orthodontists, and DSOs (dental service organizations)
- North America dominated the global market in 2021 owing to the increasing demand for new technologies, a large pool of key players, the rising prevalence of dental disorders, and advanced healthcare infrastructure
- Asia Pacific is expected to reciprocate the highest CAGR over the forecast period due to the rising number of dental disorders and procedures
Table of Contents
Chapter 1 Methodology and Scope
- 1.1 Market Segmentation & Scope
- 1.1.1 Age
- 1.1.2 Material Type
- 1.1.3 End-Use
- 1.1.4 Distribution Channel
- 1.1.5 Regional Scope
- 1.1.6 Estimates And Forecast Timeline
- 1.2 Research Methodology
- 1.3 Information Procurement
- 1.3.1 Purchased Database
- 1.3.2 Gvr's Internal Database
- 1.3.3 Secondary Sources
- 1.3.4 Primary Research
- 1.3.5 Details Of Primary Research
- 1.4 Information Or Data Analysis
- 1.4.1 Data Analysis Models
- 1.5 Market Formulation & Validation
- 1.6 Model Details
- 1.6.1 Commodity Flow Analysis (Model 1)
- 1.6.2 Volume Price Analysis (Model 2)
- 1.7 List Of Secondary Sources
- 1.8 List Of Primary Sources
- 1.9 List Of Abbreviations
- 1.10 Objectives
- 1.10.1 Objective - 1:
- 1.10.2 Objective - 2:
- 1.10.3 Objective - 3:
Chapter 2 Executive Summary
- 2.1 Market Outlook
Chapter 3 Clear Aligners Market: Variables, Trends, & Scope
- 3.1 Market Lineage Outlook
- 3.1.1 Parent Market Outlook
- 3.1.2 Related/Ancillary Market Outlook
- 3.1.2.1 Dental 3d Printing Market
- 3.1.2.2 Dental Implant Market
- 3.2 Market Segmentation And Scope
- 3.3 Market Driver Analysis
- 3.3.1 Rapidly Growing Patient Population With Malocclusion
- 3.3.2 Rapid Technological Advancements In Dental Health
- 3.3.3 Growing Demand For Customized Aligners
- 3.4 Market Restraint Analysis
- 3.4.1 High Cost Of Clear Aligners
- 3.5 Penetration & Growth Prospect Mapping
- 3.6 Porter's Five Forces Analysis
- 3.7 Pestel Analysis
Chapter 4 Impact Of Covid-19
- 4.1 Impact Of Covid-19 Dental Industry
- 4.2 Impact Of Covid-19 On Clear Aligners
- 4.3 After Effects Of Covid-19 Pandemic On Clear Aligners Market
- 4.4 Gap Analysis
- 4.5 Analysis On Distribution Channel (Online Vs Direct Sales)
- 4.5.1 Align Technology, Inc.
- 4.5.2 Envista Holdings Corporation
- 4.5.3 Henry Schein, Inc.
- 4.5.4 Argen Corporation
- 4.5.5 Tp Orthodontics, Inc.
- 4.5.6 3m
- 4.5.7 Straumann
- 4.5.8 Dentsply Sirona
- 4.5.9 Smiledirect Club
- 4.5.10 Angel Aligner
- 4.6 Sales Analysis
Chapter 5 Clear Aligners Market: Age Segment Analysis
- 5.1 Clear Aligners: Market Share Analysis, 2022 & 2030
- 5.2 Adults
- 5.2.1 Adults Market, 2018-2030 (Usd Million)
- 5.3 Teens
- 5.3.1 Teens Market, 2018-2030 (Usd Million)
Chapter 6 Clear Aligners Market: Material Type Segment Analysis
- 6.1 Clear Aligners: Market Share Analysis, 2022 & 2030
- 6.2 Polyurethane
- 6.2.1 Polyurethane Market, 2018-2030 (Usd Million)
- 6.3 Plastic Polyethylene Terephthalate Glycol
- 6.3.1 Plastic Polyethylene Terephthalate Glycol Market , 2018-2030 (Usd Million)
- 6.4 Others
- 6.4.1 Others Market, 2018-2030 (Usd Million)
Chapter 7 Clear Aligners Market: End Use Segment Analysis
- 7.1 Clear Aligners: Market Share Analysis, 2022 & 2030
- 7.2 Hospitals
- 7.2.1 Hospitals Market, 2018-2030 (Usd Million)
- 7.3 Stand Alone Practices
- 7.3.1 Stand Alone Practices Market, 2018-2030 (Usd Million)
- 7.4 Group Practices
- 7.4.1 Group Practices Market, 2018-2030 (Usd Million)
- 7.5 Others
- 7.5.1 Others Market, 2018-2030 (Usd Million)
Chapter 8 Clear Aligners Market: Distribution Channel Segment Analysis
- 8.1 Clear Aligners: Market Share Analysis, 2022 & 2030
- 8.2 Online
- 8.2.1 Online Market, 2018-2030 (Usd Million)
- 8.3 Offline
- 8.3.1 Offline Market, 2018-2030 (Usd Million)
Chapter 9 Clear Aligners Market: Regional Analysis
- 9.1 Clear Aligners: Market Share Analysis, 2022 & 2030
- 9.2 North America
- 9.2.1 North America Clear Aligners Market, 2018 - 2030 (USD Million)
- 9.2.2 U.S.
- 9.2.2.1 U.S. Clear Aligners Market, 2018 - 2030 (USD Million)
- 9.2.3 Canada
- 9.2.3.1 Canada Clear Aligners Market, 2018 - 2030 (USD Million)
- 9.3 Europe
- 9.3.1 Europe Clear Aligners Market, 2018 - 2030 (USD Million)
- 9.3.2 U.K.
- 9.3.2.1 U.K. Clear Aligners Market, 2018 - 2030 (USD Million)
- 9.3.3 Germany
- 9.3.3.1 Germany Clear Aligners Market, 2018 - 2030 (USD Million)
- 9.3.4 France
- 9.3.4.1 France Clear Aligners Market, 2018 - 2030 (USD Million)
- 9.3.5 Italy
- 9.3.5.1 Italy Clear Aligners Market, 2018 - 2030 (USD Million)
- 9.3.6 Spain
- 9.3.6.1 Spain Clear Aligners Market, 2018 - 2030 (USD Million)
- 9.3.7 Norway
- 9.3.7.1 Norway Clear Aligners Market, 2018 - 2030 (USD Million)
- 9.3.8 Denmark
- 9.3.8.1 Denmark Aligners Market, 2018 - 2030 (USD Million)
- 9.3.9 Sweden
- 9.3.9.1 Sweden Clear Aligners Market, 2018 - 2030 (USD Million)
- 9.4 Asia Pacific
- 9.4.1 Asia Pacific Clear Aligners Market, 2018 - 2030 (USD Million)
- 9.4.2 Japan
- 9.4.2.1 Japan Clear Aligners Market, 2018 - 2030 (USD Million)
- 9.4.3 China
- 9.4.3.1 China Clear Aligners Market, 2018 - 2030 (USD Million)
- 9.4.4 India
- 9.4.4.1 India Clear Aligners Market, 2018 - 2030 (USD Million)
- 9.4.5 Australia
- 9.4.5.1 Australia Clear Aligners Market, 2018 - 2030 (USD Million)
- 9.4.6 South Korea
- 9.4.6.1 South Korea Clear Aligners Market, 2018 - 2030 (USD Million)
- 9.4.7 Thailand
- 9.4.7.1 Thailand Clear Aligners Market, 2018 - 2030 (USD Million)
- 9.5 Latin America
- 9.5.1 Latin America Clear Aligners Market, 2018 - 2030 (USD Million)
- 9.5.2 Brazil
- 9.5.2.1 Brazil Clear Aligners Market, 2018 - 2030 (USD Million)
- 9.5.3 Mexico
- 9.5.3.1 Mexico Clear Aligners Market, 2018 - 2030 (USD Million)
- 9.5.4 Argentina
- 9.5.4.1 Argentina Clear Aligners Market, 2018 - 2030 (USD Million)
- 9.6 Mea
- 9.6.1 Mea Clear Aligners Market, 2018 - 2030 (USD Million)
- 9.6.2 South Africa
- 9.6.2.1 South Africa Clear Aligners Market, 2018 - 2030 (USD Million)
- 9.6.3 Saudi Arabia
- 9.6.3.1 Saudi Arabia Clear Aligners Market, 2018 - 2030 (USD Million)
- 9.6.4 Uae
- 9.6.4.1 Uae Clear Aligners Market, 2018 - 2030 (USD Million)
- 9.6.5 Kuwait
- 9.6.5.1 Kuwait Clear Aligners market, 2018 - 2030 (USD Million)
Chapter 10 Competitive Analysis
- 10.1 Company Profiles
- 10.1.1 ALIGN TECHNOLOGY, INC.
- 10.1.1.1 Company Overview
- 10.1.1.2 Financial Performance
- 10.1.1.3 Product Benchmarking
- 10.1.1.4 Strategic Initiatives
- 10.1.2 ENVISTA HOLDING CORPORATION
- 10.1.2.1 Company Overview
- 10.1.2.2 Financial Performance
- 10.1.2.3 Product Benchmarking
- 10.1.2.4 Strategic Initiatives
- 10.1.3 INSTITUT STRAUMANN AG
- 10.1.3.1 Company Overview
- 10.1.3.2 Financial Performance
- 10.1.3.3 Product Benchmarking
- 10.1.3.4 Strategic Initiatives
- 10.1.4 DENTSPLY SIRONA
- 10.1.4.1 Company Overview
- 10.1.4.2 Financial Performance
- 10.1.4.3 Product Benchmarking
- 10.1.4.4 Strategic Initiatives:
- 10.1.5 3M
- 10.1.5.1 Company Overview
- 10.1.5.2 Financial Performance
- 10.1.5.3 Product Benchmarking
- 10.1.5.4 Strategic Initiatives
- 10.1.6 ARGEN CORPORATION
- 10.1.6.1 Company Overview
- 10.1.6.2 Financial Performance
- 10.1.6.3 Product Benchmarking
- 10.1.6.4 Strategic Initiatives
- 10.1.7 HENRY SCHEIN, INC.
- 10.1.7.1 Company Overview
- 10.1.7.2 Financial Performance
- 10.1.7.3 Product Benchmarking
- 10.1.7.4 Strategic Initiatives
- 10.1.8 TP ORTHODONTICS, INC.
- 10.1.8.1 Company Overview
- 10.1.8.2 Financial Performance
- 10.1.8.3 Product Benchmarking
- 10.1.8.4 Strategic Initiatives
- 10.1.9 ANGEL ALIGNER
- 10.1.9.1 Company Overview
- 10.1.9.2 Financial Performance
- 10.1.9.3 Product Benchmarking
- 10.1.9.4 Strategic Initiatives
- 10.1.10 SMILEDIRECT CLUB
- 10.1.10.1 Company Overview
- 10.1.10.2 Financial Performance
- 10.1.10.3 Product Benchmarking
- 10.1.10.4 Strategic Initiatives
- 10.1.1 ALIGN TECHNOLOGY, INC.


