|
|
市場調査レポート
商品コード
1170929
動脈カニューレの世界市場 - 市場規模、シェア、動向分析:用途別、サイズ別、最終用途別、地域別、セグメント予測(2023年~2030年)Arterial Cannula Market Size, Share & Trends Analysis Report By Application (ECMO, Cardiopulmonary Bypass Surgery), By Size (20-22 Fr, 35-36 Fr), By End-use (Hospitals, ASCs) By Region, And Segment Forecasts, 2023 - 2030 |
||||||
|
|
|||||||
|
● お客様のご希望に応じて、既存データの加工や未掲載情報(例:国別セグメント)の追加などの対応が可能です。 詳細はお問い合わせください。 |
|||||||


| 動脈カニューレの世界市場 - 市場規模、シェア、動向分析:用途別、サイズ別、最終用途別、地域別、セグメント予測(2023年~2030年) |
|
出版日: 2022年11月09日
発行: Grand View Research
ページ情報: 英文 120 Pages
納期: 2~10営業日
|
- 全表示
- 概要
- 図表
- 目次
世界の動脈カニューレの市場規模は、2030年までに3,340万米ドルに達し、予測期間中にCAGRで7.2%の成長が予測されています。
慢性疾患の流行が外科手術の増加につながり、業界の成長を促進しています。
当レポートでは、世界の動脈カニューレ市場について調査分析し、市場の動向、セグメント分析、地域分析、競合情勢などを提供しています。
目次
第1章 調査手法と範囲
第2章 エグゼクティブサマリー
第3章 動脈カニューレ市場の変数、動向、範囲
- 市場系列の見通し
- 親企業の市場の見通し
- 関連/付随する市場の見通し
- 浸透と成長の見通しのマッピング
- 業界バリューチェーン分析
- 償還の枠組み
- 市場力学
- 市場促進要因の分析
- 市場抑制要因の分析
- 動脈カニューレ市場の分析ツール
- 業界分析 - ポーターのファイブフォース分析
- PESTEL分析
- 主な取引と戦略的提携の分析
- 市場参入戦略
第4章 動脈カニューレデバイス:用途の推計と動向の分析
- 定義と範囲
- 製品の市場シェア(2022年・2030年)
- セグメントダッシュボード
- 世界の動脈カニューレ市場:製品の見通し別
- 市場規模、予測、動向の分析(2017年~2030年)
- 心肺バイパス手術
- 体外式膜型人工肺(ECMO)
- その他
第5章 動脈カニューレ:サイズの推計と動向の分析
- 定義と範囲
- サイズの市場シェア(2022年・2030年)
- セグメントダッシュボード
- 世界の動脈カニューレ市場:用途の見通し別
- 市場規模、予測、動向の分析(2017年~2030年)
- 14~16Fr
- 17~19Fr
- 20~22Fr
- 23~25Fr
- 26~28Fr
- 29~31Fr
- 32~34Fr
- 35~36Fr
第6章 最終用途の推計と動向の分析
- 定義と範囲
- 最終用途の市場シェア(2022年・2030年)
- セグメントダッシュボード
- 世界の動脈カニューレ市場:最終用途の見通し別
- 市場規模、予測、動向の分析(2017年~2030年)
- 病院
- 外来手術センター
- その他
第7章 動脈カニューレ市場:地域の推計と動向の分析
- 地域の市場シェア分析(2022年・2030年)
- 地域市場ダッシュボード
- 世界の地域市場のスナップショット
- 地域の市場シェアと主要企業(2022年)
- 北米
- 欧州
- アジア太平洋
- ラテンアメリカ
- 中東・アフリカ
- SWOT分析:要因別
- 北米
- 欧州
- アジア太平洋
- ラテンアメリカ
- 中東・アフリカ
- 市場規模、予測、動向の分析(2017年~2030年)
- 北米
- 米国
- カナダ
- 欧州
- 英国
- ドイツ
- フランス
- イタリア
- スペイン
- アジア太平洋
- 日本
- 中国
- インド
- ラテンアメリカ
- ブラジル
- メキシコ
- アルゼンチン
- 中東・アフリカ
- 南アフリカ
- サウジアラビア
- アラブ首長国連邦
第8章 競合情勢
- 最近の動向と影響の分析:主な市場参入企業別
- 企業/競合の分類
- イノベーター
- マーケットリーダー
- 新興企業
- ベンダー情勢
- 主な販売業者とチャネルパートナーのリスト
- 主要顧客
- 主な企業の市場シェアの分析(2022年)
- Medtronic, plc.
- LivaNova plc
- Edward Lifesciences
- Getinge AB
- Fresenius Medical Care
- BD
- Nipro Corporation
- Andocor
- Freelife Medical GmbH
- Surgical Holdings
List of Tables
- Table 1 List of Abbreviation
- Table 2 North America arterial cannula market, by region 2017 - 2030 (USD Million)
- Table 3 North America arterial cannula market, by application 2017 - 2030 (USD Million)
- Table 4 North America arterial cannula market, by size 2017 - 2030 (USD Million)
- Table 5 North America arterial cannula market, by end-use 2017 - 2030 (USD Million)
- Table 6 U.S. arterial cannula market, by application 2017 - 2030 (USD Million)
- Table 7 U.S. arterial cannula market, by size 2017 - 2030 (USD Million)
- Table 8 U.S. arterial cannula market, by end-use 2017 - 2030 (USD Million)
- Table 9 Canada arterial cannula market, by application 2017 - 2030 (USD Million)
- Table 10 Canada arterial cannula market, by size 2017 - 2030 (USD Million)
- Table 11 Canada arterial cannula market, by end-use 2017 - 2030 (USD Million)
- Table 12 Europe arterial cannula market, by region 2017 - 2030 (USD Million)
- Table 13 Europe arterial cannula market, by application 2017 - 2030 (USD Million)
- Table 14 Europe arterial cannula market, by size 2017 - 2030 (USD Million)
- Table 15 Europe arterial cannula market, by end-use 2017 - 2030 (USD Million)
- Table 16 Germany arterial cannula market, by application 2017 - 2030 (USD Million)
- Table 17 Germany arterial cannula market, by size 2017 - 2030 (USD Million)
- Table 18 Germany arterial cannula market, by end-use 2017 - 2030 (USD Million)
- Table 19 U.K. arterial cannula market, by application 2017 - 2030 (USD Million)
- Table 20 U.K. arterial cannula market, by size 2017 - 2030 (USD Million)
- Table 21 U.K. arterial cannula market, by end-use 2017 - 2030 (USD Million)
- Table 22 France arterial cannula market, by application 2017 - 2030 (USD Million)
- Table 23 France arterial cannula market, by size 2017 - 2030 (USD Million)
- Table 24 France arterial cannula market, by end-use 2017 - 2030 (USD Million)
- Table 25 Italy arterial cannula market, by application 2017 - 2030 (USD Million)
- Table 26 Italy arterial cannula market, by size 2017 - 2030 (USD Million)
- Table 27 Italy arterial cannula market, by end-use 2017 - 2030 (USD Million)
- Table 28 Spain arterial cannula market, by application 2017 - 2030 (USD Million)
- Table 29 Spain arterial cannula market, by size 2017 - 2030 (USD Million)
- Table 30 Spain arterial cannula market, by end-use 2017 - 2030 (USD Million)
- Table 31 APAC arterial cannula market, by region 2017 - 2030 (USD Million)
- Table 32 APAC arterial cannula market, by application 2017 - 2030 (USD Million)
- Table 33 APAC arterial cannula market, by size 2017 - 2030 (USD Million)
- Table 34 APAC arterial cannula market, by end-use 2017 - 2030 (USD Million)
- Table 35 China arterial cannula market, by application 2017 - 2030 (USD Million)
- Table 36 China arterial cannula market, by size 2017 - 2030 (USD Million)
- Table 37 China arterial cannula market, by end-use 2017 - 2030 (USD Million)
- Table 38 Japan arterial cannula market, by application 2017 - 2030 (USD Million)
- Table 39 Japan arterial cannula market, by size 2017 - 2030 (USD Million)
- Table 40 Japan arterial cannula market, by end-use 2017 - 2030 (USD Million)
- Table 41 India arterial cannula market, by application 2017 - 2030 (USD Million)
- Table 42 India arterial cannula market, by size 2017 - 2030 (USD Million)
- Table 43 India arterial cannula market, by end-use 2017 - 2030 (USD Million)
- Table 44 Latin America arterial cannula market, by region 2017 - 2030 (USD Million)
- Table 45 Latin America arterial cannula market, by application 2017 - 2030 (USD Million)
- Table 46 Latin America arterial cannula market, by size 2017 - 2030 (USD Million)
- Table 47 Latin America arterial cannula market, by end-use 2017 - 2030 (USD Million)
- Table 48 Brazil arterial cannula market, by application 2017 - 2030 (USD Million)
- Table 49 Brazil arterial cannula market, by size 2017 - 2030 (USD Million)
- Table 50 Brazil arterial cannula market, by end-use 2017 - 2030 (USD Million)
- Table 51 Mexico arterial cannula market, by application 2017 - 2030 (USD Million)
- Table 52 Mexico arterial cannula market, by size 2017 - 2030 (USD Million)
- Table 53 Mexico arterial cannula market, by end-use 2017 - 2030 (USD Million)
- Table 54 Argentina arterial cannula market, by application 2017 - 2030 (USD Million)
- Table 55 Argentina arterial cannula market, by size 2017 - 2030 (USD Million)
- Table 56 Argentina arterial cannula market, by end-use 2017 - 2030 (USD Million)
- Table 57 Middle East and Africa arterial cannula market, by region 2017 - 2030 (USD Million)
- Table 58 Middle East and Africa arterial cannula market, by application 2017 - 2030 (USD Million)
- Table 59 Middle East and Africa arterial cannula market, by size 2017 - 2030 (USD Million)
- Table 60 Middle East and Africa arterial cannula market, by end-use 2017 - 2030 (USD Million)
- Table 61 South Africa arterial cannula market, by application 2017 - 2030 (USD Million)
- Table 62 South Africa arterial cannula market, by size 2017 - 2030 (USD Million)
- Table 63 South Africa arterial cannula market, by end-use 2017 - 2030 (USD Million)
- Table 64 Saudi Arabia arterial cannula market, by application 2017 - 2030 (USD Million)
- Table 65 Saudi Arabia arterial cannula market, by size 2017 - 2030 (USD Million)
- Table 66 Saudi Arabia arterial cannula market, by end-use 2017 - 2030 (USD Million)
- Table 67 UAE arterial cannula market, by application 2017 - 2030 (USD Million)
- Table 68 UAE arterial cannula market, by size 2017 - 2030 (USD Million)
- Table 69 UAE arterial cannula market, by end-use 2017 - 2030 (USD Million)
List of Figures
- Fig. 1 Market research process
- Fig. 2 Data triangulation techniques
- Fig. 3 Primary research pattern
- Fig. 4 Primary interviews in North America
- Fig. 5 Primary interviews in Europe
- Fig. 6 Primary interviews in APAC
- Fig. 7 Primary interviews in Latin America
- Fig. 8 Primary interviews in MEA
- Fig. 9 Market research approaches
- Fig. 10 Value-chain-based sizing & forecasting
- Fig. 11 QFD modeling for market share assessment
- Fig. 12 Market formulation & validation
- Fig. 13 Arterial cannula: market outlook
- Fig. 14 Arterial cannula market competitive insights
- Fig. 15 Parent market outlook
- Fig. 16 Related/ancillary market outlook
- Fig. 17 Penetration and growth prospect mapping
- Fig. 18 Industry value chain analysis
- Fig. 19 Arterial cannula market driver impact
- Fig. 20 Arterial cannula market restraint impact
- Fig. 21 Arterial cannula market strategic initiatives analysis
- Fig. 22 Arterial cannula market: application movement analysis
- Fig. 23 Arterial cannula market: application outlook and key takeaways
- Fig. 24 Cardiopulmonary bypass surgery market estimates and forecast 2017 - 2030
- Fig. 25 Extracorporeal membrane oxygenation (ECMO) estimates and forecast 2017 - 2030
- Fig. 26 Others market estimates and forecast 2017 - 2030
- Fig. 27 Arterial cannula market: size movement analysis
- Fig. 28 Arterial cannula market: size outlook and key takeaways
- Fig. 29 14-16 Fr estimates and forecast 2017 - 2030
- Fig. 30 17-19 Fr estimates and forecast 2017 - 2030
- Fig. 31 20-22 Fr estimates and forecast 2017 - 2030
- Fig. 32 23-25 Fr estimates and forecast 2017 - 2030
- Fig. 33 26-28 Fr estimates and forecast 2017 - 2030
- Fig. 34 29-31 Fr estimates and forecast 2017 - 2030
- Fig. 35 32-34 Fr estimates and forecast 2017 - 2030
- Fig. 36 35-36 Fr estimates and forecast 2017 - 2030
- Fig. 37 Arterial cannula market: end-use movement analysis
- Fig. 38 Arterial cannula market: end-use outlook and key takeaways
- Fig. 39 Hospitals estimates and forecast 2017 - 2030
- Fig. 40 Ambulatory surgical centers estimates and forecast 2017 - 2030
- Fig. 41 Others estimates and forecast 2017 - 2030
- Fig. 42 Global Arterial cannula market: regional movement analysis
- Fig. 43 Global Arterial cannula market: regional outlook and key takeaways
- Fig. 44 Global market share and leading players
- Fig. 45 North America market share and leading players
- Fig. 46 Europe market share and leading players
- Fig. 47 Asia Pacific market share and leading players
- Fig. 48 Latin America market share and leading players
- Fig. 49 Middle East & Africa market share and leading players
- Fig. 50 North America: SWOT
- Fig. 51 Europe SWOT
- Fig. 52 Asia Pacific SWOT
- Fig. 53 Latin America SWOT
- Fig. 54 MEA SWOT
- Fig. 55 North America, by country
- Fig. 56 North America
- Fig. 57 North America market estimates and forecast 2017 - 2030
- Fig. 58 U.S.
- Fig. 59 U.S. market estimates and forecast 2017 - 2030
- Fig. 60 Canada
- Fig. 61 Canada market estimates and forecast 2017 - 2030
- Fig. 62 Europe
- Fig. 63 Europe market estimates and forecast 2017 - 2030
- Fig. 64 U.K.
- Fig. 65 U.K. market estimates and forecast 2017 - 2030
- Fig. 66 Germany
- Fig. 67 Germany market estimates and forecast 2017 - 2030
- Fig. 68 France
- Fig. 69 France market estimates and forecast 2017 - 2030
- Fig. 70 Italy
- Fig. 71 Italy market estimates and forecast 2017 - 2030
- Fig. 72 Spain
- Fig. 73 Spain market estimates and forecast 2017 - 2030
- Fig. 74 Asia Pacific
- Fig. 75 Asia Pacific market estimates and forecast 2017 - 2030
- Fig. 76 China
- Fig. 77 China market estimates and forecast 2017 - 2030
- Fig. 78 Japan
- Fig. 79 Japan market estimates and forecast 2017 - 2030
- Fig. 80 India
- Fig. 81 India market estimates and forecast 2017 - 2030
- Fig. 82 Latin America
- Fig. 83 Latin America market estimates and forecast 2017 - 2030
- Fig. 84 Brazil
- Fig. 85 Brazil market estimates and forecast 2017 - 2030
- Fig. 86 Mexico
- Fig. 87 Mexico market estimates and forecast 2017 - 2030
- Fig. 88 Argentina
- Fig. 89 Argentina market estimates and forecast 2017 - 2030
- Fig. 90 Middle East and Africa
- Fig. 91 Middle East and Africa market estimates and forecast 2017 - 2030
- Fig. 92 South Africa
- Fig. 93 South Africa market estimates and forecast 2017 - 2030
- Fig. 94 Saudi Arabia
- Fig. 95 Saudi Arabia market estimates and forecast 2017 - 2030
- Fig. 96 UAE
- Fig. 97 UAE market estimates and forecast 2017 - 2030
- Fig. 98 Participant categorization- Arterial cannula market
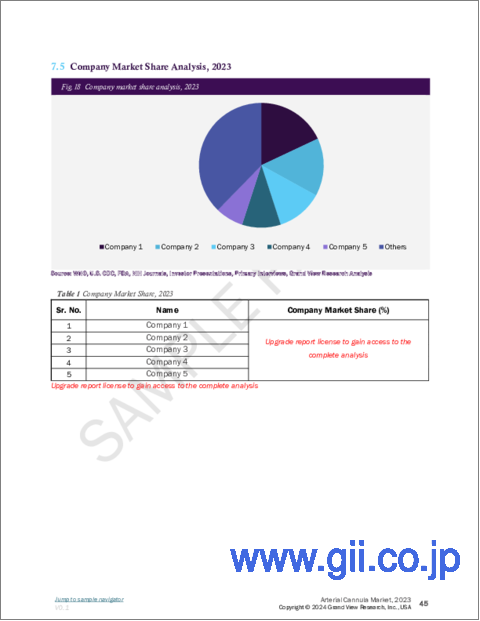
- Fig. 99 Market share of key market players- Arterial cannula market
Arterial Cannula Market Growth & Trends:
The global arterial cannula market size is projected to reach USD 33.4 million by 2030, registering a CAGR of 7.2% over theforecast period, according to a new report by Grand View Research. An increase in the prevalence of chronic diseases is leading to a rise in surgical procedures, which is driving the growth of the industry. According to an article published by the National Library of Medicine in September 2020, an overwhelming 310 million major surgeries are performed each year; around 20 million in Europe and about 40 to 50 million in the USA. Furthermore, advancements in minimally invasive surgeries are driving product demand. Minimally invasive techniques and cutting-edge technology give patients fast recovery time, less pain, and the best aesthetic results.
These advantages have resulted in the increasing adoption of minimally invasive techniques, which is leading to an increasing number of patients opting to undergo these surgical interventions. The COVID-19 pandemic resulted in a temporary fall in product sales. This is due to the postponement of elective surgeries to avoid the spread of the virus and focus dedicatedly on combatting the COVID-19 virus. However, the market began to quickly recover in the second half of the pandemic with increasing efforts of healthcare professionals and different strategies led down at the micro as well as macro-economic levels. The industry is further expected to experience significant demand over the forecast period with governments of various countries majorly focusing on healthcare to avoid similar situations in the future. Moreover, increasing investments in the healthcare sector are also expected to boost the overall industry growth over the forecast period.
Arterial Cannula Market Report Highlights:
- The ECMO segment held the highest revenue share in 2022 owing to the increasing adoption of the arterial cannula for oxygenation
- The cardiopulmonary bypass surgery segment is projected to experience the fastestCAGR over the forecast period due to the increasing prevalence of cardiac diseases
- The 20-22 Fr size segment led the market, in terms ofrevenue share in 2022 as these are the most commonly used arterial cannulas
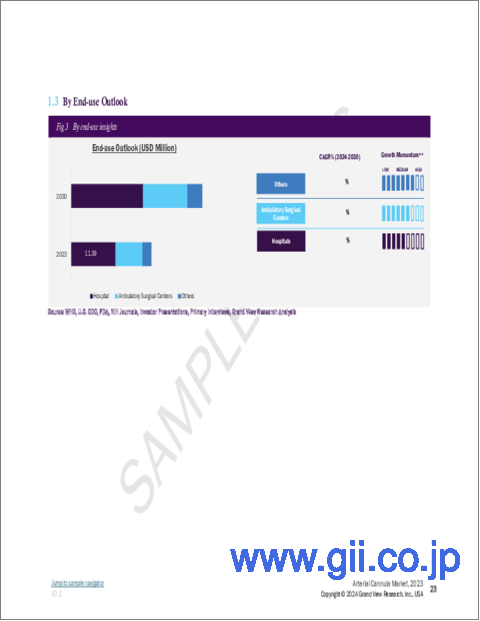
- The hospitals segment held the largest share in 2022 as the majority of surgical procedures are carried out in these settings
- The ASCs segmentwill registerthe fastest growth rate over the forecast period due to favorable reimbursement initiatives by various governments
- North America was the largest region in 2022 owing to a well-developed healthcare structure and a significant patient pool
- Asia Pacific is expected to be the fastest-growing region over the forecast period due to the high prevalence of chronic diseases and the increasing geriatric population
Table of Contents
Chapter 1. Methodology and Scope
- 1.1. Market Segmentation & Scope
- 1.1.1. Application
- 1.1.2. Size
- 1.1.3. End-Use
- 1.1.4. Regional scope
- 1.1.5. Estimates and forecast timeline
- 1.2. Research Methodology
- 1.3. Information Procurement
- 1.3.1. Purchased database
- 1.3.2. GVR's internal database
- 1.3.3. Secondary sources
- 1.3.4. Primary research
- 1.3.5. Details of primary research
- 1.3.5.1. Data for primary interviews in North America
- 1.3.5.2. Data for primary interviews in Europe
- 1.3.5.3. Data for primary interviews in Asia Pacific
- 1.3.5.4. Data for primary interviews in Latin America
- 1.3.5.5. Data for Primary interviews in MEA
- 1.4. Information or Data Analysis
- 1.4.1. Data analysis models
- 1.5. Market Formulation & Validation
- 1.6. Model Details
- 1.6.1. Commodity flow analysis (Model 1)
- 1.6.2. Approach 1: Commodity flow approach
- 1.6.3. Volume price analysis (Model 2)
- 1.6.4. Approach 2: Volume price analysis
- 1.7. List of Secondary Sources
- 1.8. List of Primary Sources
- 1.9. Objectives
- 1.9.1. Objective 1
- 1.9.2. Objective 2
Chapter 2. Executive Summary
- 2.1. Market Outlook
- 2.2. Segment Outlook
- 2.2.1. Application Outlook
- 2.2.2. Size Outlook
- 2.2.3. End-use Outlook
- 2.2.4. Regional Outlook
- 2.3. Competitive Insights
Chapter 3. Arterial Cannula Market Variables, Trends & Scope
- 3.1. Market Lineage Outlook
- 3.1.1. Parent market outlook
- 3.1.2. Related/ancillary market outlook
- 3.2. Penetration & Growth Prospect Mapping
- 3.3. Industry Value Chain Analysis
- 3.3.1. Reimbursement framework
- 3.4. Market Dynamics
- 3.4.1. Market driver analysis
- 3.4.1.1. Increasing prevalence of chronic diseases
- 3.4.1.2. Increasing geriatric population
- 3.4.1.3. Rise in number of surgical procedures
- 3.4.1.4. Advancements in minimally invasive surgeries
- 3.4.2. Market restraint analysis
- 3.4.2.1. Lack of skilled professionals
- 3.4.2.2. Product recalls
- 3.4.1. Market driver analysis
- 3.5. Arterial Cannula Market Analysis Tools
- 3.5.1. Industry Analysis - Porter's
- 3.5.1.1. Supplier power
- 3.5.1.2. Buyer power
- 3.5.1.3. Substitution threat
- 3.5.1.4. Threat of new entrant
- 3.5.1.5. Competitive rivalry
- 3.5.2. PESTEL Analysis
- 3.5.2.1. Political landscape
- 3.5.2.2. Technological landscape
- 3.5.2.3. Economic landscape
- 3.5.3. Major Deals & Strategic Alliances Analysis
- 3.5.4. Market Entry Strategies
- 3.5.1. Industry Analysis - Porter's
Chapter 4. Arterial Cannula Device: Application Estimates & Trend Analysis
- 4.1. Definitions and Scope
- 4.1.1. Cardiopulmonary Bypass Surgery
- 4.1.2. Extracorporeal Membrane Oxygenation (ECMO)
- 4.1.3. Others
- 4.2. Product Market Share, 2022 & 2030
- 4.3. Segment Dashboard
- 4.4. Global Arterial Cannula Market by Product Outlook
- 4.5. Market Size & Forecasts and Trend Analyses, 2017 to 2030 for the following
- 4.5.1. Cardiopulmonary Bypass Surgery
- 4.5.1.1. Market estimates and forecast 2017 - 2030 (Revenue in USD Million)
- 4.5.2. Extracorporeal Membrane Oxygenation (ECMO)
- 4.5.2.1. Market estimates and forecast, 2017 - 2030 (Revenue in USD Million)
- 4.5.3. Others
- 4.5.3.1. Market estimates and forecast, 2017 - 2030 (Revenue in USD Million)
- 4.5.1. Cardiopulmonary Bypass Surgery
Chapter 5. Arterial Cannula: Size Estimates & Trend Analysis
- 5.1. Definitions and Scope
- 5.1.1. 14-16 Fr
- 5.1.2. 17-19 Fr
- 5.1.3. 20-22 Fr
- 5.1.4. 23-25 Fr
- 5.1.5. 26-28 Fr
- 5.1.6. 29- 31 Fr
- 5.1.7. 32-34 Fr
- 5.1.8. 35-36 Fr
- 5.2. Size Market Share, 2022 & 2030
- 5.3. Segment Dashboard
- 5.4. Global Arterial Cannula Market by Application Outlook
- 5.5. Market Size & Forecasts and Trend Analyses, 2017 to 2030 for the following
- 5.5.1. 14-16 Fr
- 5.5.1.1. Market estimates and forecast, 2017 - 2030 (Revenue in USD Million)
- 5.5.2. 17-19 Fr
- 5.5.2.1. Market estimates and forecast, 2017 - 2030 (Revenue in USD Million)
- 5.5.3. 20-22 Fr
- 5.5.3.1. Market estimates and forecast, 2017 - 2030 (Revenue in USD Million)
- 5.5.4. 23-25 Fr
- 5.5.4.1. Market estimates and forecast, 2017 - 2030 (Revenue in USD Million)
- 5.5.5. 26-28 Fr
- 5.5.5.1. Market estimates and forecast, 2017 - 2030 (Revenue in USD Million)
- 5.5.6. 29-31 Fr
- 5.5.6.1. Market estimates and forecast, 2017 - 2030 (Revenue in USD Million)
- 5.5.7. 32-34 Fr
- 5.5.7.1. Market estimates and forecast, 2017 - 2030 (Revenue in USD Million)
- 5.5.8. 35-36 Fr
- 5.5.8.1. Market estimates and forecast, 2017 - 2030 (Revenue in USD Million)
- 5.5.1. 14-16 Fr
Chapter 6. End - Use Estimates & Trend Analysis
- 6.1. Definitions and Scope
- 6.1.1. Hospitals
- 6.1.2. Ambulatory Surgical Centers
- 6.1.3. Others
- 6.2. End-Use Market Share, 2022 & 2030
- 6.3. Segment Dashboard
- 6.4. Global Arterial Cannula Market by End-Use Outlook
- 6.5. Market Size & Forecasts and Trend Analyses, 2017 to 2030 for the following
- 6.5.1. Hospitals
- 6.5.1.1. Market estimates and forecast, 2017 - 2030 (Revenue in USD Million)
- 6.5.2. Ambulatory Surgical Centers
- 6.5.2.1. Market estimates and forecast, 2017 - 2030 (Revenue in USD Million)
- 6.5.3. Others
- 6.5.3.1. Market estimates and forecast, 2017 - 2030 (Revenue in USD Million)
- 6.5.1. Hospitals
Chapter 7. Arterial Cannula Market: Regional Estimates & Trend Analysis
- 7.1. Regional market share analysis, 2022 & 2030
- 7.2. Regional Market Dashboard
- 7.3. Global Regional Market Snapshot
- 7.4. Regional Market Share and Leading Players, 2022
- 7.4.1. North America
- 7.4.2. Europe
- 7.4.3. Asia Pacific
- 7.4.4. Latin America
- 7.4.5. Middle East and Africa
- 7.5. SWOT Analysis, by Factor (Political & Legal, Economic and Technological)
- 7.5.1. North America
- 7.5.2. Europe
- 7.5.3. Asia Pacific
- 7.5.4. Latin America
- 7.5.5. Middle East and Africa
- 7.6. Market Size, & Forecasts and Trend Analysis, 2017 to 2030:
- 7.7. North America
- 7.7.1. Market estimates and forecast 2017 - 2030 (Revenue, USD Million)
- 7.7.2. U.S.
- 7.7.2.1. Market estimates and forecast 2017 - 2030 (Revenue, USD Million)
- 7.7.3. Canada
- 7.7.3.1. Market estimates and forecast 2017 - 2030 (Revenue, USD Million)
- 7.8. Europe
- 7.8.1. U.K.
- 7.8.1.1. Market estimates and forecast 2017 - 2030 (Revenue, USD Million)
- 7.8.2. Germany
- 7.8.2.1. Market estimates and forecast 2017 - 2030 (Revenue, USD Million)
- 7.8.3. France
- 7.8.3.1. Market estimates and forecast 2017 - 2030 (Revenue, USD Million)
- 7.8.4. Italy
- 7.8.4.1. Market estimates and forecast 2017 - 2030 (Revenue, USD Million)
- 7.8.5. Spain
- 7.8.5.1. Market estimates and forecast 2017 - 2030 (Revenue, USD Million)
- 7.8.1. U.K.
- 7.9. Asia Pacific
- 7.9.1. Japan
- 7.9.1.1. Market estimates and forecast 2017 - 2030 (Revenue, USD Million)
- 7.9.2. China
- 7.9.2.1. Market estimates and forecast 2017 - 2030 (Revenue, USD Million)
- 7.9.3. India
- 7.9.3.1. Market estimates and forecast 2017 - 2030 (Revenue, USD Million)
- 7.9.1. Japan
- 7.10. Latin America
- 7.10.1. Brazil
- 7.10.1.1. Market estimates and forecast 2017 - 2030 (Revenue, USD Million)
- 7.10.2. Mexico
- 7.10.2.1. Market estimates and forecast 2017 - 2030 (Revenue, USD Million)
- 7.10.3. Argentina
- 7.10.3.1. Market estimates and forecast 2017 - 2030 (Revenue, USD Million)
- 7.10.1. Brazil
- 7.11. MEA
- 7.11.1. South Africa
- 7.11.1.1. Market estimates and forecast 2017 - 2030 (Revenue, USD Million)
- 7.11.2. Saudi Arabia
- 7.11.2.1. Market estimates and forecast 2017 - 2030 (Revenue, USD Million)
- 7.11.3. UAE
- 7.11.3.1. Market estimates and forecast 2017 - 2030 (Revenue, USD Million)
- 7.11.1. South Africa
Chapter 8. Competitive Landscape
- 8.1. Recent Developments & Impact Analysis, By Key Market Participants
- 8.2. Company/Competition Categorization
- 8.2.1. Innovators
- 8.2.2. Market Leaders
- 8.2.3. Emerging Players
- 8.3. Vendor Landscape
- 8.3.1. List of key distributors and channel partners
- 8.3.2. Key customers
- 8.3.3. Key company market share analysis, 2022
- 8.3.4. Medtronic, plc.
- 8.3.4.1. Company overview
- 8.3.4.2. Financial performance
- 8.3.4.3. Product benchmarking
- 8.3.4.4. Strategic initiatives
- 8.3.5. LivaNova plc
- 8.3.5.1. Company overview
- 8.3.5.2. Financial performance
- 8.3.5.3. Product benchmarking
- 8.3.5.4. Strategic initiatives
- 8.3.6. Edward Lifesciences
- 8.3.6.1. Company overview
- 8.3.6.2. Financial performance
- 8.3.6.3. Product benchmarking
- 8.3.6.4. Strategic initiatives
- 8.3.7. Getinge AB
- 8.3.7.1. Company overview
- 8.3.7.2. Financial performance
- 8.3.7.3. Product benchmarking
- 8.3.7.4. Strategic initiatives
- 8.3.8. Fresenius Medical Care
- 8.3.8.1. Company overview
- 8.3.8.2. Financial performance
- 8.3.8.3. Product benchmarking
- 8.3.8.4. Strategic initiatives
- 8.3.9. BD
- 8.3.9.1. Company overview
- 8.3.9.2. Financial performance
- 8.3.9.3. Product benchmarking
- 8.3.9.4. Strategic initiatives
- 8.3.10. Nipro Corporation
- 8.3.10.1. Company overview
- 8.3.10.2. Financial performance
- 8.3.10.3. Product benchmarking
- 8.3.10.4. Strategic initiatives
- 8.3.11. Andocor
- 8.3.11.1. Company overview
- 8.3.11.2. Financial performance
- 8.3.11.3. Product benchmarking
- 8.3.11.4. Strategic initiatives
- 8.3.12. Freelife Medical GmbH
- 8.3.12.1. Company overview
- 8.3.12.2. Financial performance
- 8.3.12.3. Product benchmarking
- 8.3.12.4. Strategic initiatives
- 8.3.13. Surgical Holdings
- 8.3.13.1. Company overview
- 8.3.13.2. Financial performance
- 8.3.13.3. Product benchmarking
- 8.3.13.4. Strategic initiatives