|
|
市場調査レポート
商品コード
1133325
遺伝子毒性試験の市場規模、シェア、動向分析レポートタイプ別(インビトロ、インビボ)、製品別(試薬・消耗品、アッセイ、サービス)、用途別、地域別、セグメント別予測、2022年~2030年Genetic Toxicology Testing Market Size, Share & Trends Analysis Report By Type (In-vitro, In-vivo), By Product (Reagents & Consumables, Assays, Services), By Application, By Region, And Segment Forecasts, 2022 - 2030 |
||||||
|
|
|||||||
|
● お客様のご希望に応じて、既存データの加工や未掲載情報(例:国別セグメント)の追加などの対応が可能です。 詳細はお問い合わせください。 |
|||||||


| 遺伝子毒性試験の市場規模、シェア、動向分析レポートタイプ別(インビトロ、インビボ)、製品別(試薬・消耗品、アッセイ、サービス)、用途別、地域別、セグメント別予測、2022年~2030年 |
|
出版日: 2022年09月26日
発行: Grand View Research
ページ情報: 英文 150 Pages
納期: 2~10営業日
|
- 全表示
- 概要
- 図表
- 目次
遺伝子毒性試験市場の成長と動向
Grand View Research, Inc.の新しいレポートによると、世界の遺伝子毒物検査市場規模は2030年までに35億7000万米ドルに達すると予測されています。同市場は、2022年から2030年にかけてCAGR12.7%で拡大すると予測されています。個別化医薬品の使用量の増加と、世界の細胞・遺伝子治療の発展が相まって、遺伝子毒性に対する需要が高まっています。例えば、米国FDAは、細胞および遺伝子治療の製造業者向けにガイダンス文書を作成しました。このガイダンスによると、前臨床試験における毒性および生理学的パラメータの特定に関する情報は、治験薬の臨床モニタリングの指導に役立つとのことです。
個別化医療の利用や薬物有害毒性のリスク低減を支援するための薬理遺伝学の導入が増加していることは、業界の成長に大きな影響を与えると考えられています。さらに、オランダ薬理遺伝学ワーキンググループ(DPWG)、臨床薬理遺伝学実施コンソーシアム(CPIC)、フランス薬理遺伝学全国ネットワーク、カナダ医薬品安全性薬理遺伝学ネットワーク(CPNDS)などの組織は、薬理遺伝学検査の解釈と治療上の特定の薬剤-遺伝子ペアの推奨に主眼を置いて臨床ガイドラインを発行しています。
同様に、市場企業は、複数のセグメントで足跡を拡大するために様々な戦略に耽っています。例えば、2021年11月、Labcorpは、非臨床試験サービスを提供する契約研究機関(CRO)であるToxikonの買収を発表しています。この買収により、Labcorpは毒物検査事業を強化すると予想され、Toxikonの立地により、Labcorpは地域の有名バイオテクノロジー企業や製薬企業と非臨床業務で関わることができるようになります。
COVID-19の大流行は、遺伝子毒性試験市場の成長に中立的な影響を与えると予想されます。数多くの研究者がCOVID-19ウイルスに対する薬剤の効果を評価するために遺伝子毒性を採用しました。例えば、2020年9月、研究者チームは、ウイルスに対する予防薬としてクロロキン(CQ)およびヒドロキシクロロキン(HCQ)の影響を評価しました。様々な薬剤や化学物質の遺伝子毒性を評価しました。評価のツールとして遺伝子毒性試験を用いたこのような研究は、COVID-19のピーク時に安定した成長をサポートすると予想されます。
新規食品とその輸入品に対する需要の高まりは、市場成長の一因となることが予想されます。チャールズリバーラボラトリーズは、新規食品に関する毒物学的評価を提供する主要企業の1つです。彼らは、in vivo小核試験、Ames試験、In Vitro Mammalian Cell Micronucleus、in vivo comet assayからなる遺伝子毒性を含む新規食品分析を提供しています。同様に、2021年1月、EFSAは昆虫由来食品の評価を発表しました。これは、同機関が新規食品としての昆虫製品について実施した最初の種類の評価です。毎年、EFSAには、藻類食品、植物、非原産果実をベースとした生薬製品からなる多数の申請が寄せられています。
一方、遺伝子毒性学による情報の取り出しには限界があります。病理検査解説組織によると、遺伝子検査は、検査対象となる特定の病気・遺伝子に関する情報を提供するものです。それは、存在する可能性があるが検査されていない他の遺伝病に関する情報をカバーするものではありません。同様に、病気を引き起こす遺伝子の変異をすべて特定することはできませんし、病気の重症度を示すものでもありません。したがって、これらの制限は、遺伝子毒性学産業の成長を妨げると予想されます。
遺伝子毒物検査市場レポートハイライト
タイプ別では、in vitroが2021年の遺伝子毒性試験市場で最大のシェアを占め、最も急速に成長すると予想されます。食品産業における遺伝子毒性に対する規制当局の要求が高まっているため
アプリケーション別では、製薬・バイオテクノロジー分野が市場の主要な貢献者になると推定されます。これは、細胞および遺伝子治療の開発、ファーマコゲノミクスおよび個別化医薬品の使用の増加に起因します。
アジア太平洋地域は、特にオーストラリアにおける新型食品の輸入増加や検査規制の強化により、予測期間中に大きく成長すると予測されています。
製品別では、製薬会社やバイオテクノロジー企業による非臨床試験への需要が高まっていることから、2021年にはサービス分野が大きな割合を占めることになります。また、受託研究機関による戦略的イニシアチブの増加も主要な成長決定要因である
北米は、製薬会社やバイオテクノロジー企業の需要に見合う効率的なプレーヤーが存在することから、2021年の遺伝子毒性学の主要地域市場となっています。また、個別化医療の研究開発の増加も大きな要因となっています
主な市場プレイヤーには、Thermo Fisher Scientific, Inc.、Charles River Laboratories International、Laboratory Corp of America Holdings、Eurofins Scientificが含まれます。
目次
第1章 調査手法
- 市場セグメンテーションと範囲
- 調査手法
- 情報調達
- 購入したデータベース
- Gvrの内部データベース
- 二次情報
- 1次調査
- 1次調査の詳細
- 情報またはデータ分析
- データ分析モデル
- 市場の策定と検証
- モデルの詳細
- コモディティフロー分析
- アプローチ1:コモディティフローアプローチ
- アプローチ2:ボトムアップアプローチを使用した国ごとの市場予測
- コモディティフロー分析
- 世界市場:CAGR計算
- 調査の仮定
- 二次情報一覧
- 一次情報のリスト
- 目的
- 略語一覧
第2章 市場の定義
第3章 エグゼクティブサマリー
- 市場概要
第4章 世界の遺伝子毒性試験市場:変数、動向、および範囲
- 遺伝子毒性試験市場のリネージュの見通し
- 親市場の見通し
- 浸透と成長の見通しのマッピング
- 規制の枠組み
- 市場促進要因分析
- 細胞・遺伝子治療の発展
- ファーマコゲノミクスと個別化医療の使用の増加
- 新しい食品の輸入の増加
- 市場抑制要因分析
- 保険契約に関する曖昧な規制
- 限られた情報を提供する能力
- COVID-19影響分析
- ポーターのファイブフォース分析
- SWOT分析
第5章 遺伝子毒性試験市場:セグメント分析、タイプ別、2018年から2030年(100万米ドル)
- 世界の遺伝子毒性試験市場:型変動分析
- 試験管内で
- インビボ
第6章 遺伝子毒性試験市場:セグメント分析、製品別、2018年から2030年(100万米ドル)
- 世界の遺伝子毒性試験市場:製品変動分析
- 試薬と消耗品
- アッセイ
- サービス
第7章 遺伝子毒性試験市場:セグメント分析、アプリケーション別、2018年から2030年(100万米ドル)
- 遺伝子毒性試験市場:アプリケーションの変動分析
- 製薬およびバイオテクノロジー
- 食品業界
- 化粧品業界
- 他の
第8章 遺伝子毒性試験市場:セグメント分析、地域別、2018年-2030年(100万米ドル)
- 遺伝子毒性試験市場:地域変動分析
- 北米
- 米国
- カナダ
- 欧州
- 英国
- ドイツ
- スペイン
- フランス
- イタリア
- アジア太平洋地域
- 日本
- 中国
- インド
- 韓国
- オーストラリア
- ラテンアメリカ
- ブラジル
- メキシコ
- アルゼンチン
- 中東およびアフリカ(MEA)
- 南アフリカ
- サウジアラビア
- アラブ首長国連邦
第9章 競合情勢
- 公開会社
- 会社の市況分析
- 競合ダッシュボード分析
- 戦略的枠組み
- 非公開会社
- 主要な新興企業/テクノロジーディスラプター/イノベーターのリスト
- 地域ネットワークマップ
- 企業プロファイル
- Thermo Fisher Scientific, Inc
- 会社概要
- 財務実績
- 製品のベンチマーク
- 戦略的イニシアチブ
- CHARLES RIVER LABORATORIES INTERNATIONAL
- 会社概要
- 財務実績
- 製品のベンチマーク
- 戦略的イニシアチブ
- Laboratory Corp of America Holdings
- 会社概要
- 財務実績
- 製品のベンチマーク
- 戦略的イニシアチブ
- EUROFINS SCIENTIFIC
- 会社概要
- 財務実績
- 製品のベンチマーク
- 戦略的イニシアチブ
- JUBILANT LIFE SCIENCES LIMITED
- 会社概要
- 財務実績
- 製品のベンチマーク
- 戦略的イニシアチブ
- SYNGENE INTERNATIONAL LIMITED
- 会社概要
- 財務実績
- 製品のベンチマーク
- 戦略的イニシアチブ
- GENTRONIX LTD.
- 会社概要
- 財務実績
- 製品のベンチマーク
- 戦略的イニシアチブ
- INOTIV INC.
- 会社概要
- 財務実績
- 製品のベンチマーク
- 戦略的イニシアチブ
- CREATIVE BIOARRAY
- 会社概要
- 財務実績
- 製品のベンチマーク
- 戦略的イニシアチブ
- MB RESEARCH LABORATORIES
- 会社概要
- 財務実績
- 製品のベンチマーク
- 戦略的イニシアチブ
- Thermo Fisher Scientific, Inc
List of Tables
- Table 1 List of Secondary Sources
- Table 2 List of Abbreviations
- Table 3 Global Genetic Toxicology Testing Market, by Type, 2018 - 2030 (USD Million)
- Table 4 Global Genetic Toxicology Testing Market, by Product 2018 - 2030 (USD Million)
- Table 5 Global Genetic Toxicology Testing Market, by Application, 2018 - 2030 (USD Million)
- Table 6 Global Genetic Toxicology Testing Market, by Region, 2018 - 2030 (USD Million)
- Table 7 North America Genetic Toxicology Testing Market, by Country, 2018 - 2030 (USD Million)
- Table 8 North America Genetic Toxicology Testing Market, by Type, 2018 - 2030 (USD Million)
- Table 9 North America Genetic Toxicology Testing Market, by Product, 2018 - 2030 (USD Million)
- Table 10 North America Genetic Toxicology Testing Market, by Application, 2018 - 2030 (USD Million)
- Table 11 U.S. Genetic Toxicology Testing Market, by Type, 2018 - 2030 (USD Million)
- Table 12 U.S. Genetic Toxicology Testing Market, by Product, 2018 - 2030 (USD Million)
- Table 13 U.S. Genetic Toxicology Testing Market, by Application, 2018 - 2030 (USD Million)
- Table 14 Canada Genetic Toxicology Testing Market, by Type, 2018 - 2030 (USD Million)
- Table 15 Canada Genetic Toxicology Testing Market, by Product, 2018 - 2030 (USD Million)
- Table 16 Canada Genetic Toxicology Testing Market, by Application, 2018 - 2030 (USD Million)
- Table 17 Europe Genetic Toxicology Testing Market, by Country, 2018 - 2030 (USD Million)
- Table 18 Europe Genetic Toxicology Testing Market, by Type, 2018 - 2030 (USD Million)
- Table 19 Europe Genetic Toxicology Testing Market, by Product, 2018 - 2030 (USD Million)
- Table 20 Europe Genetic Toxicology Testing Market, by Application, 2018 - 2030 (USD Million)
- Table 21 Germany Genetic Toxicology Testing Market, by Type, 2018 - 2030 (USD Million)
- Table 22 Germany Genetic Toxicology Testing Market, by Product, 2018 - 2030 (USD Million)
- Table 23 Germany Genetic Toxicology Testing Market, by Application, 2018 - 2030 (USD Million)
- Table 24 U.K. Genetic Toxicology Testing Market, by Type, 2018 - 2030 (USD Million)
- Table 25 U.K. Genetic Toxicology Testing Market, by Product, 2018 - 2030 (USD Million)
- Table 26 U.K. Genetic Toxicology Testing Market, by Application, 2018 - 2030 (USD Million)
- Table 27 France Genetic Toxicology Testing Market, by Type, 2018 - 2030 (USD Million)
- Table 28 France Genetic Toxicology Testing Market, by Product, 2018 - 2030 (USD Million)
- Table 29 France Genetic Toxicology Testing Market, by Application, 2018 - 2030 (USD Million)
- Table 30 Italy Genetic Toxicology Testing Market, by Type, 2018 - 2030 (USD Million)
- Table 31 Italy Genetic Toxicology Testing Market, by Product, 2018 - 2030 (USD Million)
- Table 32 Italy Genetic Toxicology Testing Market, by Application, 2018 - 2030 (USD Million)
- Table 33 Spain Genetic Toxicology Testing Market, by Type, 2018 - 2030 (USD Million)
- Table 34 Spain Genetic Toxicology Testing Market, by Product, 2018 - 2030 (USD Million)
- Table 35 Spain Genetic Toxicology Testing Market, by Application, 2018 - 2030 (USD Million)
- Table 36 Asia Pacific Genetic Toxicology Testing Market, by Country, 2018 - 2030 (USD Million)
- Table 37 Asia Pacific Genetic Toxicology Testing Market, by Type, 2018 - 2030 (USD Million)
- Table 38 Asia Pacific Genetic Toxicology Testing Market, by Product, 2018 - 2030 (USD Million)
- Table 39 Asia Pacific Genetic Toxicology Testing Market, by Application, 2018 - 2030 (USD Million)
- Table 40 China Genetic Toxicology Testing Market, by Type, 2018 - 2030 (USD Million)
- Table 41 China Genetic Toxicology Testing Market, by Product, 2018 - 2030 (USD Million)
- Table 42 China Genetic Toxicology Testing Market, by Application, 2018 - 2030 (USD Million)
- Table 43 Japan Genetic Toxicology Testing Market, by Type, 2018 - 2030 (USD Million)
- Table 44 Japan Genetic Toxicology Testing Market, by Product, 2018 - 2030 (USD Million)
- Table 45 Japan Genetic Toxicology Testing Market, by Application, 2018 - 2030 (USD Million)
- Table 46 India Genetic Toxicology Testing Market, by Type, 2018 - 2030 (USD Million)
- Table 47 India Genetic Toxicology Testing Market, by Product, 2018 - 2030 (USD Million)
- Table 48 India Genetic Toxicology Testing Market, by Application, 2018 - 2030 (USD Million)
- Table 49 South Korea Genetic Toxicology Testing Market, by Type, 2018 - 2030 (USD Million)
- Table 50 South Korea Genetic Toxicology Testing Market, by Product, 2018 - 2030 (USD Million)
- Table 51 South Korea Genetic Toxicology Testing Market, by Application, 2018 - 2030 (USD Million)
- Table 52 Australia Genetic Toxicology Testing Market, by Type, 2018 - 2030 (USD Million)
- Table 53 Australia Genetic Toxicology Testing Market, by Product, 2018 - 2030 (USD Million)
- Table 54 Australia Genetic Toxicology Testing Market, by Application, 2018 - 2030 (USD Million)
- Table 55 Latin America Genetic Toxicology Testing Market, by Country, 2018 - 2030 (USD Million)
- Table 56 Latin America Genetic Toxicology Testing Market, by Type, 2018 - 2030 (USD Million)
- Table 57 Latin America Genetic Toxicology Testing Market, by Product, 2018 - 2030 (USD Million)
- Table 58 Latin America Genetic Toxicology Testing Market, by Application, 2018 - 2030 (USD Million)
- Table 59 Brazil Genetic Toxicology Testing Market, by Type, 2018 - 2030 (USD Million)
- Table 60 Brazil Genetic Toxicology Testing Market, by Product, 2018 - 2030 (USD Million)
- Table 61 Brazil Genetic Toxicology Testing Market, by Application, 2018 - 2030 (USD Million)
- Table 62 Mexico Genetic Toxicology Testing Market, by Type, 2018 - 2030 (USD Million)
- Table 63 Mexico Genetic Toxicology Testing Market, by Product, 2018 - 2030 (USD Million)
- Table 64 Mexico Genetic Toxicology Testing Market, by Application, 2018 - 2030 (USD Million)
- Table 65 Argentina Genetic Toxicology Testing Market, by Type, 2018 - 2030 (USD Million)
- Table 66 Argentina Genetic Toxicology Testing Market, by Product, 2018 - 2030 (USD Million)
- Table 67 Argentina Genetic Toxicology Testing Market, by Application, 2018 - 2030 (USD Million)
- Table 68 Middle East & Africa Genetic Toxicology Testing Market, by Country, 2018 - 2030 (USD Million)
- Table 69 Middle East & Africa Genetic Toxicology Testing Market, by Type, 2018 - 2030 (USD Million)
- Table 70 Middle East & Africa Genetic Toxicology Testing Market, by Product, 2018 - 2030 (USD Million)
- Table 71 Middle East & Africa Genetic Toxicology Testing Market, by Application, 2018 - 2030 (USD Million)
- Table 72 South Africa Genetic Toxicology Testing Market, by Type, 2018 - 2030 (USD Million)
- Table 73 South Africa Genetic Toxicology Testing Market, by Product, 2018 - 2030 (USD Million)
- Table 74 South Africa Genetic Toxicology Testing Market, by Application, 2018 - 2030 (USD Million)
- Table 75 Saudi Arabia Genetic Toxicology Testing Market, by Type, 2018 - 2030 (USD Million)
- Table 76 Saudi Arabia Genetic Toxicology Testing Market, by Product, 2018 - 2030 (USD Million)
- Table 77 Saudi Arabia Genetic Toxicology Testing Market, by Application, 2018 - 2030 (USD Million)
- Table 78 UAE Genetic Toxicology Testing Market, by Type, 2018 - 2030 (USD Million)
- Table 79 UAE Genetic Toxicology Testing Market, by Product, 2018 - 2030 (USD Million)
- Table 80 UAE Genetic Toxicology Testing Market, by Application, 2018 - 2030 (USD Million)
List of Figures
- Fig. 1 Market research process
- Fig. 2 Information Procurement
- Fig. 3 Primary Research Pattern
- Fig. 4 Market Research Approaches
- Fig. 5 Value Chain-Based Sizing & Forecasting
- Fig. 6 Market Formulation & Validation
- Fig. 7 Genetic Toxicology, Market Segmentation
- Fig. 8 Market Snapshot, 2021
- Fig. 9 Market Trends & Outlook
- Fig. 10 Market Driver Relevance Analysis (Current & Future Impact)
- Fig. 11 Market Restraint Relevance Analysis (Current & Future Impact)
- Fig. 12 Market Challenge Relevance Analysis (Current & Future Impact)
- Fig. 13 SWOT Analysis, By Factor (Political & Legal, Economic, and Technological)
- Fig. 14 Porter's Five Forces Analysis
- Fig. 15 Market Penetration Vs Growth Prospect Mapping, 2021
- Fig. 16 Global Protein Expression Market: Type Movement Analysis
- Fig. 17 Global Genetic Toxicology Testing Market, for In Vitro, 2018 - 2030 (USD Million)
- Fig. 18 Global Genetic Toxicology Testing Market, for In Vivo, 2018 - 2030 (USD Million)
- Fig. 19 Global Protein Expression Market: Product Movement Analysis
- Fig. 20 Global Protein Expression Market, for Reagents & Consumables, 2018 - 2030 (USD Million)
- Fig. 21 Global Genetic Toxicology Testing Market, for Assays, 2018 - 2030 (USD Million)
- Fig. 22 Global Genetic Toxicology Testing Market, for Services, 2018 - 2030 (USD Million)
- Fig. 23 Global Protein Expression Market: Application Movement Analysis
- Fig. 24 Global Genetic Toxicology Testing Market, for Pharmaceutical; Biotechnology, 2018 - 2030 (USD Million)
- Fig. 25 Global Genetic Toxicology Testing Market, for Food Industry, 2018 - 2030 (USD Million)
- Fig. 26 Global Genetic Toxicology Testing Market, for Cosmetics Industry, 2018 - 2030 (USD Million)
- Fig. 27 Global Genetic Toxicology Testing Market, for Other, 2018 - 2030 (USD Million)
- Fig. 28 Regional Marketplace: Key Takeaways
- Fig. 29 Regional Outlook, 2021 & 2030
- Fig. 30 Global Genetic Toxicology Testing Market: Region Movement Analysis
- Fig. 31 North America Genetic Toxicology Testing Market, 2018 - 2030 (USD Million)
- Fig. 32 U.S. Genetic Toxicology Testing Market, 2018 - 2030 (USD Million)
- Fig. 33 Canada Genetic Toxicology Testing Market, 2018 - 2030 (USD Million)
- Fig. 34 Europe Genetic Toxicology Testing Market, 2018 - 2030 (USD Million)
- Fig. 35 Germany Genetic Toxicology Testing Market, 2018 - 2030 (USD Million)
- Fig. 36 U.K. Genetic Toxicology Testing Market, 2018 - 2030 (USD Million)
- Fig. 37 France Genetic Toxicology Testing Market, 2018 - 2030 (USD Million)
- Fig. 38 Italy Genetic Toxicology Testing Market, 2018 - 2030 (USD Million)
- Fig. 39 Spain Genetic Toxicology Testing Market, 2018 - 2030 (USD Million)
- Fig. 40 Asia Pacific Genetic Toxicology Testing Market, 2018 - 2030 (USD Million)
- Fig. 41 Japan Genetic Toxicology Testing Market, 2018 - 2030 (USD Million)
- Fig. 42 China Genetic Toxicology Testing Market, 2018 - 2030 (USD Million)
- Fig. 43 India Genetic Toxicology Testing Market, 2018 - 2030 (USD Million)
- Fig. 44 Australia Genetic Toxicology Testing Market, 2018 - 2030 (USD Million)
- Fig. 45 South Korea Genetic Toxicology Testing Market, 2018 - 2030 (USD Million)
- Fig. 46 Latin America Genetic Toxicology Testing Market, 2018 - 2030 (USD Million)
- Fig. 47 Brazil Genetic Toxicology Testing Market, 2018 - 2030 (USD Million)
- Fig. 48 Mexico Genetic Toxicology Testing Market, 2018 - 2030 (USD Million)
- Fig. 49 Argentina Genetic Toxicology Testing Market, 2018 - 2030 (USD Million)
- Fig. 50 Middle East and Africa Genetic Toxicology Testing Market, 2018 - 2030 (USD Million)
- Fig. 51 South Africa Genetic Toxicology Testing Market, 2018 - 2030 (USD Million)
- Fig. 52 Saudi Arabia Genetic Toxicology Testing Market, 2018 - 2030 (USD Million)
- Fig. 53 UAE Genetic Toxicology Testing Market, 2018 - 2030 (USD Million)
Genetic Toxicology Testing Market Growth & Trends:
The global genetic toxicology testing market size is expected to reach USD 3.57 billion by 2030, according to a new report by Grand View Research, Inc. The market is anticipated to expand at a CAGR of 12.7% from 2022 to 2030. The rising usage of personalized medicines, combined with the development of cell and gene therapy across the globe is enhancing the demand for genotoxicity. For instance, the U.S. FDA has designed guidance documents for the manufacturers of cell and gene therapy. According to the guidance, information on the identification of toxicities and physiologic parameters in preclinical studies can assist in guiding clinical monitoring for the investigational product.
Increasing implementation of pharmacogenomics to support personalized medicine usage and reduced risk of adverse drug toxicity is considered to have a significant impact on the growth of the industry. Moreover, organizations, such as the Dutch Pharmacogenetics Working Group (DPWG), Clinical Pharmacogenetics Implementation Consortium (CPIC), the French National Network of Pharmacogenetics, and the Canadian Pharmacogenomics Network for Drug Safety (CPNDS), have issued clinical guidelines with a primary focus on the pharmacogenomics testing interpretation and recommendation on therapeutic specific drug-gene pairs.
Similarly, the market players are indulging in various strategies to expand their footprint in multiple segments. For instance, in November 2021, Labcorp announced the acquisition of Toxikon, a Contract Research Organization (CRO) with offerings in nonclinical testing services. Through this acquisition, Labcorp is anticipated to strengthen its toxicology business and Toxikon's location enables Labcorp to engage with known biotech and pharmaceutical companies in the region for non-clinical work.
The COVID-19 pandemic is anticipated to have a neutral impact on the genetic toxicology testing market growth. Numerous researchers employed genotoxic to assess the effects of drugs against the COVID-19 virus. For instance, in September 2020, a team of researchers evaluated the impact of Chloroquine (CQ) and Hydroxychloroquine (HCQ) as prophylactic drugs against the virus. The genetic toxicology of various drugs and chemicals was assessed. Such studies using genetic toxicology testing as a tool of assessment are anticipated to support stable growth during the peak of COVID-19.
The rising demand for novel food and its imports is expected to be a contributor to market growth. Charles River Laboratories is one of the major players offering toxicology assessments on novel foods. They offer novel food analysis including genotoxicity, which consist of in vivo micronucleus test, Ames study, In Vitro Mammalian Cell Micronucleus, and in the vivo comet assay. Similarly, in January 2021, EFSA published its evaluation of insect-derived food. It is the first kind of assessment conducted by the institution on the insect product as a novel food. Every year, EFSA receives a large number of applications, consisting of herbal products based on algae foods, plants, and non-indigenous fruits.
On the other hand, the ability to retrieve information through genetic toxicology is limited. According to the Pathology Tests Explained organization, genetic tests offer information regarding the specific diseases/gene that is being tested. It does not cover information about other genetic diseases that might be present but have not been tested. Similarly, it cannot identify all the variations of genes that cause the diseases, and also it does not showcase the severity of the diseases. Hence, these limitations are anticipated to hamper the growth of the genetic toxicology industry.
Genetic Toxicology Testing Market Report Highlights:
- By type, the in vitro is expected to be the fastest growing segment with the largest share of the Genetic Toxicology Testing Market in 2021. Owing to the rising requirement by regulatory agencies for genotoxicity in the food industry
- By application, the pharmaceutical & biotechnology segment is estimated to become a major market contributor. This is attributed to an increase in the development of cell and gene therapy, coupled with increasing use of pharmacogenomics and personalized medicines
- The Asia Pacific region is projected to grow substantially over the forecasted period owing to the increasing imports of novel food and tightening test regulations for the same, especially in Australia
- By product, the service segment captured a significant proportion of the share in 2021, owing to the increasing demand by pharmaceutical and biotechnology companies for nonclinical works. Also, increasing strategic initiatives by contract research organizations is a major growth determinant
- North America was a major regional market for genetic toxicology in 2021 owing to the availability of efficient players in the region to match the demand by pharma and biotech companies. The increasing R&D in personalized medicines is also a significant factor
- Some of the main market players include Thermo Fisher Scientific, Inc.; Charles River Laboratories International; Laboratory Corp of America Holdings; and Eurofins Scientific
Table of Contents
Chapter 1 Research Methodology
- 1.1 Market Segmentation & Scope
- 1.1.1 Estimates And Forecast Timeline
- 1.2 Research Methodology
- 1.3 Information Procurement
- 1.3.1 Purchased Database
- 1.3.2 Gvr's Internal Database
- 1.3.3 Secondary Sources
- 1.3.4 Primary Research
- 1.3.5 Details Of Primary Research
- 1.4 Information or Data Analysis
- 1.4.1 Data Analysis Models
- 1.5 Market Formulation & Validation
- 1.6 Model Details
- 1.6.1 Commodity Flow Analysis
- 1.6.1.1 Approach 1: Commodity flow approach
- 1.6.1.2 Approach 2: Country - wise market estimation using a bottom - up approach
- 1.6.1 Commodity Flow Analysis
- 1.7 Global Market: CAGR Calculation
- 1.8 Research Assumptions
- 1.9 List of Secondary Sources
- 1.10 List of Primary Sources
- 1.11 Objectives
- 1.11.1 Objective 1:
- 1.11.2 Objective 2:
- 1.12 List Of Abbreviations
Chapter 2 Market Definitions
Chapter 3 Executive Summary
- 3.1 Market Summary
Chapter 4 Global Genetic Toxicology Testing Market Variables, Trends, & Scope
- 4.1 Genetic Toxicology Testing Market Lineage Outlook
- 4.1.1 Parent Market Outlook
- 4.2 Penetration and Growth Prospect Mapping
- 4.3 Regulatory Framework
- 4.4 Market Driver Analysis
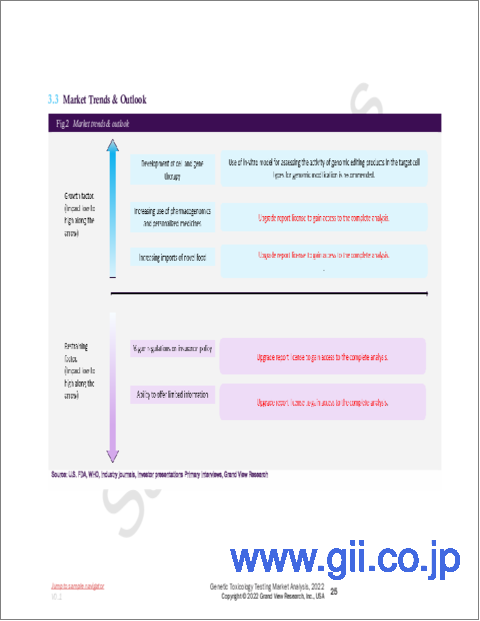
- 4.4.1 Development Of Cell And Gene Therapy
- 4.4.2 Increasing Use Of Pharmacogenomics And Personalized Medicines
- 4.4.3 Increasing Imports Of Novel Food
- 4.5 Market Restraint Analysis
- 4.5.1 Vague Regulations On Insurance Policy
- 4.5.2 Ability To Offer Limited Information
- 4.6 COVID - 19 Impact Analysis
- 4.7 Porter's Five Forces Analysis
- 4.8 SWOT Analysis
Chapter 5 Genetic Toxicology Testing Market - Segment Analysis, by type, 2018 - 2030 (USD Million)
- 5.1 Global Genetic Toxicology Testing Market: Type Movement Analysis
- 5.2 In Vitro
- 5.2.1 In Vitro Market Estimates And Forecast, 2018 - 2030 (USD Million)
- 5.3 In Vivo
- 5.3.1 In Vivo Market Estimates And Forecast, 2018 - 2030 (USD Million)
Chapter 6 Genetic Toxicology Testing Market - Segment Analysis, by Product, 2018 - 2030 (USD Million)
- 6.1 Global Genetic Toxicology Testing Market: Product Movement Analysis
- 6.2 Reagents & Consumables
- 6.2.1 Reagents & Consumables Market Estimates And Forecast, 2018 - 2030 (USD Million)
- 6.3 Assays
- 6.3.1 Assays Market Estimates And Forecast, 2018 - 2030 (USD Million)
- 6.4 Services
- 6.4.1 Services Market Estimates And Forecast, 2018 - 2030 (USD Million)
Chapter 7 Genetic Toxicology Testing Market - Segment Analysis, by Application, 2018 - 2030 (USD Million)
- 7.1 Genetic Toxicology Testing Market: Application Movement Analysis
- 7.2 Pharmaceutical & Biotechnology
- 7.2.1 Pharmaceutical & Biotechnology Market Estimates And Forecast, 2018 - 2030 (USD Million)
- 7.3 Food Industry
- 7.3.1 Food Industry Market Estimates And Forecast, 2018 - 2030 (USD Million)
- 7.4. Cosmetics Industry
- 7.4.1 Cosmetics Industry Market Estimates And Forecast, 2018 - 2030 (USD Million)
- 7.4. Other
- 7.4.1 Other Market Estimates And Forecast, 2018 - 2030 (USD Million)
Chapter 8 Genetic Toxicology Testing Market: - Segment Analysis, by Region, 2018 - 2030 (USD Million)
- 8.1 Genetic Toxicology Testing Market: Regional Movement Analysis
- 8.2 North America
- 8.2.1 North America Market Estimates And Forecast, 2018 - 2030 (USD Million)
- 8.2.2 U.S.
- 8.2.2.1 U.S. Market Estimates And Forecast, 2018 - 2030 (USD Million)
- 8.2.3 Canada
- 8.2.3.1 Canada Market Estimates And Forecast, 2018 - 2030 (USD Million)
- 8.3 Europe
- 8.3.1 Europe Market Estimates And Forecast, 2018 - 2030 (USD Million)
- 8.3.2 U.K.
- 8.3.2.1 U.K. market estimates and forecast, 2018 - 2030 (USD Million)
- 8.3.3. Germany
- 8.3.3.1 Germany Market Estimates And Forecast, 2018 - 2030 (USD Million)
- 8.3.4 Spain
- 8.3.4.1 Spain Market Estimates And Forecast, 2018 - 2030 (USD Million)
- 8.3.5 France
- 8.3.5.1 France Market Estimates And Forecast, 2018 - 2030 (USD Million)
- 8.3.6 Italy
- 8.3.6.1 Italy market estimates and forecast, 2018 - 2030 (USD Million)
- 8.4 Asia Pacific
- 8.4.1 Asia Pacific Market Estimates And Forecast, 2018 - 2030 (USD Million)
- 8.4.2 Japan
- 8.4.2.1 Japan Market Estimates And Forecast, 2018 - 2030 (USD Million)
- 8.4.3 China
- 8.4.3.1 China Market Estimates And Forecast, 2018 - 2030 (USD Million)
- 8.4.4 India
- 8.4.4.1 India Market Estimates And Forecast, 2018 - 2030
- 8.4.5 South Korea
- 8.4.5.1 South Korea market estimates and forecast, 2018 - 2030
- 8.4.6 Australia
- 8.4.6.1 Australia market estimates and forecast, 2018 - 2030
- 8.5 Latin America
- 8.5.1 Latin America Market Estimates And Forecast, 2018 - 2030 (USD Million)
- 8.5.2 Brazil
- 8.5.2.1 Brazil Market Estimates And Forecast, 2018 - 2030 (USD Million)
- 8.5.3 Mexico
- 8.5.3.1 Mexico Market Estimates And Forecast, 2018 - 2030 (USD Million)
- 8.5.4 Argentina
- 8.5.4.1 Argentina market estimates and forecast, 2018 - 2030 (USD Million)
- 8.6 Middle East & Africa (MEA)
- 8.6.1 Middle East & Africa Market Estimates And Forecast, 2018 - 2030 (USD Million)
- 8.6.2 South Africa
- 8.6.2.1 South Africa Market Estimates And Forecast, 2018 - 2030 (USD Million)
- 8.6.3 Saudi Arabia
- 8.6.3.1 Saudi Arabia market estimates and forecast, 2018 - 2030 (USD Million)
- 8.6.4 UAE
- 8.6.4.1 UAE market estimates and forecast, 2018 - 2030 (USD Million)
Chapter 9 Competitive Landscape
- 9.1 Public Companies
- 9.1.1 Company Market Position Analysis
- 9.1.2 Competitive Dashboard Analysis
- 9.1.3 Strategic Framework
- 9.2 Private Companies
- 9.2.1 List Of Key Emerging Companies/Technology Disruptors/Innovators
- 9.2.2 Regional Network Map
- 9.4 Company Profiles
- 9.4.1 Thermo Fisher Scientific, Inc
- 9.4.1.1 Company Overview
- 9.4.1.2 Financial Performance
- 9.4.1.3 Product Benchmarking
- 9.4.1.4 Strategic Initiatives
- 9.4.2 CHARLES RIVER LABORATORIES INTERNATIONAL
- 9.4.2.1 Company Overview
- 9.4.2.2 Financial Performance
- 9.4.2.3 Product Benchmarking
- 9.4.2.4 Strategic Initiatives
- 9.4.3 Laboratory Corp of America Holdings
- 9.4.3.1 Company Overview
- 9.4.3.2 Financial Performance
- 9.4.3.3 Product Benchmarking
- 9.4.3.4 Strategic Initiatives
- 9.4.4 EUROFINS SCIENTIFIC
- 9.4.4.1 Company Overview
- 9.4.4.2 Financial Performance
- 9.4.4.3 Product Benchmarking
- 9.4.4.4 Strategic Initiatives
- 9.4.5 JUBILANT LIFE SCIENCES LIMITED
- 9.4.5.1 Company Overview
- 9.4.5.2 Financial Performance
- 9.4.5.3 Product Benchmarking
- 9.4.5.4 Strategic Initiatives
- 9.4.6 SYNGENE INTERNATIONAL LIMITED
- 9.4.6.1 Company Overview
- 9.4.6.2 Financial Performance
- 9.4.6.3 Product Benchmarking
- 9.4.6.4 Strategic Initiatives
- 9.4.7 GENTRONIX LTD.
- 9.4.7.1 Company Overview
- 9.4.7.2 Financial Performance
- 9.4.7.3 Product Benchmarking
- 9.4.7.4 Strategic Initiatives
- 9.4.8 INOTIV INC.
- 9.4.8.1 Company Overview
- 9.4.8.2 Financial Performance
- 9.4.8.3 Product Benchmarking
- 9.4.8.4 Strategic Initiatives
- 9.4.9 CREATIVE BIOARRAY
- 9.4.9.1 Company Overview
- 9.4.9.2 Financial Performance
- 9.4.9.3 Product Benchmarking
- 9.4.9.4 Strategic Initiatives
- 9.4.10 MB RESEARCH LABORATORIES
- 9.4.10.1 Company Overview
- 9.4.10.2 Financial Performance
- 9.4.10.3 Product Benchmarking
- 9.4.10.4 Strategic Initiatives
- 9.4.1 Thermo Fisher Scientific, Inc