|
|
市場調査レポート
商品コード
1133278
光学フィルム市場規模・シェア・動向分析レポートアプリケーション別(車載ディスプレイ、スマートフォン)、フィルムタイプ別(偏光フィルム、バックライトフィルム)、地域別、セグメント別予測2022年~2030年Optical Film Market Size, Share & Trends Analysis Report By Application (Automotive Display, Smartphones), By Film Type (Polarizing, Backlight Films), By Region, And Segment Forecasts 2022 - 2030 |
||||||
|
|
|||||||
|
● お客様のご希望に応じて、既存データの加工や未掲載情報(例:国別セグメント)の追加などの対応が可能です。 詳細はお問い合わせください。 |
|||||||


| 光学フィルム市場規模・シェア・動向分析レポートアプリケーション別(車載ディスプレイ、スマートフォン)、フィルムタイプ別(偏光フィルム、バックライトフィルム)、地域別、セグメント別予測2022年~2030年 |
|
出版日: 2022年09月09日
発行: Grand View Research
ページ情報: 英文 70 Pages
納期: 2~10営業日
|
- 全表示
- 概要
- 図表
- 目次
光学フィルム市場の成長と動向
Grand View Research, Inc.の新しいレポートによると、光学フィルムの世界市場規模は2030年までに483億5000万米ドルに達すると予測され、予測期間中にCAGR 8.7%で成長しています。民生用電子機器の需要増が、予測期間中に業界を大きく牽引すると予想されます。自動車のインストルメントパネルやディスプレイを照らすための視認性の向上、最適な輝度、低消費電力に対する要求の高まりは、自動車ディスプレイ用途の光学フィルムに有利な機会を生み出しています。さらに、光の制御と増強、輝度の向上、コントラストの改善、太陽光への耐久性などの特性が、さまざまな用途で製品の需要を促進しています。
これらの用途には、車載ディスプレイ、テレビ、デスクトップおよびラップトップ、スマートフォン、タブレット、サイネージおよび広告用ディスプレイボードが含まれます。また、デジタル・広告用ディスプレイボードの商業分野での採用拡大、新興国を中心としたインフラ整備の進展、ディスプレイ製品の技術的進歩が、サイネージ・広告用ディスプレイボードの製品需要を創出すると予測されています。アジア太平洋地域は、予測期間中に最も速いCAGRで進行すると予想されます。車載ディスプレイ、テレビ、デスクトップ&ラップトップ、スマートフォン、タブレット、サイネージ&広告用ディスプレイボードなどの用途で製品需要が高まっていることから、2021年のAPAC地域市場は中国がリードしています。
また、台湾、中国、韓国では家電製品の製造拠点が確立されており、同地域の成長にさらなる弾みをつけると予想されます。しかし、インド、中国、日本などでCOVID-19が発生し、看板や広告用ディスプレイボード、スマートフォンなどの製品需要に影響を与えています。最終消費者の需要減退、全国または一部の都市の落ち込み、パンデミックの影響による製造活動の鈍化が、短期的にこの地域の成長をさらに妨げています。
光学フィルム市場レポートハイライト
収益面では、2021年に偏光フィルムセグメントが最大シェアを占めました。同セグメントは予測期間中、安定したCAGRでさらに成長すると予想される
スマートフォンアプリケーションセグメントは、2021年に大きな収益シェアを占め、予測期間中も業界での地位を維持します。
中間層の増加、支出の優先順位の変化、より自由度の高い支出への消費パターンの変化が、同分野の成長を促進しています。
アジア太平洋地域は世界の産業をリードし、2021年の全体収益で最大のシェアを占めています。
家電メーカーの強力な製造拠点と複数の最終用途産業の存在が、予測期間中の製品需要を促進すると予想される
目次
第1章 調査手法と範囲
- 調査手法
- 調査範囲と想定
- 情報調達
- 購入したデータベース
- GVRの内部データベース
- 二次情報と第三者の視点
- 1次調査
- 情報分析
- データ分析モデル
- 市場形成とデータ可視化
- データの検証と公開
- 略語一覧
第2章 エグゼクティブサマリー
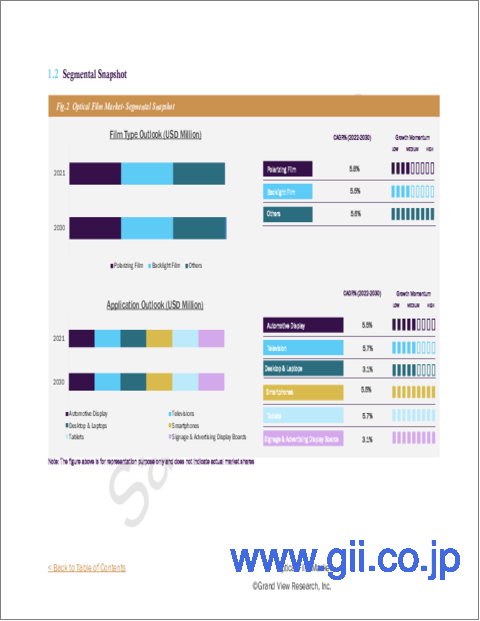
- 光学フィルム:市場スナップショット
- セグメント別見通し
第3章 市場変数、動向、および範囲
- 市場系列の見通し
- 浸透と成長の見通しのマッピング
- 業界バリューチェーン分析
- 原材料の動向
- 規制の枠組み
- 標準とコンプライアンス
- 安全性
- 市場力学
- 市場促進要因分析
- 市場抑制要因分析
- 事業環境分析光学フィルム市場
- 業界分析- ポーターズ
- サプライヤーの力
- 買い手の交渉力
- 代替の脅威
- 新規参入者からの脅威
- 競争企業間の敵対関係
- PESTEL分析
- 政治情勢
- 環境情勢
- 社会情勢
- テクノロジー情勢
- 経済情勢
- 法的情勢
- 主要取引と戦略的提携分析
- 合弁事業
- 合併と買収
- ライセンシングとパートナーシップ
- 技術提携
- 業界分析- ポーターズ
第4章 光学フィルム市場:タイプの推定・動向分析
- タイプの変動分析と市場シェア、2022年と2030年
- 偏光フィルム
- バックライトフィルム
- その他
第5章 光学フィルム市場:アプリケーションの推定・動向分析
- アプリケーションの変動分析と市場シェア、2022年と2030年
- 車載ディスプレイ
- テレビ
- デスクトップとラップトップ
- スマートフォン
- 錠剤
- サイネージ &広告ディスプレイボード
第6章 光学フィルム市場:地域推定・動向分析
- 2022年と2030年の地域変動分析と市場シェア
- 北米
- 米国
- カナダ
- メキシコ
- 欧州
- ドイツ
- 英国
- フランス
- イタリア
- アジア太平洋地域
- 中国
- インド
- 日本
- 中南米
- ブラジル
- 中東とアフリカ
- GCC諸国
第7章 競合情勢
- 主要な世界企業と最近の開発と業界への影響
- 主要企業/競合の分類(主要なイノベーター、市場リーダー、新興企業)
- ベンダー情勢
- 主要なディストリビューターとチャネルパートナーのリスト
- Key Potential Customers
- 公開会社
- 会社の市況分析
- 非公開会社
- 主要な新興企業/テクノロジーディスラプター/イノベーターのリストとその地理的プレゼンス
第8章 企業プロファイル
- Toray Industries Inc.
- 会社概要
- 財務実績
- 製品のベンチマーク
- 戦略的イニシアチブ
- 3M
- 会社概要
- 財務実績
- 製品のベンチマーク
- 戦略的イニシアチブ
- Nitto Denko Corporation
- 会社概要
- 財務実績
- 製品のベンチマーク
- Mitsubishi Chemical Corporation
- 会社概要
- 財務実績
- 製品のベンチマーク
- 戦略的イニシアチブ
- Teijin Limited
- 会社概要
- 財務実績
- 製品のベンチマーク
- 戦略的イニシアチブ
- Kolon Industries, Inc
- 会社概要
- 財務実績
- 製品のベンチマーク
- 戦略的イニシアチブ
- LG Chem, Ltd
- 会社概要
- 財務実績
- 製品のベンチマーク
- 戦略的イニシアチブ
- Hyosung Chemical
- 会社概要
- 財務実績
- 製品のベンチマーク
- 戦略的イニシアチブ
- Toyobo Co. Ltd.
- 会社概要
- 財務実績
- 製品のベンチマーク
- 戦略的イニシアチブ
- Sumitomo Chemical
- 会社概要
- 財務実績
- 製品のベンチマーク
- 戦略的イニシアチブ
List of Tables
- 1. List of Abbreviations
- 2. Optical film market estimates and forecasts, by polarizing film, 2019 - 2030 (Thousand Square Meter) (USD Million)
- 3. Optical film market estimates and forecasts, by backlight film, 2019 - 2030 (Thousand Square Meter) (USD Million)
- 4. Optical film market estimates and forecasts, by others, 2019 - 2030 (Thousand Square Meter) (USD Million)
- 5. Optical film market estimates and forecasts, in automotive display, 2019 - 2030 (Thousand Square Meter) (USD Million)
- 6. Optical film market estimates and forecasts, in television, 2019 - 2030 (Thousand Square Meter) (USD Million)
- 7. Optical film market estimates and forecasts, in desktop & laptops, 2019 - 2030 (Thousand Square Meter) (USD Million)
- 8. Optical film market estimates and forecasts, in smartphones, 2019 - 2030 (Thousand Square Meter) (USD Million)
- 9. Optical film market estimates and forecasts, in tablets, 2019 - 2030 (Thousand Square Meter) (USD Million)
- 10. Optical film market estimates and forecasts, in signage & advertising display boards, 2019 - 2030 (Thousand Square Meter) (USD Million)
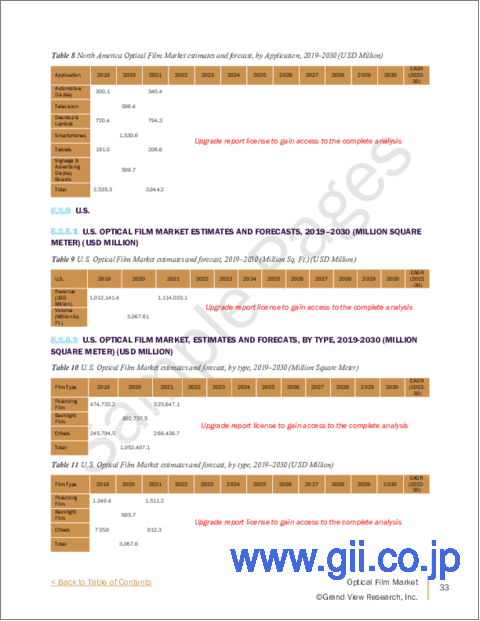
- 11. North America optical film market volume estimates and forecasts, 2019 - 2030 (Thousand Square Meter) (USD Million)
- 12. North America optical film market volume estimates and forecasts, by film type, 2019 - 2030 (Thousand Square Meter) (USD Million)
- 13. North America optical film market volume estimates and forecasts, by application, 2019 - 2030 (Thousand Square Meter) (USD Million)
- 14. U.S. optical film market estimates and forecasts, 2019 - 2030 (Thousand Square Meter) (USD Million)
- 15. U.S. optical film market volume estimates and forecasts, by film type, 2019 - 2030 (Thousand Square Meter) (USD Million)
- 16. U.S. optical film market volume estimates and forecasts, by application, 2019 - 2030 (Thousand Square Meter) (USD Million)
- 17. Canada optical film market estimates and forecasts, 2019 - 2030 (Thousand Square Meter) (USD Million)
- 18. Canada optical film market volume estimates and forecasts, by film type, 2019 - 2030 (Thousand Square Meter) (USD Million)
- 19. Canada optical film market volume estimates and forecasts, by application, 2019 - 2030 (Thousand Square Meter) (USD Million)
- 20. Mexico optical film market estimates and forecasts, 2019 - 2030 (Thousand Square Meter) (USD Million)
- 21. Mexico optical film market volume estimates and forecasts, by film type, 2019 - 2030 (Thousand Square Meter) (USD Million)
- 22. Mexico optical film market volume estimates and forecasts, by application, 2019 - 2030 (Thousand Square Meter) (USD Million)
- 23. Europe optical film market volume estimates and forecasts, 2019 - 2030 (Thousand Square Meter) (USD Million)
- 24. Europe optical film market volume estimates and forecasts, by film type, 2019 - 2030 (Thousand Square Meter) (USD Million)
- 25. Europe optical film market volume estimates and forecasts, by application, 2019 - 2030 (Thousand Square Meter) (USD Million)
- 26. Germany optical film market estimates and forecasts, 2019 - 2030 (Thousand Square Meter) (USD Million)
- 27. Germany optical film market volume estimates and forecasts, by film type, 2019 - 2030 (Thousand Square Meter) (USD Million)
- 28. Germany optical film market volume estimates and forecasts, by application, 2019 - 2030 (Thousand Square Meter) (USD Million)
- 29. U.K. optical film market estimates and forecasts, 2019 - 2030 (Thousand Square Meter) (USD Million)
- 30. U.K. optical film market volume estimates and forecasts, by film type, 2019 - 2030 (Thousand Square Meter) (USD Million)
- 31. U.K. optical film market volume estimates and forecasts, by application, 2019 - 2030 (Thousand Square Meter) (USD Million)
- 32. France optical film market estimates and forecasts, 2019 - 2030 (Thousand Square Meter) (USD Million)
- 33. France optical film market volume estimates and forecasts, by film type, 2019 - 2030 (Thousand Square Meter) (USD Million)
- 34. France optical film market volume estimates and forecasts, by application, 2019 - 2030 (Thousand Square Meter) (USD Million)
- 35. Italy optical film market estimates and forecasts, 2019 - 2030 (Thousand Square Meter) (USD Million)
- 36. Italy optical film market volume estimates and forecasts, by film type, 2019 - 2030 (Thousand Square Meter) (USD Million)
- 37. Italy optical film market volume estimates and forecasts, by application, 2019 - 2030 (Thousand Square Meter) (USD Million)
- 38. Asia Pacific optical film market volume estimates and forecasts, 2019 - 2030 (Thousand Square Meter) (USD Million)
- 39. Asia Pacific optical film market volume estimates and forecasts, by film type, 2019 - 2030 (Thousand Square Meter) (USD Million)
- 40. Asia Pacific optical film market volume estimates and forecasts, by application, 2019 - 2030 (Thousand Square Meter) (USD Million)
- 41. China optical film market estimates and forecasts, 2019 - 2030 (Thousand Square Meter) (USD Million)
- 42. China optical film market volume estimates and forecasts, by film type, 2019 - 2030 (Thousand Square Meter) (USD Million)
- 43. China optical film market volume estimates and forecasts, by application, 2019 - 2030 (Thousand Square Meter) (USD Million)
- 44. India optical film market estimates and forecasts, 2019 - 2030 (Thousand Square Meter) (USD Million)
- 45. India optical film market volume estimates and forecasts, by film type, 2019 - 2030 (Thousand Square Meter) (USD Million)
- 46. India optical film market volume estimates and forecasts, by application, 2019 - 2030 (Thousand Square Meter) (USD Million)
- 47. Japan optical film market estimates and forecasts, 2019 - 2030 (Thousand Square Meter) (USD Million)
- 48. Japan optical film market volume estimates and forecasts, by film type, 2019 - 2030 (Thousand Square Meter) (USD Million)
- 49. Japan optical film market volume estimates and forecasts, by application, 2019 - 2030 (Thousand Square Meter) (USD Million)
- 50. Central & South America optical film market volume estimates and forecasts, 2019 - 2030 (Thousand Square Meter) (USD Million)
- 51. Central & South America market volume estimates and forecasts, by film type, 2019 - 2030 (Thousand Square Meter) (USD Million)
- 52. Central & South America market volume estimates and forecasts, by application, 2019 - 2030 (Thousand Square Meter) (USD Million)
- 53. Brazil optical film market estimates and forecasts, 2019 - 2030 (Thousand Square Meter) (USD Million)
- 54. Brazil optical film market volume estimates and forecasts, by film type, 2019 - 2030 (Thousand Square Meter) (USD Million)
- 55. Brazil optical film market volume estimates and forecasts, by application, 2019 - 2030 (Thousand Square Meter) (USD Million)
- 56. Middle East & Africa optical film market volume estimates and forecasts, 2019 - 2030 (Thousand Square Meter) (USD Million)
- 57. Middle East & Africa market volume estimates and forecasts, by film type, 2019 - 2030 (Thousand Square Meter) (USD Million)
- 58. Middle East & Africa market volume estimates and forecasts, by application, 2019 - 2030 (Thousand Square Meter) (USD Million)
- 59. GCC Countries optical film market estimates and forecasts, 2019 - 2030 (Thousand Square Meter) (USD Million)
- 60. GCC Countries optical film market volume estimates and forecasts, by film type, 2019 - 2030 (Thousand Square Meter) (USD Million)
- 61. GCC Countries optical film market volume estimates and forecasts, by application, 2019 - 2030 (Thousand Square Meter) (USD Million)
List of Figures
- 1. Information procurement
- 2. Primary research pattern
- 3. Primary Research Process
- 4. Market research approaches - Bottom-Up Approach
- 5. Market research approaches - Top-Down Approach
- 6. Market research approaches - Combined Approach
- 7. Optical film market snapshot
- 8. Optical film market segmentation
- 9. Optical film market -value chain analysis
- 10. Porters Five Forces Analysis: Optical film market
- 11. PESTEL Analysis: Optical film market
- 12. Film type movement analysis & market share, 2019 & 2027
- 13. Application movement analysis & market share, 2019 & 2027
- 14. Regional movement analysis & market share, 2019 & 2027
Optical Film Market Growth & Trends:
The global optical film market size is anticipated to reach USD 48.35 billion by 2030, according to a new report by Grand View Research, Inc., growing at a CAGR of 8.7% over the forecast period. Increasing demand for consumer electronics devices is expected to significantly drive the industry during the forecast period. Increasing demand for better visibility, optimum brightness, and lower power consumption for illuminating automotive instrument panels and displays is creating lucrative opportunities for optical film in automotive display applications. In addition, properties, such aslight control & enhancement, increased brightness, improved contrast, better sunlight durability, and others, are propelling the product demand in various applications.
These applications include automotive displays, televisions, desktops & laptops, smartphones, tablets, signage & advertising display boards. Moreover, the rising adoption of digital & advertising display boards in commercial verticals, increasing infrastructural development, especially in emerging countries,and technological advancement in display products are projected to create product demand in signage & advertising display boards. Asia Pacific is anticipated to progress at the fastest CAGR over the forecast period. China led the APAC regional market in 2021 owing to the rising demand for the product in applications including automotive display, televisions, desktops & laptops, smartphones, tablets, signage & advertising display boards.
In addition, a well-established manufacturing base for consumer electronics in Taiwan, China, and South Korea is anticipated to provide further impetus to the region's growth. However, the recent outbreak of COVID-19 in countries, such as India, China, and Japan,is impacting the product demand in signage & advertising display boards, smartphones, and otherapplications.Declining demand from end-use consumers, nationwide or partial city lowdown, and a slowdown in manufacturing activities as a result of the pandemic further hampered the region's growth in the short term.
Optical Film Market Report Highlights:
- In terms of revenue, the polarizing film segment accounted for the maximum share in 2021. The segment is expected to grow further at a steady CAGRover the forecast period
- The smartphones application segment accounted for a significant revenue share in 2021 and will retain its industry position throughout the forecast period
- The rising middle-class population, shifting spending priorities, and changing consumption patterns towards more discretionary spending are driving the segment growth
- The Asia Pacific region led the global industry and accounted for the largest share of the overall revenue in 2021
- Strong manufacturing bases of consumer electronics companies and the presence of several end-use industries in the region are anticipated to fuel the product demand over the forecast period
Table of Contents
Chapter 1. Methodology and Scope
- 1.1. Research Methodology
- 1.2. Research Scope and Assumption
- 1.3. Information Procurement
- 1.3.1. Purchased Database
- 1.3.2. GVR's Internal Database
- 1.3.3. Secondary Sources & Third-Party Perspectives
- 1.3.4. Primary Research
- 1.4. Information Analysis
- 1.4.1. Data Analysis Models
- 1.5. Market Formulation & Data Visualization
- 1.6. Data Validation and Publishing
- 1.7. List of Abbreviations
Chapter 2. Executive Summary
- 2.1. Optical Film: Market Snapshot
- 2.2. Segmental Outlook
Chapter 3. Market Variables, Trends, and Scope
- 3.1. Market Lineage Outlook
- 3.2. Penetration & Growth Prospect Mapping
- 3.3. Industry Value Chain Analysis
- 3.3.1. Raw Material Trends
- 3.4. Regulatory Framework
- 3.4.1. Standard & Compliances
- 3.4.2. Safety
- 3.5. Market Dynamics
- 3.5.1. Market Driver Analysis
- 3.5.2. Market Restraint Analysis
- 3.6. Business Environment Analysis Optical Film Market
- 3.6.1. Industry Analysis - Porter's
- 3.6.1.1. Supplier Power
- 3.6.1.2. Buyer Power
- 3.6.1.3. Substitution Threat
- 3.6.1.4. Threat from New Entrant
- 3.6.1.5. Competitive Rivalry
- 3.6.2. PESTEL Analysis
- 3.6.2.1. Political Landscape
- 3.6.2.2. Environmental Landscape
- 3.6.2.3. Social Landscape
- 3.6.2.4. Technology Landscape
- 3.6.2.5. Economic Landscape
- 3.6.2.6. Legal Landscape
- 3.6.3. Major Deals & Strategic Alliances Analysis
- 3.6.3.1. Joint ventures
- 3.6.3.2. Mergers & acquisitions
- 3.6.3.3. Licensing & partnership
- 3.6.3.4. Technology collaborations
- 3.6.1. Industry Analysis - Porter's
Chapter 4. Optical Film Market: Type Estimates & Trend Analysis
- 4.1. Type movement analysis & market share, 2022 & 2030
- 4.2. Polarizing Film
- 4.2.1. Optical film market estimates and forecasts, by polarizing film, 2019 - 2030 (Thousand Square Meter) (USD Million)
- 4.3. Backlight Film
- 4.3.1. Optical film market estimates and forecasts, by backlight film, 2019 - 2030 (Thousand Square Meter) (USD Million)
- 4.4. Others
- 4.4.1. Optical film market estimates and forecasts, by others, 2019 - 2030 (Thousand Square Meter) (USD Million)
Chapter 5. Optical Film Market: Application Estimates & Trend Analysis
- 5.1. Application movement analysis & market share, 2022 & 2030
- 5.2. Automotive Display
- 5.2.1. Optical film market estimates and forecasts, in automotive display, 2019 - 2030 (Thousand Square Meter) (USD Million)
- 5.3. Televisions
- 5.3.1. Optical film market estimates and forecasts, in televisions, 2019 - 2030 (Thousand Square Meter) (USD Million)
- 5.4. Desktop & Laptops
- 5.4.1. Optical film market estimates and forecasts, in desktop & laptops, 2019 - 2030 (Thousand Square Meter) (USD Million)
- 5.5. Smartphones
- 5.5.1. Optical film market estimates and forecasts, in smartphones, 2019 - 2030 (Thousand Square Meter) (USD Million)
- 5.6. Tablets
- 5.6.1. Optical film market estimates and forecasts, in tablets, 2019 - 2030 (Thousand Square Meter) (USD Million)
- 5.7. Signage & Advertising Display Boards
- 5.7.1. Optical film market estimates and forecasts, in signage & advertising display boards, 2019 - 2030 (Thousand Square Meter) (USD Million)
Chapter 6. Optical Film Market: Regional Estimates & Trend Analysis
- 6.1. Regional movement analysis & market share, 2022 & 2030
- 6.2. North America
- 6.2.1. North America optical film market estimates and forecasts, 2019 - 2030 (Thousand Square Meter) (USD Million)
- 6.2.2. North America optical film market estimates and forecasts, by film type, 2019 - 2030 (Thousand Square Meter) (USD Million)
- 6.2.3. North America optical film market estimates and forecasts, by application, 2019 - 2030 (Thousand Square Meter) (USD Million)
- 6.2.4. U.S.
- 6.2.4.1. U.S. optical film market estimates and forecasts, 2019 - 2030 (Thousand Square Meter) (USD Million)
- 6.2.4.2. U.S. optical film market estimates and forecasts, by film type, 2019 - 2030 (Thousand Square Meter) (USD Million)
- 6.2.4.3. U.S. optical film market estimates and forecasts, by application, 2019 - 2030 (Thousand Square Meter) (USD Million)
- 6.2.5. Canada
- 6.2.5.1. Canada optical film market estimates and forecasts, 2019 - 2030 (Thousand Square Meter) (USD Million)
- 6.2.5.2. Canada optical film market estimates and forecasts, by film type, 2019 - 2030 (Thousand Square Meter) (USD Million)
- 6.2.5.3. Canada optical film market estimates and forecasts, by application, 2019 - 2030 (Thousand Square Meter) (USD Million)
- 6.2.6. Mexico
- 6.2.6.1. Mexico optical film market estimates and forecasts, 2019 - 2030 (Thousand Square Meter) (USD Million)
- 6.2.6.2. Mexico optical film market estimates and forecasts, by film type, 2019 - 2030 (Thousand Square Meter) (USD Million)
- 6.2.6.3. Mexico optical film market estimates and forecasts, by application, 2019 - 2030 (Thousand Square Meter) (USD Million)
- 6.3. Europe
- 6.3.1. Europe optical film market estimates and forecasts, 2019 - 2030 (Thousand Square Meter) (USD Million)
- 6.3.2. Europe optical film market estimates and forecasts, by film type, 2019 - 2030 (Thousand Square Meter) (USD Million)
- 6.3.3. Europe optical film market estimates and forecasts, by application, 2019 - 2030 (Thousand Square Meter) (USD Million)
- 6.3.4. Germany
- 6.3.4.1. Germany optical film market estimates and forecasts, 2019 - 2030 (Thousand Square Meter) (USD Million)
- 6.3.4.2. Germany optical film market estimates and forecasts, by film type, 2019 - 2030 (Thousand Square Meter) (USD Million)
- 6.3.4.3. Germany optical film market estimates and forecasts, by application, 2019 - 2030 (Thousand Square Meter) (USD Million)
- 6.3.5. U.K.
- 6.3.5.1. U.K. optical film market estimates and forecasts, 2019 - 2030 (Thousand Square Meter) (USD Million)
- 6.3.5.2. U.K. optical film market estimates and forecasts, by film type, 2019 - 2030 (Thousand Square Meter) (USD Million)
- 6.3.5.3. U.K. optical film market estimates and forecasts, by application, 2019 - 2030 (Thousand Square Meter) (USD Million)
- 6.3.6. France
- 6.3.6.1. France optical film market estimates and forecasts, 2019 - 2030 (Thousand Square Meter) (USD Million)
- 6.3.6.2. France optical film market estimates and forecasts, by film type, 2019 - 2030 (Thousand Square Meter) (USD Million)
- 6.3.6.3. France optical film market estimates and forecasts, by application, 2019 - 2030 (Thousand Square Meter) (USD Million)
- 6.3.7. Italy
- 6.3.7.1. Italy optical film market estimates and forecasts, 2019 - 2030 (Thousand Square Meter) (USD Million)
- 6.3.7.2. Italy optical film market estimates and forecasts, by film type, 2019 - 2030 (Thousand Square Meter) (USD Million)
- 6.3.7.3. Italy optical film market estimates and forecasts, by application, 2019 - 2030 (Thousand Square Meter) (USD Million)
- 6.4. Asia Pacific
- 6.4.1. Asia Pacific optical film market estimates and forecasts, 2019 - 2030 (Thousand Square Meter) (USD Million)
- 6.4.2. Asia Pacific optical film market estimates and forecasts, by film type, 2019 - 2030 (Thousand Square Meter) (USD Million)
- 6.4.3. Asia Pacific optical film market estimates and forecasts, by application, 2019 - 2030 (Thousand Square Meter) (USD Million)
- 6.4.4. China
- 6.4.4.1. China optical film market estimates and forecasts, 2019 - 2030 (Thousand Square Meter) (USD Million)
- 6.4.4.2. China optical film market estimates and forecasts, by film type, 2019 - 2030 (Thousand Square Meter) (USD Million)
- 6.4.4.3. China optical film market estimates and forecasts, by application, 2019 - 2030 (Thousand Square Meter) (USD Million)
- 6.4.5. India
- 6.4.5.1. India optical film market estimates and forecasts, 2019 - 2030 (Thousand Square Meter) (USD Million)
- 6.4.5.2. India optical film market estimates and forecasts, by film type, 2019 - 2030 (Thousand Square Meter) (USD Million)
- 6.4.5.3. India optical film market estimates and forecasts, by application, 2019 - 2030 (Thousand Square Meter) (USD Million)
- 6.4.6. Japan
- 6.4.6.1. Japan optical film market estimates and forecasts, 2019 - 2030 (Thousand Square Meter) (USD Million)
- 6.4.6.2. Japan optical film market estimates and forecasts, by film type, 2019 - 2030 (Thousand Square Meter) (USD Million)
- 6.4.6.3. Japan optical film market estimates and forecasts, by application, 2019 - 2030 (Thousand Square Meter) (USD Million)
- 6.5. Central & South America
- 6.5.1. Central & South America optical film market estimates and forecasts, 2019 - 2030 (Thousand Square Meter) (USD Million)
- 6.5.2. Central & South America optical film market estimates and forecasts, by film type, 2019 - 2030 (Thousand Square Meter) (USD Million)
- 6.5.3. Central & South America optical film market estimates and forecasts, by application, 2019 - 2030 (Thousand Square Meter) (USD Million)
- 6.5.4. Brazil
- 6.5.4.1. Brazil optical film market estimates and forecasts, 2019 - 2030 (Thousand Square Meter) (USD Million)
- 6.5.4.2. Brazil optical film market estimates and forecasts, by film type, 2019 - 2030 (Thousand Square Meter) (USD Million)
- 6.5.4.3. Brazil optical film market estimates and forecasts, by application, 2019 - 2030 (Thousand Square Meter) (USD Million)
- 6.6. Middle East & Africa
- 6.6.1. Middle East & Africa optical film market estimates and forecasts, 2019 - 2030 (Thousand Square Meter) (USD Million)
- 6.6.2. Middle East & Africa optical film market estimates and forecasts, by film type, 2019 - 2030 (Thousand Square Meter) (USD Million)
- 6.6.3. Middle East & Africa optical film market estimates and forecasts, by application, 2019 - 2030 (Thousand Square Meter) (USD Million)
- 6.6.4. GCC Countries
- 6.6.4.1. GCC Countries optical film market estimates and forecasts, 2019 - 2030 (Thousand Square Meter) (USD Million)
- 6.6.4.2. GCC Countries optical film market estimates and forecasts, by film type, 2019 - 2030 (Thousand Square Meter) (USD Million)
- 6.6.4.3. GCC Countries optical film market estimates and forecasts, by application, 2019 - 2030 (Thousand Square Meter) (USD Million)
Chapter 7. Competitive Landscape
- 7.1. Key Global Players & Recent Developments & Their Impact on The Industry
- 7.2. Key Company/Competition Categorization (Key innovators, Market leaders, Emerging players)
- 7.3. Vendor Landscape
- 7.3.1. List of key Distributors and Channel Partners
- 7.3.2. Key Potential Customers
- 7.4. Public Companies
- 7.4.1. Company Market Position Analysis
- 7.5. Private Companies
- 7.5.1. List of Key Emerging Companies/Technology Disruptors/Innovators and Their Geographical Presence
Chapter 8. Company Profiles
- 8.1. Toray Industries Inc.
- 8.1.1. Company Overview
- 8.1.2. Financial Performance
- 8.1.3. Product Benchmarking
- 8.1.4. Strategic Initiatives
- 8.2. 3M
- 8.2.1. Company Overview
- 8.2.2. Financial Performance
- 8.2.3. Product Benchmarking
- 8.2.4. Strategic Initiatives
- 8.3. Nitto Denko Corporation
- 8.3.1. Company Overview
- 8.3.2. Financial Performance
- 8.3.3. Product Benchmarking
- 8.4. Mitsubishi Chemical Corporation
- 8.4.1. Company Overview
- 8.4.2. Financial Performance
- 8.4.3. Product Benchmarking
- 8.4.4. Strategic Initiatives
- 8.5. Teijin Limited
- 8.5.1. Company Overview
- 8.5.2. Financial Performance
- 8.5.3. Product Benchmarking
- 8.5.4. Strategic Initiatives
- 8.6. Kolon Industries, Inc
- 8.6.1. Company Overview
- 8.6.2. Financial Performance
- 8.6.3. Product Benchmarking
- 8.6.4. Strategic Initiatives
- 8.7. LG Chem, Ltd
- 8.7.1. Company Overview
- 8.7.2. Financial Performance
- 8.7.3. Product Benchmarking
- 8.7.4. Strategic Initiatives
- 8.8. Hyosung Chemical
- 8.8.1. Company Overview
- 8.8.2. Financial Performance
- 8.8.3. Product Benchmarking
- 8.8.4. Strategic Initiatives
- 8.9. Toyobo Co. Ltd.
- 8.9.1. Company Overview
- 8.9.2. Financial Performance
- 8.9.3. Product Benchmarking
- 8.9.4. Strategic Initiatives
- 8.10. Sumitomo Chemical
- 8.10.1. Company Overview
- 8.10.2. Financial Performance
- 8.10.3. Product Benchmarking
- 8.10.4. Strategic Initiatives