|
|
市場調査レポート
商品コード
1588375
ペットシッター市場規模、シェア、動向分析レポート:ペットタイプ別、サービスタイプ別、地域別、セグメント予測、2025年~2030年Pet Sitting Market Size, Share & Trends Analysis Report By Pet Type (Dogs, Cats), By Service Type (Care Visits, Drop-in Visits), By Region, And Segment Forecasts, 2025 - 2030 |
||||||

|
|||||||
カスタマイズ可能
|
|||||||

| ペットシッター市場規模、シェア、動向分析レポート:ペットタイプ別、サービスタイプ別、地域別、セグメント予測、2025年~2030年 |
|
出版日: 2024年10月16日
発行: Grand View Research
ページ情報: 英文 130 Pages
納期: 2~10営業日
|

全表示
- 概要
- 図表
- 目次
ペットシッター市場の成長と動向
Grand View Research, Inc.の最新レポートによると、世界のペットシッター市場規模は2030年までに51億4,000万米ドルに達すると予測され、2025~2030年のCAGRは11.8%で成長すると予測されています。
市場成長を促進する主要要因には、サブスクリプションベースのペットサービスの採用増加、ペットサービス提供の拡大、ペットへの支出増加などがあります。若年層によるペット飼育の増加やペットの人間化の動向により、ペット飼育率は着実に上昇しています。さらに、可処分所得の増加により顧客の購買力が高まり、ペットの健康により多くの費用をかけられるようになっています。このような要因により、ペットサービスのニーズが高まり、ボーディング、グルーミング、ペットシッター、写真撮影など、新たなペットサービス業者の市場参入が促されています。テキサス・ホテル&ロッジング協会が発表した2023年5月のデータによると、国内のホテルの75%がペット可で、ペット向けのサービスだけでなく宿泊ケアも提供しています。また、アメリカのペットオーナーの約78%がペットと一緒に旅行していると推定されています。
COVID-19の大流行により、販売やマーケティング活動の減少、ペットサービスの制限など多くの課題が生じた。また、興味深いことに、パンデミック時にはペットの飼育が増加し、人々が家の中に閉じこもるようになったため、交友関係や精神的サポートの必要性が高まった。2023年12月、米国ペット用品協会(APPA)によると、パンデミック中にペットを飼い始めたのは、それまでペットを飼っていた人の48%でした。米国では、2009~2019年にかけてペットの飼育数は4.7%増加すると推定され、パンデミックによってこの増加率は9.8%に加速しました。
ペットケア産業内での協力やパートナーシップの重視とともに、個別化され、技術的に統合され、安全で、環境的に持続可能で、ニッチに特化したペットシッターサービスに対する需要の高まりにより、市場は今後数年間で着実に増加すると予想されます。ペットシッターは、フランスで119以上のハウスシッターをリストアップしているTrustedHousesittersや、フランスで2,247のペットシッターを誇るPetBackerのようなプラットフォームの存在により、フランスのような国で成長しているセグメントです。TrustedHousesittersはハウスシッターとペットシッターのサービスを提供しており、シッターと家主のマッチングを中心に、ペットの世話と引き換えに無料で宿泊を提供し、PetBackerは宿泊、散歩、グルーミングなど様々なペットサービスのプラットフォームを提供しています。さらに、ペットの宿泊、高齢者ケア、継続的な医療ケアなどを求める人が増えており、カスタマイズ型ペットシッターサービスの需要が高まっています。特定の飼い主層を対象にした専門サービスを提供することで、ペットシッターはこうした機会から利益を得ることができます。
ペットシッター市場レポートハイライト
- サービスタイプ別では、訪問介護セグメントが2024年に57.03%の最大収益シェアで市場をリードし、予測期間中に11.6%の最速CAGRで成長すると予測されています。ペットの飼い主は、長期的なケアを提供し、ペットの健康を確保し、投薬管理を行い、ペットの日常生活を維持し、安心感と絆を育むことができる訓練された人材を好みます。これらの要因により、訪問介護の市場シェアは高くなっています。
- ペットタイプ別では、犬セグメントが2024年に83.16%の最大売上シェアで市場をリードしました。
- 北米は2024年に37.0%の収益シェアで市場を独占しました。同地域は、予測期間中も支配的な地位を維持し、着実な成長を続けると予想されます。この成長は、ペット飼育の増加、ペットへの支出の増加、ペットの健康と福祉に対する関心の高まりといった要因によってもたらされます。
- インドは、ペットの所有率の上昇とペットへの支出の増加により、アジア太平洋のペット市場の成長をリードすると予想され、その結果、ペットシッターを含むペットケアサービスの需要を促進しています。
目次
第1章 調査手法と範囲
第2章 エグゼクティブサマリー
第3章 ペットシッター産業の展望
- 市場系統の展望
- 親市場
- 補助市場
- 市場力学
- 市場促進要因分析
- 市場抑制要因分析
- 市場機会分析
- 市場課題分析
- ペットシッター市場分析ツール
- 産業分析-ポーターのファイブフォース分析
- PESTEL分析
- ビジネスプラン分析(STP分析)
- 消費者の動向と嗜好
- サービス価格分析
- 価格分析
- 2024年の主要種と国別のペット推定個体数
- COVID-19の影響分析
第4章 ペットシッター市場: ペットタイプ、推定・動向分析
- セグメントダッシュボード
- 世界のペットシッター市場:ペットタイプ別の変動分析
- 世界のペットシッター市場の規模と動向分析、ペットタイプ別、2018~2030年
- 犬
- 猫
- その他
第5章 ペットシッター市場:サービスタイプ、推定・動向分析
- セグメントダッシュボード
- 世界のペットシッター市場:サービスタイプ別の変動分析
- 世界のペットシッター市場規模と動向分析、サービスタイプ別、2018~2030年
- ケア訪問
- 立ち寄り訪問
第6章 ペットシッター市場:地域別、推定・動向分析
- 地域ダッシュボード
- ペットシッター市場シェア、地域別、2024年と2030年、100万米ドル
- 地域展望
- 北米
- 米国
- カナダ
- メキシコ
- 欧州
- 英国
- ドイツ
- フランス
- イタリア
- スペイン
- デンマーク
- オランダ
- ポーランド
- スウェーデン
- ノルウェー
- アジア太平洋
- 日本
- 中国
- インド
- オーストラリア
- 韓国
- タイ
- ラテンアメリカ
- ブラジル
- アルゼンチン
- 中東・アフリカ
- 南アフリカ
- サウジアラビア
- アラブ首長国連邦
- クウェート
第7章 競合情勢
- 市場参入企業の分類
- 企業市況分析/ヒープマップ分析
- 企業プロファイル
- A Place for Rover, Inc.
- Pets at Home, Inc.
- Wag!Group Co.
- PetBacker
- Careguide Inc.
- Fetch!Pet Care
- Holidog.com
- PetSmart LLC
- Dogtopia Enterprises
- Swifto Inc.
- 戦略マッピング
- 合併と買収
- パートナーシップとコラボレーション
- サービス開始
- 拡大
- その他
- その他の主要参入企業一覧
List of Tables
- Table 1 List of secondary sources
- Table 2 Global Pet Sitting market, by region, 2018 - 2030 (USD Million)
- Table 3 Global Pet Sitting market, by Pet Type, 2018 - 2030 (USD Million)
- Table 4 Global Pet Sitting market, by Service Type, 2018 - 2030 (USD Million)
- Table 5 North America Pet Sitting market, by country, 2018 - 2030 (USD Million)
- Table 6 North America Pet Sitting market, by Pet Type, 2018 - 2030 (USD Million)
- Table 7 North America Pet Sitting market, by Service Type, 2018 - 2030 (USD Million)
- Table 8 U.S. Pet Sitting market, by Pet Type, 2018 - 2030 (USD Million)
- Table 9 U.S. Pet Sitting market, by Service Type, 2018 - 2030 (USD Million)
- Table 10 Canada Pet Sitting market, by Pet Type, 2018 - 2030 (USD Million)
- Table 11 Canada Pet Sitting market, by Service Type, 2018 - 2030 (USD Million)
- Table 12 Mexico Pet Sitting market, by Pet Type, 2018 - 2030 (USD Million)
- Table 13 Mexico Pet Sitting market, by Service Type, 2018 - 2030 (USD Million)
- Table 14 Europe Pet Sitting market, by country, 2018 - 2030 (USD Million)
- Table 15 Europe Pet Sitting market, by Pet Type, 2018 - 2030 (USD Million)
- Table 16 Europe Pet Sitting market, by Service Type, 2018 - 2030 (USD Million)
- Table 17 Germany Pet Sitting market, by Pet Type, 2018 - 2030 (USD Million)
- Table 18 Germany Pet Sitting market, by Service Type, 2018 - 2030 (USD Million)
- Table 19 UK Pet Sitting market, by Pet Type, 2018 - 2030 (USD Million)
- Table 20 UK Pet Sitting market, by Service Type, 2018 - 2030 (USD Million)
- Table 21 France Pet Sitting market, by Pet Type, 2018 - 2030 (USD Million)
- Table 22 France Pet Sitting market, by Service Type, 2018 - 2030 (USD Million)
- Table 23 Italy Pet Sitting market, by Pet Type, 2018 - 2030 (USD Million)
- Table 24 Italy Pet Sitting market, by Service Type, 2018 - 2030 (USD Million)
- Table 25 Spain Pet Sitting market, by Pet Type, 2018 - 2030 (USD Million)
- Table 26 Spain Pet Sitting market, by Service Type, 2018 - 2030 (USD Million)
- Table 27 Denmark Pet Sitting market, by Pet Type, 2018 - 2030 (USD Million)
- Table 28 Denmark Pet Sitting market, by Service Type, 2018 - 2030 (USD Million)
- Table 29 Netherlands Pet Sitting market, by Pet Type, 2018 - 2030 (USD Million)
- Table 30 Netherlands Pet Sitting market, by Service Type, 2018 - 2030 (USD Million)
- Table 31 Poland Pet Sitting market, by Pet Type, 2018 - 2030 (USD Million)
- Table 32 Poland Pet Sitting market, by Service Type, 2018 - 2030 (USD Million)
- Table 33 Sweden Pet Sitting market, by Pet Type, 2018 - 2030 (USD Million)
- Table 34 Sweden Pet Sitting market, by Service Type, 2018 - 2030 (USD Million)
- Table 35 Norway Pet Sitting market, by Pet Type, 2018 - 2030 (USD Million)
- Table 36 Norway Pet Sitting market, by Service Type, 2018 - 2030 (USD Million)
- Table 37 Asia Pacific Pet Sitting market, by country, 2018 - 2030 (USD Million)
- Table 38 Asia Pacific Pet Sitting market, by Pet Type, 2018 - 2030 (USD Million)
- Table 39 Asia Pacific Pet Sitting market, by Service Type, 2018 - 2030 (USD Million)
- Table 40 China Pet Sitting market, by Pet Type, 2018 - 2030 (USD Million)
- Table 41 China Pet Sitting market, by Service Type, 2018 - 2030 (USD Million)
- Table 42 Japan Pet Sitting market, by Pet Type, 2018 - 2030 (USD Million)
- Table 43 Japan Pet Sitting market, by Service Type, 2018 - 2030 (USD Million)
- Table 44 India Pet Sitting market, by Pet Type, 2018 - 2030 (USD Million)
- Table 45 India Pet Sitting market, by Service Type, 2018 - 2030 (USD Million)
- Table 46 South Korea Pet Sitting market, by Pet Type, 2018 - 2030 (USD Million)
- Table 47 South Korea Pet Sitting market, by Service Type, 2018 - 2030 (USD Million)
- Table 48 Australia Pet Sitting market, by Pet Type, 2018 - 2030 (USD Million)
- Table 49 Australia Pet Sitting market, by Service Type, 2018 - 2030 (USD Million)
- Table 50 Thailand Pet Sitting market, by Pet Type, 2018 - 2030 (USD Million)
- Table 51 Thailand Pet Sitting market, by Service Type, 2018 - 2030 (USD Million)
- Table 52 Latin America Pet Sitting market, by country, 2018 - 2030 (USD Million)
- Table 53 Latin America Pet Sitting market, by Pet Type, 2018 - 2030 (USD Million)
- Table 54 Latin America Pet Sitting market, by Service Type, 2018 - 2030 (USD Million)
- Table 55 Brazil Pet Sitting market, by Pet Type, 2018 - 2030 (USD Million)
- Table 56 Brazil Pet Sitting market, by Service Type, 2018 - 2030 (USD Million)
- Table 57 Argentina Pet Sitting market, by Pet Type, 2018 - 2030 (USD Million)
- Table 58 Argentina Pet Sitting market, by Service Type, 2018 - 2030 (USD Million)
- Table 59 MEA Pet Sitting market, by country, 2018 - 2030 (USD Million)
- Table 60 MEA Pet Sitting market, by Pet Type, 2018 - 2030 (USD Million)
- Table 61 MEA Pet Sitting market, by Service Type, 2018 - 2030 (USD Million)
- Table 62 South Africa Pet Sitting market, by Pet Type, 2018 - 2030 (USD Million)
- Table 63 South Africa Pet Sitting market, by Service Type, 2018 - 2030 (USD Million)
- Table 64 Saudi Arabia Pet Sitting market, by Pet Type, 2018 - 2030 (USD Million)
- Table 65 Saudi Arabia Pet Sitting market, by Service Type, 2018 - 2030 (USD Million)
- Table 66 UAE Pet Sitting market, by Pet Type, 2018 - 2030 (USD Million)
- Table 67 UAE Pet Sitting market, by Service Type, 2018 - 2030 (USD Million)
- Table 68 Kuwait Pet Sitting market, by Pet Type, 2018 - 2030 (USD Million)
- Table 69 Kuwait Pet Sitting market, by Service Type, 2018 - 2030 (USD Million)
- Table 70 Company Overview
- Table 71 Service Benchmarking
- Table 72 Financial Performance
- Table 73 Strategic Initiatives
List of Figures
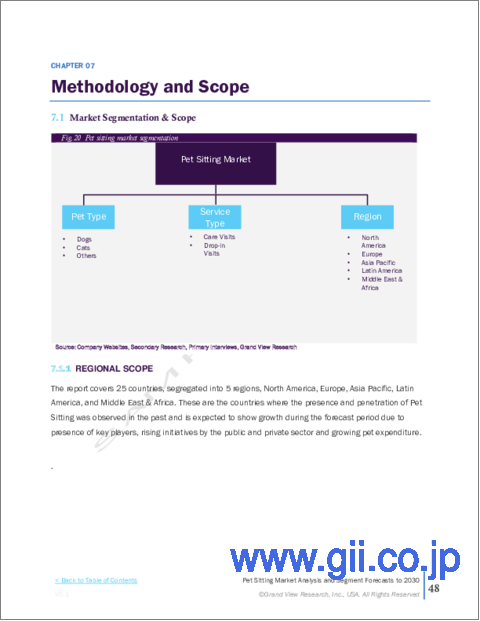
- Fig. 1 Market segmentation
- Fig. 2 Market research process
- Fig. 3 Information procurement
- Fig. 4 Primary research pattern
- Fig. 5 Market research approaches
- Fig. 6 Value chain-based sizing & forecasting
- Fig. 7 QFD modelling for market share assessment
- Fig. 8 Market formulation & validation
- Fig. 9 Pet Sitting market revenue, 2018-2030 (USD Million)
- Fig. 10 Pet Sitting market snapshot
- Fig. 11 Pet Sitting market driver impact
- Fig. 12 Pet Sitting market restraint impact
- Fig. 13 Pet Sitting pet type key takeaways (USD Million)
- Fig. 14 Pet Sitting market: Pet Type movement analysis
- Fig. 15 Global dogs market, 2018 - 2030 (USD Million)
- Fig. 16 Global cats market, 2018 - 2030 (USD Million)
- Fig. 17 Global others market, 2018 - 2030 (USD Million)
- Fig. 18 Pet Sitting market service type key takeaways (USD Million)
- Fig. 19 Pet Sitting market: Service type movement analysis
- Fig. 20 Global care visits market, 2018 - 2030 (USD Million)
- Fig. 21 Global drop-in visits market, 2018 - 2030 (USD Million)
- Fig. 22 Regional market place: Key takeaways
- Fig. 23 Regional outlook, 2024 & 2030
- Fig. 24 North America Pet Sitting market, 2018 - 2030 (USD Million)
- Fig. 25 U.S. Pet Sitting market, 2018 - 2030 (USD Million)
- Fig. 26 Canada Pet Sitting market, 2018 - 2030 (USD Million)
- Fig. 27 Mexico Pet Sitting market, 2018 - 2030 (USD Million)
- Fig. 28 Europe Pet Sitting market, 2018 - 2030 (USD Million)
- Fig. 29 UK Pet Sitting market, 2018 - 2030 (USD Million)
- Fig. 30 Germany Pet Sitting market, 2018 - 2030 (USD Million)
- Fig. 31 France Pet Sitting market, 2018 - 2030 (USD Million)
- Fig. 32 Italy Pet Sitting market, 2018 - 2030 (USD Million)
- Fig. 33 Spain companion animal Health market, 2018 - 2030 (USD Million)
- Fig. 34 Denmark Pet Sitting market, 2018 - 2030 (USD Million)
- Fig. 35 Netherlands Pet Sitting market, 2018 - 2030 (USD Million)
- Fig. 36 Poland Pet Sitting market, 2018 - 2030 (USD Million)
- Fig. 37 Sweden Pet Sitting market, 2018 - 2030 (USD Million)
- Fig. 38 Norway Pet Sitting market, 2018 - 2030 (USD Million)
- Fig. 39 Asia Pacific Pet Sitting market, 2018 - 2030 (USD Million)
- Fig. 40 Japan Pet Sitting market, 2018 - 2030 (USD Million)
- Fig. 41 China Pet Sitting market, 2018 - 2030 (USD Million)
- Fig. 42 India Pet Sitting market, 2018 - 2030 (USD Million)
- Fig. 43 Australia Pet Sitting market, 2018 - 2030 (USD Million)
- Fig. 44 South Korea Pet Sitting market, 2018 - 2030 (USD Million)
- Fig. 45 Thailand Pet Sitting market, 2018 - 2030 (USD Million)
- Fig. 46 Latin America Pet Sitting market, 2018 - 2030 (USD Million)
- Fig. 47 Brazil Pet Sitting market, 2018 - 2030 (USD Million)
- Fig. 48 Argentina Pet Sitting market, 2018 - 2030 (USD Million)
- Fig. 49 MEA Pet Sitting market, 2018 - 2030 (USD Million)
- Fig. 50 South Africa Pet Sitting market, 2018 - 2030 (USD Million)
- Fig. 51 Saudi Arabia Pet Sitting market, 2018 - 2030 (USD Million)
- Fig. 52 UAE Pet Sitting market, 2018 - 2030 (USD Million)
- Fig. 53 Kuwait Pet Sitting market, 2018 - 2030 (USD Million)
- Fig. 54 Market participant categorization
- Fig. 55 Heat map analysis
Pet Sitting Market Growth & Trends:
The global pet sitting market size is expected to reach USD 5.14 billion by 2030 and is projected to grow at a CAGR of 11.8% from 2025 to 2030, according to a new report by Grand View Research, Inc. The key factors driving the market growth include increasing adoption of subscription-based pet services, rising expansion of pet service offerings, and increased expenditure on pets. Owing to the younger demographics' increasing ownership of pets and the trend of pet humanization, the rate of pet adoption has been steadily rising. Moreover, the purchasing power of customers is increasing due to their growing disposable income, allowing them to spend more on their pets' well-being. These factors have raised the need for pet services and encouraged new pet service providers to enter the market, including boarding, grooming, pet sitting, and photography. According to May 2023 data published by Texas Hotel & Lodging Association, 75% of the country's hotels are pet-friendly and provide accommodation care as well as services for pets. In addition, it is estimated that approximately 78% of American pet owners travel with their pets.
The COVID-19 pandemic resulted in many challenges including decreased sales and marketing activities, and limitations on pet services. In addition, interestingly, pet ownership increased during the pandemic, as people were confined inside the house, the need for companionship and emotional support increased. In December 2023, according to American Pet Products Association (APPA), 48% of the previous pet owners adopted new pets during the pandemic. In the U.S., pet ownership was estimated to grow by 4.7% from 2009 to 2019, and the pandemic accelerated this growth rate to 9.8%.
The market is expected to increase steadily over the coming years due to a growing demand for personalized, technologically integrated, safe, environmentally sustainable, and niche-focused pet sitting services, along with an emphasis on collaborations and partnerships within the pet care industry. Pet sitting is a growing sector in countries like France due to the existence of platforms like TrustedHousesitters, which lists over 119 house sits in France, and PetBacker, which boasts 2,247 pet sitters in France. TrustedHousesitters offers house and pet sitting services with a focus on matching sitters with homeowners for free accommodation in exchange for pet care, while PetBacker provides a platform for various pet services, including boarding, walking, and grooming. Moreover, the demand for customized pet sitting services is rising, with more people looking for overnight stays, senior pet care, or ongoing medical attention for their pets. By providing specialized services that target particular pet owner demographics, pet sitters can profit from these opportunities.
Pet Sitting Market Report Highlights:
- Based on service type, the care visit segment led the market with the largest revenue share of 57.03% in 2024 and is anticipated to grow at the fastest CAGR of 11.6% over the forecast period. Pet owners prefer trained personnel who can provide extended care, ensure a pet's well-being, administer medication, & maintain their routine, fostering a sense of security and bonding. These factors have led to a higher market share for care visits
- Based on pet type, the dogs segment led the market with the largest revenue share of 83.16% in 2024
- North America dominated the market with a revenue share of 37.0% in 2024. The region is expected to continue its steady growth, maintaining its dominant position over the forecast period. This growth is driven by factors such as increase in pet ownership, higher spending on pets, and growing concerns for pet health & wellbeing
- India is expected to lead the growth in the pet market within the APAC region due to rising pet ownership and increasing spending on pets, consequently fueling the demand for pet care services, including pet sitting
Table of Contents
Chapter 1. Methodology and Scope
- 1.1. Market Segmentation and Scope
- 1.2. Research Methodology
- 1.3. Information Procurement
- 1.3.1. Purchased Database
- 1.3.2. GVR's Internal Database
- 1.3.3. Secondary Sources
- 1.3.4. Primary Research
- 1.4. Information/Data Analysis
- 1.5. Market Formulation & Visualization
- 1.6. Data Validation & Publishing
- 1.7. Model Details
- 1.7.1. Commodity flow analysis
- 1.7.2. Global Market: CAGR Calculation
- 1.8. List of Secondary Sources
Chapter 2. Executive Summary
- 2.1. Market Outlook
- 2.2. Segment Outlook
- 2.3. Competitive Insights
Chapter 3. Pet Sitting Industry Outlook
- 3.1. Market Lineage Outlook
- 3.1.1. Parent Market
- 3.1.2. Ancillary Market
- 3.2. Market Dynamics
- 3.2.1. Market Driver Analysis
- 3.2.1.1. Increased Expenditure on Pets
- 3.2.1.2. Rising Pet Humanization
- 3.2.1.3. Rising expansion of pet service offerings
- 3.2.1.4. Increasing Adoption of subscription-based pet services
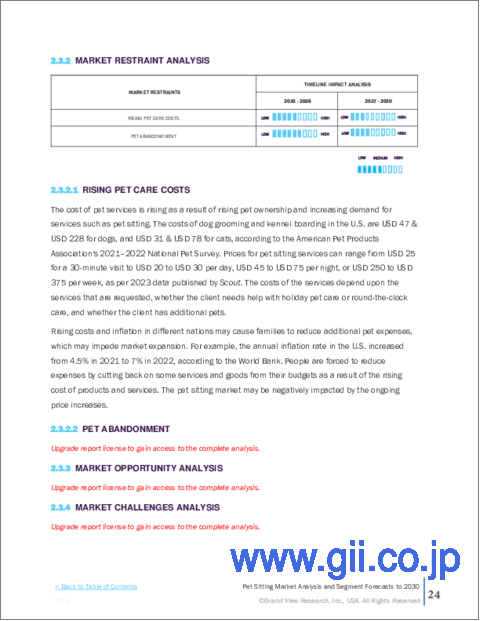
- 3.2.2. Market Restraint Analysis
- 3.2.2.1. Rising pet care costs
- 3.2.2.2. Pet Abandonment
- 3.2.3. Market Opportunity Analysis
- 3.2.4. Market Challenge Analysis
- 3.2.1. Market Driver Analysis
- 3.3. Pet Sitting Market Analysis Tools
- 3.3.1. Industry Analysis - Porter's
- 3.3.1.1. Bargaining power of suppliers
- 3.3.1.2. Bargaining power of buyers
- 3.3.1.3. Threat of substitution
- 3.3.1.4. Threat of new entrants
- 3.3.1.5. Competitive rivalry
- 3.3.2. PESTEL Analysis
- 3.3.2.1. Political & Legal landscape
- 3.3.2.2. Economic and Social landscape
- 3.3.2.3. Technological landscape
- 3.3.2.4. Environmental landscape
- 3.3.3. Business Plan Analysis (STP Analysis)
- 3.3.4. Consumer Trends & Preferences
- 3.3.5. Service Pricing Analysis
- 3.3.6. Pricing Analysis
- 3.3.7. Estimated Pet Population, by key species & key countries, 2024
- 3.3.8. COVID-19 Impact Analysis
- 3.3.1. Industry Analysis - Porter's
Chapter 4. Pet Sitting Market: Pet Type Estimates & Trend Analysis
- 4.1. Segment Dashboard
- 4.2. Global Pet Sitting Market: Pet type Movement Analysis
- 4.3. Global Pet Sitting Market Size & Trend Analysis, by pet type, 2018 to 2030 (USD Million)
- 4.4. Dogs
- 4.4.1. Dogs Market Revenue Estimates and Forecasts, 2018 - 2030 (USD Million)
- 4.5. Cats
- 4.5.1. Cats Market Revenue Estimates and Forecasts, 2018 - 2030 (USD Million)
- 4.6. Others
- 4.6.1. Others Market Revenue Estimates and Forecasts, 2018 - 2030 (USD Million)
Chapter 5. Pet Sitting Market: Service Type Estimates & Trend Analysis
- 5.1. Segment Dashboard
- 5.2. Global Pet Sitting Market: Service Type Movement Analysis
- 5.3. Global Pet Sitting Market Size & Trend Analysis, by Service Type, 2018 to 2030 (USD Million)
- 5.3.1. Care Visits
- 5.3.1.1. Care visits Market Revenue Estimates and Forecasts, 2018 - 2030 (USD Million)
- 5.3.2. Drop-in Visits
- 5.3.2.1. Drop-in visits Market Revenue Estimates and Forecasts, 2018 - 2030 (USD Million)
- 5.3.1. Care Visits
Chapter 6. Pet Sitting Market: Regional Estimates & Trend Analysis
- 6.1. Regional Dashboard
- 6.2. Pet Sitting Market Share, By Region, 2024 & 2030, USD Million
- 6.3. Regional Outlook
- 6.4. North America
- 6.4.1. North America Pet Sitting Market Estimates And Forecasts, 2018 - 2030 (USD Million)
- 6.4.2. U.S.
- 6.4.2.1. Key Country Dynamics
- 6.4.2.2. U.S. Pet Sitting Market Estimates And Forecasts, 2018 - 2030 (USD Million)
- 6.4.3. Canada
- 6.4.3.1. Key Country Dynamics
- 6.4.3.2. Canada Pet Sitting Market Estimates And Forecasts, 2018 - 2030 (USD Million)
- 6.4.4. Mexico
- 6.4.4.1. Key Country Dynamics
- 6.4.4.2. Mexico Pet Sitting Market Estimates And Forecasts, 2018 - 2030 (USD Million)
- 6.5. Europe
- 6.5.1. Europe Pet Sitting Market Estimates And Forecasts, 2018 - 2030 (USD Million)
- 6.5.2. UK
- 6.5.2.1. Key Country Dynamics
- 6.5.2.2. UK Pet Sitting Market Estimates And Forecasts, 2018 - 2030 (USD Million)
- 6.5.3. Germany
- 6.5.3.1. Key Country Dynamics
- 6.5.3.2. Germany Pet Sitting Market Estimates And Forecasts, 2018 - 2030 (USD Million)
- 6.5.4. France
- 6.5.4.1. Key Country Dynamics
- 6.5.4.2. France Pet Sitting Market Estimates And Forecasts, 2018 - 2030 (USD Million)
- 6.5.5. Italy
- 6.5.5.1. Key Country Dynamics
- 6.5.5.2. Italy Pet Sitting Market Estimates And Forecasts, 2018 - 2030 (USD Million)
- 6.5.6. Spain
- 6.5.6.1. Key Country Dynamics
- 6.5.6.2. Spain Pet Sitting Market Estimates And Forecasts, 2018 - 2030 (USD Million)
- 6.5.7. Denmark
- 6.5.7.1. Key Country Dynamics
- 6.5.7.2. Denmark Pet Sitting Market Estimates And Forecasts, 2018 - 2030 (USD Million)
- 6.5.8. Netherlands
- 6.5.8.1. Key Country Dynamics
- 6.5.8.2. Netherlands Pet Sitting Market Estimates And Forecasts, 2018 - 2030 (USD Million)
- 6.5.9. Poland
- 6.5.9.1. Key Country Dynamics
- 6.5.9.2. Poland Pet Sitting Market Estimates And Forecasts, 2018 - 2030 (USD Million)
- 6.5.10. Sweden
- 6.5.10.1. Key Country Dynamics
- 6.5.10.2. Sweden Pet Sitting Market Estimates And Forecasts, 2018 - 2030 (USD Million)
- 6.5.11. Norway
- 6.5.11.1. Key Country Dynamics
- 6.5.11.2. Norway Pet Sitting Market Estimates And Forecasts, 2018 - 2030 (USD Million)
- 6.6. Asia Pacific
- 6.6.1. Asia Pacific Pet Sitting Market Estimates And Forecasts, 2018 - 2030 (USD Million)
- 6.6.2. Japan
- 6.6.2.1. Key Country Dynamics
- 6.6.2.2. Japan Pet Sitting Market Estimates And Forecasts, 2018 - 2030 (USD Million)
- 6.6.3. China
- 6.6.3.1. Key Country Dynamics
- 6.6.3.2. China Pet Sitting Market Estimates And Forecasts, 2018 - 2030 (USD Million)
- 6.6.4. India
- 6.6.4.1. Key Country Dynamics
- 6.6.4.2. India Pet Sitting Market Estimates And Forecasts, 2018 - 2030 (USD Million)
- 6.6.5. Australia
- 6.6.5.1. Key Country Dynamics
- 6.6.5.2. Australia Pet Sitting Market Estimates And Forecasts, 2018 - 2030 (USD Million)
- 6.6.6. South Korea
- 6.6.6.1. Key Country Dynamics
- 6.6.6.2. South Korea Pet Sitting Market Estimates And Forecasts, 2018 - 2030 (USD Million)
- 6.6.7. Thailand
- 6.6.7.1. Key Country Dynamics
- 6.6.7.2. Thailand Pet Sitting Market Estimates And Forecasts, 2018 - 2030 (USD Million)
- 6.7. Latin America
- 6.7.1. Latin America Pet Sitting Market Estimates And Forecasts, 2018 - 2030 (USD Million)
- 6.7.2. Brazil
- 6.7.2.1. Key Country Dynamics
- 6.7.2.2. Brazil Pet Sitting Market Estimates And Forecasts, 2018 - 2030 (USD Million)
- 6.7.3. Argentina
- 6.7.3.1. Key Country Dynamics
- 6.7.3.2. Argentina Pet Sitting Market Estimates And Forecasts, 2018 - 2030 (USD Million)
- 6.8. Middle East & Africa
- 6.8.1. Middle East & Africa Pet Sitting Market Estimates And Forecasts, 2018 - 2030 (USD Million)
- 6.8.2. South Africa
- 6.8.2.1. Key Country Dynamics
- 6.8.2.2. South Africa Pet Sitting Market Estimates And Forecasts, 2018 - 2030 (USD Million)
- 6.8.3. Saudi Arabia
- 6.8.3.1. Key Country Dynamics
- 6.8.3.2. Saudi Arabia Pet Sitting Market Estimates And Forecasts, 2018 - 2030 (USD Million)
- 6.8.4. UAE
- 6.8.4.1. Key Country Dynamics
- 6.8.4.2. UAE Pet Sitting Market Estimates And Forecasts, 2018 - 2030 (USD Million)
- 6.8.5. Kuwait
- 6.8.5.1. Key Country Dynamics
- 6.8.5.2. Kuwait Pet Sitting Market Estimates And Forecasts, 2018 - 2030 (USD Million)
Chapter 7. Competitive Landscape
- 7.1. Market Participant Categorization
- 7.2. Company Market Position Analysis/ Heap Map Analysis
- 7.3. Company Profiles
- 7.3.1. A Place for Rover, Inc.
- 7.3.1.1. Participant's Overview
- 7.3.1.2. Financial Performance
- 7.3.1.3. Service Benchmarking
- 7.3.1.4. Strategic Initiatives
- 7.3.2. Pets at Home, Inc.
- 7.3.2.1. Participant's Overview
- 7.3.2.2. Financial Performance
- 7.3.2.3. Service Benchmarking
- 7.3.2.4. Strategic Initiatives
- 7.3.3. Wag! Group Co.
- 7.3.3.1. Participant's Overview
- 7.3.3.2. Financial Performance
- 7.3.3.3. Service Benchmarking
- 7.3.3.4. Strategic Initiatives
- 7.3.4. PetBacker
- 7.3.4.1. Participant's Overview
- 7.3.4.2. Financial Performance
- 7.3.4.3. Service Benchmarking
- 7.3.4.4. Strategic Initiatives
- 7.3.5. Careguide Inc.
- 7.3.5.1. Participant's Overview
- 7.3.5.2. Financial Performance
- 7.3.5.3. Service Benchmarking
- 7.3.5.4. Strategic Initiatives
- 7.3.6. Fetch! Pet Care
- 7.3.6.1. Participant's Overview
- 7.3.6.2. Financial Performance
- 7.3.6.3. Service Benchmarking
- 7.3.6.4. Strategic Initiatives
- 7.3.7. Holidog.com
- 7.3.7.1. Participant's Overview
- 7.3.7.2. Financial Performance
- 7.3.7.3. Service Benchmarking
- 7.3.7.4. Strategic Initiatives
- 7.3.8. PetSmart LLC
- 7.3.8.1. Participant's Overview
- 7.3.8.2. Financial Performance
- 7.3.8.3. Service Benchmarking
- 7.3.8.4. Strategic Initiatives
- 7.3.9. Dogtopia Enterprises
- 7.3.9.1. Participant's Overview
- 7.3.9.2. Financial Performance
- 7.3.9.3. Service Benchmarking
- 7.3.9.4. Strategic Initiatives
- 7.3.10. Swifto Inc.
- 7.3.10.1. Participant's Overview
- 7.3.10.2. Financial Performance
- 7.3.10.3. Service Benchmarking
- 7.3.10.4. Strategic Initiatives
- 7.3.1. A Place for Rover, Inc.
- 7.4. Strategy Mapping
- 7.4.1. Mergers & Acquisitions
- 7.4.2. Partnerships & Collaborations
- 7.4.3. Service Launch
- 7.4.4. Expansions
- 7.4.5. Others
- 7.5. List of Other Key Players
