|
|
市場調査レポート
商品コード
1511868
溶剤系プラスチックリサイクルの市場規模、シェア、動向分析レポート:製品別、用途別、地域別、セグメント予測、2024年~2030年Solvent-based Plastic Recycling Market Size, Share & Trends Analysis Report By Product (Polyethylene, Polyethylene Terephthalate, Polypropylene), By Application (Automotive, Textile), By Region, And Segment Forecasts, 2024 - 2030 |
||||||
|
|||||||
カスタマイズ可能
|
|||||||


| 溶剤系プラスチックリサイクルの市場規模、シェア、動向分析レポート:製品別、用途別、地域別、セグメント予測、2024年~2030年 |
|
出版日: 2024年06月14日
発行: Grand View Research
ページ情報: 英文 194 Pages
納期: 2~10営業日
|

全表示
- 概要
- 図表
- 目次
溶剤系プラスチックリサイクル市場の成長と動向
Grand View Research, Inc.の最新レポートによると、世界の溶剤系プラスチックリサイクル市場規模は2030年までに9億6,510万米ドルに達する見込みです。
市場は2024年から2030年にかけてCAGR 6.4%で拡大すると予測されています。プラスチック消費量の増加はプラスチック廃棄物の増加をもたらし、不適切なプラスチック廃棄物管理のために世界の危機となっています。プラスチック廃棄物の溶剤ベースのリサイクルは、この危機を解決する革新的な方法のひとつです。不純物を除去するために、選択的溶媒溶解プロセスが使用され、再利用に適した最低基準のプラスチックが回収されます。
溶剤ベースのプロセスは、現在リサイクル不可能なプラスチックのリサイクルに有用です。多層プラスチック材料は、電気・電子産業、食品・医療包装など多くの用途で使用されています。世界全体では、様々なポリマーを12層にも重ねた多層プラスチックが毎年約1億トン生産されています。多層プラスチックのリサイクルは困難であるため、そのほとんどが埋立地や焼却炉で処理されています。溶剤系リサイクルは、多層プラスチックをリサイクルすることで、この危機を解決することができます。
溶剤系リサイクル業界の主要企業には、プロクター・アンド・ギャンブル、APK AG、フラウンホーファーなどがあります。各企業は市場を獲得するため、提携や新たなリサイクル工場の設立に乗り出しています。例えば、2021年8月、ピュアサイクル・テクノロジーズはSK世界・ケミカルと、韓国にポリプロピレン(PP)のリサイクル工場を設立する契約を締結しました。また、主要大学も溶剤リサイクルの新しい方法を見つけるために積極的に調査を行っています。
例えば、ウィスコンシン大学マディソン校(UW-Madison)の科学者たちは、溶剤を使用して多層プラスチック中のプラスチックを抽出する、溶剤ターゲット回収沈殿(STRAP)処理と呼ばれる方法を発見しました。このプロセスでは、ポリエチレン、ポリエチレンテレフタレート(PET)、エチレンビニルアルコールなどの市販の多層プラスチックに含まれるポリマーを、一連の溶剤洗浄によって回収します。
溶剤系プラスチックリサイクル市場レポートハイライト
- ポリスチレン製品セグメントは、2023年の収益シェア47.05%以上で市場をリードし、予測期間中も健全な成長率を維持すると予測されます。
- 欧州、北米、アジアを含む各地域で、使い捨てプラスチック禁止に関する厳しい規制が業界の成長を促進すると予想されます。
- 環境問題への関心の高まりとともに、包装や電気・電子製品への需要が増加していることが、電気・電子用途セグメントにおける溶剤系プラスチックリサイクルの需要を促進すると予想されます。
- 包装用途は、2023年に38.73%以上の最大の収益シェアでリードしています。食品、医療、保護包装におけるプラスチック用途の増加が、予測期間中このセグメントを牽引すると見られています。
目次
第1章 調査手法と範囲
第2章 エグゼクティブサマリー
第3章 市場の変数、動向、範囲
- 市場系統の見通し
- 浸透と成長の見込みマッピング
- 業界バリューチェーン分析
- 原材料の動向
- 製造業の動向
- テクノロジーの概要
- 規制の枠組み
- 市場力学
- 市場 促進要因分析
- 市場抑制要因分析
- ビジネス環境分析
- 業界分析- ポーターのファイブフォース分析
- PESTEL分析
第4章 溶剤系プラスチックリサイクル市場:製品の推定・動向分析
- ポリエチレン
- ポリエチレンテレフタレート
- ポリプロピレン
- ポリ塩化ビニル
- ポリスチレン
- その他
第5章 溶剤系プラスチックリサイクル市場:用途の推定・動向分析
- 建築・建設
- パッケージ
- 電気・電子
- 繊維
- 自動車
- その他
第6章 溶剤系プラスチックリサイクル市場:地域の推定・動向分析
- 北米
- 北米の溶剤系プラスチックリサイクル市場推計・予測、2018年-2030年
- 製品別、2018年-2030年
- 用途別、2018年-2030年
- 欧州
- 欧州の溶剤系プラスチックリサイクル市場推計・予測、2018年-2030年
- 製品別、2018年-2030年
- 用途別、2018年-2030年
- アジア太平洋地域
- アジア太平洋地域の溶剤系プラスチックリサイクル市場推計・予測、2018年-2030年
- 製品別、2018年-2030年
- 用途別、2018年-2030年
- 中南米
- 中南米の溶剤系プラスチックリサイクル市場推計・予測、2018年-2030年
- 製品別、2018年-2030年
- 用途別、2018年-2030年
- 中東・アフリカ
- 中東およびアフリカの溶剤系プラスチックリサイクル市場推計・予測、2018年-2030年
- 製品別、2018年-2030年
- 用途別、2018年-2030年
第7章 競合情勢
- 世界の主要プレーヤーと最近の動向、そして業界への影響
- 主要企業/競合の分類(主要イノベーター、市場リーダー、新興企業)
- ベンダー情勢
- 主要販売代理店およびチャネルパートナーのリスト
- 主な潜在顧客
- 公開会社
- 企業の市況分析
- 競合ダッシュボード分析
- 非公開会社
- 主要な新興企業/技術革新企業/イノベーターのリスト
- 地理的存在
第8章 企業プロファイル
- Solvay
- 会社概要
- 財務実績
- 製品ベンチマーク
- 戦略的取り組み
- Sulzer Ltd
- 会社概要
- 財務実績
- 製品ベンチマーク
- 戦略的取り組み
- Trinseo
- 会社概要
- 財務実績
- 製品ベンチマーク
- 戦略的取り組み
- APK AG
- 会社概要
- 財務実績
- 製品ベンチマーク
- 戦略的取り組み
- Fraunhofer
- 会社概要
- 財務実績
- 製品ベンチマーク
- 戦略的取り組み
- PolystyreneLoop
- 会社概要
- 財務実績
- 製品ベンチマーク
- 戦略的取り組み
- PureCycle Technologies Inc
- 会社概要
- 財務実績
- 製品ベンチマーク
- 戦略的取り組み
- Saperatec GmbH
- 会社概要
- 財務実績
- 製品ベンチマーク
List of Tables
- Table 1 Global solvent-based plastic recycling market volume in polyethylene product estimates and forecasts, 2018 - 2030 (Kilotons) (USD Million)
- Table 2 Global solvent-based plastic recycling market volume in polyethylene terephthalate product estimates and forecasts, 2018 - 2030 (Kilotons) (USD Million)
- Table 3 Global solvent-based plastic recycling market volume in polypropylene product estimates and forecasts, 2018 - 2030 (Kilotons) (USD Million)
- Table 4 Global solvent-based plastic recycling market volume in polyvinyl chloride product estimates and forecasts, 2018 - 2030 (Kilotons) (USD Million)
- Table 5 Global solvent-based plastic recycling market volume in polystyrene product estimates and forecasts, 2018 - 2030 (Kilotons) (USD Million)
- Table 6 Global solvent-based plastic recycling market volume in others product estimates and forecasts, 2018 - 2030 (Kilotons) (USD Million)
- Table 7 Global solvent-based plastic recycling market volume in building & construction application estimates and forecasts, 2018 - 2030 (Kilotons) (USD Million)
- Table 8 Global solvent-based plastic recycling market volume in packaging application estimates and forecasts, 2018 - 2030 (Kilotons) (USD Million)
- Table 9 Global solvent-based plastic recycling market volume in electrical & electronics application estimates and forecasts, 2018 - 2030 (Kilotons) (USD Million)
- Table 10 Global solvent-based plastic recycling market volume in textiles application estimates and forecasts, 2018 - 2030 (Kilotons) (USD Million)
- Table 11 Global solvent-based plastic recycling market volume in automotive application estimates and forecasts, 2018 - 2030 (Kilotons) (USD Million)
- Table 12 Global solvent-based plastic recycling market volume in others application estimates and forecasts, 2018 - 2030 (Kilotons) (USD Million)
- Table 13 North America solvent-based plastic recycling market estimates and forecasts, 2018 - 2030 (Kilotons) (USD Million)
- Table 14 North America solvent-based plastic recycling market volume estimates and forecasts, by product 2018 - 2030 (Kilotons)
- Table 15 North America solvent-based plastic recycling market revenue estimates and forecasts, by product 2018 - 2030 (USD Million)
- Table 16 North America solvent-based plastic recycling market volume estimates and forecasts, by application 2018 - 2030 (Kilotons)
- Table 17 North America solvent-based plastic recycling market revenue estimates and forecasts, by application 2018 - 2030 (USD Million)
- Table 18 The U.S solvent-based plastic recycling market estimates and forecasts, 2018 - 2030 (Kilotons) (USD Million)
- Table 19 The U.S solvent-based plastic recycling market volume estimates and forecasts, by product 2018 - 2030 (Kilotons)
- Table 20 The U.S solvent-based plastic recycling market revenue estimates and forecasts, by product 2018 - 2030 (USD Million)
- Table 21 The U.S solvent-based plastic recycling market volume estimates and forecasts, by application 2018 - 2030 (Kilotons)
- Table 22 The U.S solvent-based plastic recycling market revenue estimates and forecasts, by application 2018 - 2030 (USD Million)
- Table 23 Canada solvent-based plastic recycling market estimates and forecasts, 2018 - 2030 (Kilotons) (USD Million)
- Table 24 Canada solvent-based plastic recycling market volume estimates and forecasts, by product 2018 - 2030 (Kilotons)
- Table 25 Canada solvent-based plastic recycling market revenue estimates and forecasts, by product 2018 - 2030 (USD Million)
- Table 26 Canada solvent-based plastic recycling market volume estimates and forecasts, by application 2018 - 2030 (Kilotons)
- Table 27 Canada solvent-based plastic recycling market revenue estimates and forecasts, by application 2018 - 2030 (USD Million)
- Table 28 Mexico solvent-based plastic recycling market estimates and forecasts, 2018 - 2030 (Kilotons) (USD Million)
- Table 29 Mexico solvent-based plastic recycling market volume estimates and forecasts, by product 2018 - 2030 (Kilotons)
- Table 30 Mexico solvent-based plastic recycling market revenue estimates and forecasts, by product 2018 - 2030 (USD Million)
- Table 31 Mexico solvent-based plastic recycling market volume estimates and forecasts, by application 2018 - 2030 (Kilotons)
- Table 32 Mexico solvent-based plastic recycling market revenue estimates and forecasts, by application 2018 - 2030 (USD Million)
- Table 33 Europe solvent-based plastic recycling market estimates and forecasts, 2018 - 2030 (Kilotons) (USD Million)
- Table 34 Europe solvent-based plastic recycling market volume estimates and forecasts, by product 2018 - 2030 (Kilotons)
- Table 35 Europe solvent-based plastic recycling market revenue estimates and forecasts, by product 2018 - 2030 (USD Million)
- Table 36 Europe solvent-based plastic recycling market volume estimates and forecasts, by application 2018 - 2030 (Kilotons)
- Table 37 Europe solvent-based plastic recycling market revenue estimates and forecasts, by application 2018 - 2030 (USD Million)
- Table 38 Germany solvent-based plastic recycling market estimates and forecasts, 2018 - 2030 (Kilotons) (USD Million)
- Table 39 Germany solvent-based plastic recycling market volume estimates and forecasts, by product 2018 - 2030 (Kilotons)
- Table 40 Germany solvent-based plastic recycling market revenue estimates and forecasts, by product 2018 - 2030 (USD Million)
- Table 41 Germany solvent-based plastic recycling market volume estimates and forecasts, by application 2018 - 2030 (Kilotons)
- Table 42 Germany solvent-based plastic recycling market revenue estimates and forecasts, by application 2018 - 2030 (USD Million)
- Table 43 The U.K solvent-based plastic recycling market estimates and forecasts, 2018 - 2030 (Kilotons) (USD Million)
- Table 44 The U.K solvent-based plastic recycling market volume estimates and forecasts, by product 2018 - 2030 (Kilotons)
- Table 45 The U.K solvent-based plastic recycling market revenue estimates and forecasts, by product 2018 - 2030 (USD Million)
- Table 46 The U.K solvent-based plastic recycling market volume estimates and forecasts, by application 2018 - 2030 (Kilotons)
- Table 47 The U.K solvent-based plastic recycling market revenue estimates and forecasts, by application 2018 - 2030 (USD Million)
- Table 48 Asia Pacific solvent-based plastic recycling market estimates and forecasts, 2018 - 2030 (Kilotons) (USD Million)
- Table 49 Asia Pacific solvent-based plastic recycling market volume estimates and forecasts, by product 2018 - 2030 (Kilotons)
- Table 50 Asia Pacific solvent-based plastic recycling market revenue estimates and forecasts, by product 2018 - 2030 (USD Million)
- Table 51 Asia Pacific solvent-based plastic recycling market volume estimates and forecasts, by application 2018 - 2030 (Kilotons)
- Table 52 Asia Pacific solvent-based plastic recycling market revenue estimates and forecasts, by application 2018 - 2030 (USD Million)
- Table 53 China solvent-based plastic recycling market estimates and forecasts, 2018 - 2030 (Kilotons) (USD Million)
- Table 54 China solvent-based plastic recycling market volume estimates and forecasts, by product 2018 - 2030 (Kilotons)
- Table 55 China solvent-based plastic recycling market revenue estimates and forecasts, by product 2018 - 2030 (USD Million)
- Table 56 China solvent-based plastic recycling market volume estimates and forecasts, by application 2018 - 2030 (Kilotons)
- Table 57 China solvent-based plastic recycling market revenue estimates and forecasts, by application 2018 - 2030 (USD Million)
- Table 58 India solvent-based plastic recycling market estimates and forecasts, 2018 - 2030 (Kilotons) (USD Million)
- Table 59 India solvent-based plastic recycling market volume estimates and forecasts, by product 2018 - 2030 (Kilotons)
- Table 60 India solvent-based plastic recycling market revenue estimates and forecasts, by product 2018 - 2030 (USD Million)
- Table 61 India solvent-based plastic recycling market volume estimates and forecasts, by application 2018 - 2030 (Kilotons)
- Table 62 India solvent-based plastic recycling market revenue estimates and forecasts, by application 2018 - 2030 (USD Million)
- Table 63 Japan solvent-based plastic recycling market estimates and forecasts, 2018 - 2030 (Kilotons) (USD Million)
- Table 64 Japan solvent-based plastic recycling market volume estimates and forecasts, by product 2018 - 2030 (Kilotons)
- Table 65 Japan solvent-based plastic recycling market revenue estimates and forecasts, by product 2018 - 2030 (USD Million)
- Table 66 Japan solvent-based plastic recycling market volume estimates and forecasts, by application 2018 - 2030 (Kilotons)
- Table 67 Japan solvent-based plastic recycling market revenue estimates and forecasts, by application 2018 - 2030 (USD Million)
- Table 68 Central & South America solvent-based plastic recycling market estimates and forecasts, 2018 - 2030 (Kilotons) (USD Million)
- Table 69 Central & South America solvent-based plastic recycling market volume estimates and forecasts, by product 2018 - 2030 (Kilotons)
- Table 70 Central & South America solvent-based plastic recycling market revenue estimates and forecasts, by product 2018 - 2030 (USD Million)
- Table 71 Central & South America solvent-based plastic recycling market volume estimates and forecasts, by application 2018 - 2030 (Kilotons)
- Table 72 Central & South America solvent-based plastic recycling market revenue estimates and forecasts, by application 2018 - 2030 (USD Million)
- Table 73 Middle East & Africa solvent-based plastic recycling market estimates and forecasts, 2018 - 2030 (Kilotons) (USD Million)
- Table 74 Middle East & Africa solvent-based plastic recycling market volume estimates and forecasts, by product 2018 - 2030 (Kilotons)
- Table 75 Middle East & Africa solvent-based plastic recycling market revenue estimates and forecasts, by product 2018 - 2030 (USD Million)
- Table 76 Middle East & Africa solvent-based plastic recycling market volume estimates and forecasts, by application 2018 - 2030 (Kilotons)
- Table 77 Middle East & Africa solvent-based plastic recycling market revenue estimates and forecasts, by application 2018 - 2030 (USD Million)
List of Figures
- Fig. 1 Market summary
- Fig. 2 Market segmentation & scope
- Fig. 3 Penetration & growth prospect mapping
- Fig. 4 Value chain analysis
- Fig. 5 Market dynamics
- Fig. 6 Market trends and outlook
- Fig. 7 Market driver relevance analysis (Current & future impact)
- Fig. 8 Porter's Five Forces Analysis
- Fig. 9 PESTEL Analysis
- Fig. 10 Solvent-based plastic recycling market: Product movement analysis, 2023 & 2030
- Fig. 11 Solvent-based plastic recycling market: Application movement analysis, 2023 & 2030
- Fig. 12 Solvent-based plastic recycling market: Regional movement analysis, 2023 & 2030
- Fig. 13 Regional market place: Key takeaways
- Fig. 14 Regional outlook, 2023 & 2030
- Fig. 15 Strategy mapping of key market players
Solvent-based Plastic Recycling Market Growth & Trends:
The global solvent-based plastic recycling market size is expected to reach USD 965.10 million by 2030, according to a new report by Grand View Research, Inc. The market is projected to expand at a CAGR of 6.4% from 2024 to 2030. Growing consumption of plastics has resulted in growing plastic waste which because of improper plastic waste management has become a global crisis. Solvent-based recycling of plastic waste is one of the innovative ways to solve this crisis. To remove impurities a selective solvent dissolution process is used to recover plastics of minimum standards suitable for reuse.
Solvent-based processes can be useful in recycling plastics that are currently non-recyclable. Multilayer plastic materials are being used in many applications like electrical and electronic industries, and food and medical packaging. Globally about 100 million tons of multilayer plastics containing as many as twelve layers of varying polymers are produced each year. As recycling multilayer plastics is difficult almost all of that plastic ends up in landfills or incinerators. Solvent-based recycling can help solve this crisis by recycling multilayer plastics.
Some of the major companies in the solved-based recycling industry include Proctor & Gamble, APK AG, and Fraunhofer. Companies are resorting to collaborations and establishing new recycling plants to capture the market. For example, In August 2021, PureCycle Technologies signed an agreement with SK Global Chemical to set up a polypropylene (PP) recycling plant in South Korea. Also, major universities are actively researching to find novel methods of solvent recycling.
For example, scientists at the University of Wisconsin-Madison (UW-Madison) have discovered a method called Solvent-Targeted Recovery and Precipitation (STRAP) processing for extracting the plastics in multilayer plastics using solvents. In this process, polymers in a commercial multilayer plastic such as polyethylene, polyethylene terephthalate (PET), and ethylene vinyl alcohol by using a sequence of solvent washes.
Solvent-based Plastic Recycling Market Report Highlights:
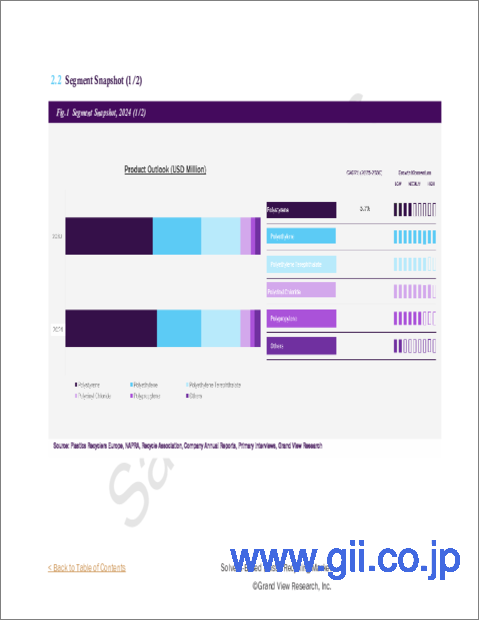
- The polystyrene product segment led the market with a revenue share of more than 47.05% in 2023 and is expected to maintain a healthy growth rate over the forecast period
- Stringent regulations regarding single-use plastic ban across regions including Europe, North America, and Asia, are expected to fuel the growth of the industry
- The growing demand for packaging and electrical & electronic products along with rising environmental concerns is expected to drive the demand for solvent-based plastic recycling in the electrical & electronics application segment
- The packaging application led with the largest revenue share of more than 38.73% in 2023. Increasing applications of plastics in food, medical and protective packaging are expected to drive the segment during the forecast period
Table of Contents
Chapter 1. Methodology and Scope
- 1.1. Market Segmentation & Scope
- 1.2. Market Definition
- 1.3. Information Procurement
- 1.3.1. Purchased Database
- 1.3.2. GVR's Internal Database
- 1.3.3. Secondary Sources & Third-Party Perspectives
- 1.3.4. Primary Research
- 1.4. Information Analysis
- 1.4.1. Data Analysis Models
- 1.5. Market Formulation & Data Visualization
Chapter 2. Executive Summary
- 2.1. Market summary
- 2.2. Segmental Outlook
Chapter 3. Market Variables, Trends, and Scope
- 3.1. Market Lineage Outlook
- 3.2. Penetration & Growth Prospect Mapping
- 3.3. Industry Value Chain Analysis
- 3.3.1. Raw Material Trends
- 3.3.2. Manufacturing Trends
- 3.4. Technology Overview
- 3.5. Regulatory Framework
- 3.6. Market Dynamics
- 3.6.1. Market Driver Analysis
- 3.6.2. Market Restraint Analysis
- 3.7. Business Environment Analysis
- 3.7.1. Industry Analysis - Porter's
- 3.7.1.1. Supplier Power
- 3.7.1.2. Buyer Power
- 3.7.1.3. Substitution Threat
- 3.7.1.4. Threat from New Entrant
- 3.7.1.5. Competitive Rivalry
- 3.7.2. PESTEL Analysis
- 3.7.2.1. Political Landscape
- 3.7.2.2. Environmental Landscape
- 3.7.2.3. Social Landscape
- 3.7.2.4. Technology Landscape
- 3.7.2.5. Economic Landscape
- 3.7.2.6. Legal Landscape
- 3.7.1. Industry Analysis - Porter's
Chapter 4. Solvent-based plastic recycling Market: Product Estimates & Trend Analysis
- 4.1. Product movement analysis & market share, 2023 - 2030
- 4.2. Polyethylene
- 4.2.1. Global solvent-based plastic recycling market, in polyethylene estimates and forecasts, 2018 - 2030 (Kilotons) (USD Million)
- 4.3. Polyethylene Terephthalate
- 4.3.1. Global solvent-based plastic recycling market, in polyethylene terephthalate estimates and forecasts, 2018 - 2030 (Kilotons) (USD Million)
- 4.4 Polypropylene
- 4.4.1. Global solvent-based plastic recycling market, in polypropylene estimates and forecasts, 2018 - 2030 (Kilotons) (USD Million)
- 4.5 Polyvinyl Chloride
- 4.5.1. Global solvent-based plastic recycling market, in polyvinyl chloride estimates and forecasts, 2018 - 2030 (Kilotons) (USD Million)
- 4.6 Polystyrene
- 4.6.1. Global solvent-based plastic recycling market, in polystyrene estimates and forecasts, 2018 - 2030 (Kilotons) (USD Million)
- 4.7 Others
- 4.7.1. Global solvent-based plastic recycling market, in others estimates and forecasts, 2018 - 2030 (Kilotons) (USD Million)
Chapter 5. Solvent-based plastic recycling Market: Application Estimates & Trend Analysis
- 5.1. Application movement analysis & market share, 2023 - 2030
- 5.2. Building & Construction
- 5.2.1. Global solvent-based plastic recycling market, in building & construction estimates and forecasts, 2018 - 2030 (Kilotons) (USD Million)
- 5.3. Packaging
- 5.3.1. Global solvent-based plastic recycling market, in packaging estimates and forecasts, 2018 - 2030 (Kilotons) (USD Million)
- 5.4. Electrical & Electronics
- 5.4.1. Global solvent-based plastic recycling market, in electrical & electronics estimates and forecasts, 2018 - 2030 (Kilotons) (USD Million)
- 5.5. Textiles
- 5.5.1. Global solvent-based plastic recycling market, in textiles estimates and forecasts, 2018 - 2030 (Kilotons) (USD Million)
- 5.6. Automotive
- 5.6.1. Global solvent-based plastic recycling market, in automotive estimates and forecasts, 2018 - 2030 (Kilotons) (USD Million)
- 5.7. Others
- 5.7.1. Global solvent-based plastic recycling market, in others estimates and forecasts, 2018 - 2030 (Kilotons) (USD Million)
Chapter 6. Solvent-based plastic recycling Market: Regional Estimates & Trend Analysis
- 6.1. Regional movement analysis & market share, 2023 - 2030
- 6.2. North America
- 6.2.1. North America solvent-based plastic recycling market estimates and forecasts, 2018 - 2030 (Kilotons) (USD Million)
- 6.2.2. North America solvent-based plastic recycling market estimates and forecasts, by product, 2018 - 2030 (Kilotons)
- 6.2.3. North America solvent-based plastic recycling market estimates and forecasts, by product, 2018 - 2030 (USD Million)
- 6.2.4. North America solvent-based plastic recycling market estimates and forecasts, by application, 2018 - 2030 (Kilotons)
- 6.2.5. North America solvent-based plastic recycling market estimates and forecasts, by application, 2018 - 2030 (USD Million)
- 6.2.5.1. U.S.
- 6.2.5.1.1. U.S. solvent-based plastic recycling market estimates and forecasts, 2018 - 2030 (Kilotons) (USD Million)
- 6.2.5.1.2. U.S. solvent-based plastic recycling market estimates and forecasts, by product, 2018 - 2030 (Kilotons)
- 6.2.5.1.3. U.S. solvent-based plastic recycling market estimates and forecasts, by product, 2018 - 2030 (USD Million)
- 6.2.5.1.4. U.S. solvent-based plastic recycling market estimates and forecasts, by application, 2018 - 2030 (Kilotons)
- 6.2.5.1.5. U.S. solvent-based plastic recycling market estimates and forecasts, by application, 2018 - 2030 (USD Million)
- 6.2.5.2. Canada
- 6.2.5.2.1. Canada solvent-based plastic recycling market estimates and forecasts, 2018 - 2030 (Kilotons) (USD Million)
- 6.2.5.2.2. Canada solvent-based plastic recycling market estimates and forecasts, by product, 2018 - 2030 (Kilotons)
- 6.2.5.2.3. Canada solvent-based plastic recycling market estimates and forecasts, by product, 2018 - 2030 (USD Million)
- 6.2.5.2.4. Canada solvent-based plastic recycling market estimates and forecasts, by application, 2018 - 2030 (Kilotons)
- 6.2.5.2.5. Canada solvent-based plastic recycling market estimates and forecasts, by application, 2018 - 2030 (USD Million)
- 6.2.5.3. Mexico
- 6.2.5.3.1. Mexico solvent-based plastic recycling market estimates and forecasts, 2018 - 2030 (Kilotons) (USD Million)
- 6.2.5.3.2. Mexico solvent-based plastic recycling market estimates and forecasts, by product, 2018 - 2030 (Kilotons)
- 6.2.5.3.3. Mexico solvent-based plastic recycling market estimates and forecasts, by product, 2018 - 2030 (USD Million)
- 6.2.5.3.4. Mexico solvent-based plastic recycling market estimates and forecasts, by application, 2018 - 2030 (Kilotons)
- 6.2.5.3.5. Mexico solvent-based plastic recycling market estimates and forecasts, by application, 2018 - 2030 (USD Million)
- 6.3. Europe
- 6.3.1. Europe solvent-based plastic recycling market estimates and forecasts, 2018 - 2030 (Kilotons) (USD Million)
- 6.3.2. Europe solvent-based plastic recycling market estimates and forecasts, by product, 2018 - 2030 (Kilotons)
- 6.3.3. Europe solvent-based plastic recycling market estimates and forecasts, by product, 2018 - 2030 (USD Million)
- 6.3.4. Europe solvent-based plastic recycling market estimates and forecasts, by application, 2018 - 2030 (Kilotons)
- 6.3.5. Europe solvent-based plastic recycling market estimates and forecasts, by application, 2018 - 2030 (USD Million)
- 6.3.5.1. Germany
- 6.3.5.1.1. Germany solvent-based plastic recycling market estimates and forecasts, 2018 - 2030 (Kilotons) (USD Million)
- 6.3.5.1.2. Germany solvent-based plastic recycling market estimates and forecasts, by product, 2018 - 2030 (Kilotons)
- 6.3.5.1.3. Germany solvent-based plastic recycling market estimates and forecasts, by product, 2018 - 2030 (USD Million)
- 6.3.5.1.4. Germany solvent-based plastic recycling market estimates and forecasts, by application, 2018 - 2030 (Kilotons)
- 6.3.5.1.5. Germany solvent-based plastic recycling market estimates and forecasts, by application, 2018 - 2030 (USD Million)
- 6.3.5.2. UK
- 6.3.5.2.1. U.K. solvent-based plastic recycling market estimates and forecasts, 2018 - 2030 (Kilotons) (USD Million)
- 6.3.5.2.2. U.K. solvent-based plastic recycling market estimates and forecasts, by product, 2018 - 2030 (Kilotons)
- 6.3.5.2.3. U.K. solvent-based plastic recycling market estimates and forecasts, by product, 2018 - 2030 (USD Million)
- 6.3.5.2.4. U.K. solvent-based plastic recycling market estimates and forecasts, by application, 2018 - 2030 (Kilotons)
- 6.3.5.2.5. U.K. solvent-based plastic recycling market estimates and forecasts, by application, 2018 - 2030 (USD Million)
- 6.4. Asia Pacific
- 6.4.1. Asia Pacific solvent-based plastic recycling market estimates and forecasts, 2018 - 2030 (Kilotons) (USD Million)
- 6.4.2. Asia Pacific solvent-based plastic recycling market estimates and forecasts, by product, 2018 - 2030 (Kilotons)
- 6.4.3. Asia Pacific solvent-based plastic recycling market estimates and forecasts, by product, 2018 - 2030 (USD Million)
- 6.4.4. Asia Pacific solvent-based plastic recycling market estimates and forecasts, by application, 2018 - 2030 (Kilotons)
- 6.4.5. Asia Pacific solvent-based plastic recycling market estimates and forecasts, by application, 2018 - 2030 (USD Million)
- 6.4.5.1. China
- 6.4.5.1.1. China solvent-based plastic recycling market estimates and forecasts, 2018 - 2030 (Kilotons) (USD Million)
- 6.4.5.1.2. China solvent-based plastic recycling market estimates and forecasts, by product, 2018 - 2030 (Kilotons)
- 6.4.5.1.3. China solvent-based plastic recycling market estimates and forecasts, by product, 2018 - 2030 (USD Million)
- 6.4.5.1.4. China solvent-based plastic recycling market estimates and forecasts, by application, 2018 - 2030 (Kilotons)
- 6.4.5.1.5. China solvent-based plastic recycling market estimates and forecasts, by application, 2018 - 2030 (USD Million)
- 6.4.5.2. India
- 6.4.5.2.1. India solvent-based plastic recycling market estimates and forecasts, 2018 - 2030 (Kilotons) (USD Million)
- 6.4.5.2.2. India solvent-based plastic recycling market estimates and forecasts, by product, 2018 - 2030 (Kilotons)
- 6.4.5.2.3. India solvent-based plastic recycling market estimates and forecasts, by product, 2018 - 2030 (USD Million)
- 6.4.5.2.4. India solvent-based plastic recycling market estimates and forecasts, by application, 2018 - 2030 (Kilotons)
- 6.4.5.2.5. India solvent-based plastic recycling market estimates and forecasts, by application, 2018 - 2030 (USD Million)
- 6.4.5.3. Japan
- 6.4.5.3.1. Japan solvent-based plastic recycling market estimates and forecasts, 2018 - 2030 (Kilotons) (USD Million)
- 6.4.5.3.2. Japan solvent-based plastic recycling market estimates and forecasts, by product, 2018 - 2030 (Kilotons)
- 6.4.5.3.3. Japan solvent-based plastic recycling market estimates and forecasts, by product, 2018 - 2030 (USD Million)
- 6.4.5.3.4. Japan solvent-based plastic recycling market estimates and forecasts, by application, 2018 - 2030 (Kilotons)
- 6.4.5.3.5. Japan solvent-based plastic recycling market estimates and forecasts, by application, 2018 - 2030 (USD Million)
- 6.5. Central & South America
- 6.5.1. Central & South America solvent-based plastic recycling market estimates and forecasts, 2018 - 2030 (Kilotons) (USD Million)
- 6.5.2. Central & South America solvent-based plastic recycling market estimates and forecasts, by product, 2018 - 2030 (Kilotons)
- 6.5.3. Central & South America solvent-based plastic recycling market estimates and forecasts, by product, 2018 - 2030 (USD Million)
- 6.5.4. Central & South America solvent-based plastic recycling market estimates and forecasts, by application, 2018 - 2030 (Kilotons)
- 6.5.5. Central & South America solvent-based plastic recycling market estimates and forecasts, by application, 2018 - 2030 (USD Million)
- 6.6. Middle East & Africa
- 6.6.1. Middle East & Africa solvent-based plastic recycling market estimates and forecasts, 2018 - 2030 (Kilotons) (USD Million)
- 6.6.2. Middle East & Africa solvent-based plastic recycling market estimates and forecasts, by product, 2018 - 2030 (Kilotons)
- 6.6.3. Middle East & Africa solvent-based plastic recycling market estimates and forecasts, by product, 2018 - 2030 (USD Million)
- 6.6.4. Middle East & Africa solvent-based plastic recycling market estimates and forecasts, by application, 2018 - 2030 (Kilotons)
- 6.6.5. Middle East & Africa solvent-based plastic recycling market estimates and forecasts, by application, 2018 - 2030 (USD Million)
Chapter 7. Competitive Landscape
- 7.1. Key Global Players & Recent Developments & Their Impact on The Industry
- 7.2. Key Company/Competition Categorization (Key innovators, Market leaders, emerging players)
- 7.3. Vendor Landscape
- 7.3.1. List of key Distributors and Channel Partners
- 7.3.2. Key Potential Customers
- 7.4. Public Companies
- 7.4.1. Company Market Position Analysis
- 7.4.2. Competitive Dashboard Analysis
- 7.5. Private Companies
- 7.5.1. List of Key Emerging Companies/Technology Disruptors/Innovators
- 7.5.2. Geographical Presence
Chapter 8. Company Profiles
- 8.1. Solvay
- 8.1.1. Company Overview
- 8.1.2. Financial Performance
- 8.1.3. Product Benchmarking
- 8.1.4. Strategic Initiatives
- 8.2. Sulzer Ltd
- 8.2.1. Company Overview
- 8.2.2. Financial Performance
- 8.2.3. Product Benchmarking
- 8.2.4. Strategic Initiatives
- 8.3. Trinseo
- 8.3.1. Company Overview
- 8.3.2. Financial Performance
- 8.3.3. Product Benchmarking
- 8.3.4. Strategic Initiatives
- 8.4. APK AG
- 8.4.1. Company Overview
- 8.4.2. Financial Performance
- 8.4.3. Product Benchmarking
- 8.4.4. Strategic Initiatives
- 8.5. Fraunhofer
- 8.5.1. Company Overview
- 8.5.2. Financial Performance
- 8.5.3. Product Benchmarking
- 8.5.4. Strategic Initiatives
- 8.6. PolystyreneLoop
- 8.6.1. Company Overview
- 8.6.2. Financial Performance
- 8.6.3. Product Benchmarking
- 8.6.4. Strategic Initiatives
- 8.7. PureCycle Technologies Inc
- 8.7.1. Company overview
- 8.7.2. Financial performance
- 8.7.3. Product benchmarking
- 8.7.4. Strategic Initiatives
- 8.8. Saperatec GmbH
- 8.8.1. Company overview
- 8.8.2. Financial performance
- 8.8.3. Product benchmarking
- 8.8.3.4 Strategic Initiatives

