|
|
市場調査レポート
商品コード
1122200
姿勢矯正市場の規模、シェア、動向分析レポート:流通チャネル別(薬局・小売店、eコマース)、製品別(シッティングサポートデバイス、キネシオロジーテープ)、エンドユーザー別、地域別、セグメント別予測、2022~2030年版Posture Correction Market Size, Share & Trends Analysis Report By Distribution Channel (Pharmacies & Retail Stores, E-Commerce), By Product (Sitting Support Devices, Kinesiology Tape), By End Use, By Region, And Segment Forecasts, 2022 - 2030 |
||||||
|
|
|||||||
|
● お客様のご希望に応じて、既存データの加工や未掲載情報(例:国別セグメント)の追加などの対応が可能です。 詳細はお問い合わせください。 |
|||||||


| 姿勢矯正市場の規模、シェア、動向分析レポート:流通チャネル別(薬局・小売店、eコマース)、製品別(シッティングサポートデバイス、キネシオロジーテープ)、エンドユーザー別、地域別、セグメント別予測、2022~2030年版 |
|
出版日: 2022年08月23日
発行: Grand View Research
ページ情報: 英文 150 Pages
納期: 2~10営業日
|
- 全表示
- 概要
- 図表
- 目次
姿勢矯正市場の成長と動向
Grand View Research, Inc.の新しいレポートによると、姿勢矯正の世界市場規模は2030年までに19億9000万米ドルに達すると予想されています。同市場は、2022年から2030年にかけて、有利なCAGR7.9%で拡大すると予測されています。市場成長の主な要因としては、世界中で腰痛の問題が増加していることや、人口の高齢化が挙げられます。例えば、2022年2月のNCBIによると、腰痛は成人の一般的な症状であり、世界中の人々の最大23%が慢性的な腰痛を経験しています。
COVID-19のパンデミックは、物流ブロック、需要の低下、セールス&マーケティングイベントの減少、取引の減少など、いくつかの課題をもたらしました。一方、ロックダウンや旅行禁止、社会的孤立により、多くの人が長時間同じ場所で座って仕事をしなければならず、不快感、こわばり、筋肉の緊張などの症状を引き起こし、姿勢に関する多くの問題を悪化させています。その結果、座りっぱなしの生活、悪い姿勢、慢性的な痛みなどの問題が生じています。また、パンデミックにより、公園やスポーツジムなどに足を運ぶことが難しくなり、座りっぱなしの生活が多くなっています。
さらに、長時間座っていると、椎間板や背中の筋肉に負担がかかり、腰痛を引き起こします。そのため、姿勢の維持・向上のために姿勢矯正グッズが使われるようになり、需要が高まっています。背もたれ、ランバーサポート付き背もたれクッション、姿勢矯正チェアなど、仕事中の姿勢改善や慢性的な痛みの軽減をサポートする製品の需要が高まっています。そのため、姿勢矯正器の市場はパンデミックにより拡大しました。
また、高齢者人口の増加や、子供たちの姿勢に対する意識の高まりも、姿勢矯正器の市場にプラスの影響を及ぼしています。例えば、オーストラリア・ビクトリア州の州政府では、定期的な運動やストレッチ、人間工学に基づいた家具、体の感覚に注意を払うなど、人々の姿勢を改善するための計画を提供しています。また、政府による様々なメディアを通じた啓蒙活動や、企業による姿勢矯正の取り組みも盛んに行われています。市場拡大の大きな力となっているのは、自然に姿勢を改善する傾向が高まっていることです。ミレニアル世代は、姿勢の歪みが引き起こす問題を認識しています。この問題を回避するために予防策を講じており、そのために姿勢矯正器が利用されているのです。若者の姿勢矯正器の利用が増えたことで、市場収益が増加しています。
また、姿勢矯正チェアの需要増も市場成長に寄与すると推定される要因の一つです。働く人の多くはデスクワークをしているため、慢性的な痛みや筋骨格系の損傷など、長期的な健康状態や生産性を損なう可能性が高くなります。姿勢を正し、健康的な働き方をすることがいかに重要であるかを多くの人が認識するようになり、姿勢矯正椅子のニーズは高まっています。背骨のアライメントを改善するために、姿勢矯正椅子にはヘッドレストとランバーサポートが内蔵されています。そのため、背中の痛みが軽減され、体のさまざまな部分をサポートすることができます。しかし、仕事中に長時間座ることを選択する人が増えているため、姿勢矯正椅子のニーズは高まっています。
姿勢矯正市場のレポートハイライト
2021年の市場規模は10億1000万米ドルで、予測期間中はCAGR7.9%で成長すると予想されます。
世界中で姿勢を完璧にする傾向が高まっていること。これが市場成長への主要な貢献要因の1つとなっています。
製品別では、2021年にキネシオロジーテープが主流となりました。スポーツによる怪我を減少させるため、スポーツにおいて非常に有用です。膝などの関節に貼ることで、関節のスペースを広げ、ケガを予防することができます。血流が良くなる可能性もあります。
しかし、キネシオロジーテープ部門は、最も速く成長すると予想されています。
販売チャネル別では、薬局・小売店とeコマースで構成されています。薬局・小売店セグメントは2021年に市場で最大のシェアを占め、また予測期間中に最も高いCAGRを記録すると予想されます。製品の入手が容易であることが、このセグメントを推進する主な要因の1つです。
目次
第1章 調査手法と範囲
- 市場セグメンテーションと範囲
- 調査手法
- 情報調達
- 購入したデータベース:
- GVRの内部データベース
- 二次情報
- 1次調査:
- 1次調査内容
- 情報またはデータ分析
- データ分析モデル
- 市場の策定と検証
- モデルの詳細
- コモディティフロー分析(モデル1)
- アプローチ1:コモディティフローアプローチ
- コモディティフロー分析(モデル1)
- 二次情報一覧
- 一次情報のリスト
- 報告の目的
第2章 エグゼクティブサマリー
- 市場の見通し
- 姿勢矯正市場の見通し、2017~2030年(100万)
- セグメントの見通し
- 姿勢矯正市場の概要、2021年
第3章 姿勢矯正市場の変数、動向、範囲
- 市場系列の見通し
- 浸透と成長の見通しのマッピング
- 姿勢矯正市場力学
- 市場促進要因分析
- 背骨と背中の問題の有病率の上昇
- 自然に姿勢が良くなる人気が高まる
- 子供たちの間で、完璧な姿勢の利点に対する意識の高まり
- 技術の進歩
- 市場抑制要因分析
- 姿勢矯正製品の認知度が低い
- 市場促進要因分析
- 姿勢矯正市場分析ツール:ポーターのファイブフォース分析
- サプライヤーの力:
- バイヤーの力:
- 代替品の脅威:
- 新規参入業者の脅威:
- 競争企業間の敵対関係:
- PESTLE分析
- 政治と法律の情勢
- 経済情勢
- 社会情勢
- テクノロジー情勢
- 環境情勢
- 規制の枠組み
- 投資機会分析
- 価格分析
- 臨床試験分析
- 技術動向分析
- COVID-19影響分析
- 現在および将来の影響分析
- COVID-19が市場関係者に与える影響
第4章 競合情勢
- 市場参加の分類
- 競合ダッシュボード分析
- 公開会社
- 企業の市場シェア/ポジション分析
- ヒートマップ分析
- 企業の詳細リスト
- 代理店一覧
第5章 姿勢矯正市場:セグメント分析、製品タイプ、2017年から2030年(100万米ドル)
- 製品変動分析、2021年および2030年
- 座位補助具
- キネシオロジーテープ
- 姿勢ブレース
- その他
第6章 姿勢矯正市場:セグメント分析、エンドユーザー別、2017年から2030年(100万米ドル)
- エンドユーザーの変動分析、2021年と2030年
- キッズ
- 大人
- 高齢者
第7章 姿勢矯正市場分析、流通チャネル別、2017年から2030年(収益、100万米ドル)
- 流通チャネルの変動分析と市場シェア、2021年と2030年
- 薬局と小売店
- eコマース
第8章 姿勢矯正市場:地域市場分析、製品タイプ別、エンドユーザー別、分布別、2017年から2030年(100万米ドル)
- 市場規模、予測、量、トレンド分析、2017年から2030年
- 北米
- 米国
- カナダ
- 欧州
- 英国
- ドイツ
- スペイン
- フランス
- イタリア
- アジア太平洋地域
- 日本
- 中国
- オーストラリア
- インド
- 韓国
- ラテンアメリカ
- ブラジル
- アルゼンチン
- メキシコ
- MEA
- 南アフリカ
- サウジアラビア
- イスラエル
第9章 企業プロファイル
- BackJoy
- 会社概要
- 財務実績
- 製品のベンチマーク
- 戦略的イニシアチブ
- Swedish Posture
- 会社概要
- 財務実績
- 製品のベンチマーク
- Acorn International
- 会社概要
- 財務実績
- 製品のベンチマーク
- 戦略的イニシアチブ
- Upright
- 会社概要
- 財務実績
- 製品のベンチマーク
- 戦略的イニシアチブ
- Aspen Medical Products, LLC
- 会社概要
- 財務実績
- 製品のベンチマーク
- 戦略的イニシアチブ
- Evoke Pro
- 会社概要
- 財務実績
- 製品のベンチマーク
- 戦略的イニシアチブ
- Comfy Brace
- 会社概要
- 財務実績
- 製品のベンチマーク
- 戦略的イニシアチブ
- ITA-Med Co.
- 会社概要
- 財務実績
- 製品のベンチマーク
- 戦略的イニシアチブ
- Super Ortho
- 会社概要
- 財務実績
- 製品のベンチマーク
- 戦略的イニシアチブ
- Ottobock
- 会社概要
- 財務実績
- 製品のベンチマーク
- 戦略的イニシアチブ
List of Tables
- Table 1. List of secondary sources
- Table 2. List of key companies
- Table 3. North America Posture Correction market, by country, 2017 - 2030 (USD Million)
- Table 4. North America Posture Correction market, by product, 2017 - 2030 (USD Million)
- Table 5. North America Posture Correction market, by distribution channel, 2017 - 2030 (USD Million)
- Table 6. North America Posture Correction market, by end-use, 2017 - 2030 (USD Million)
- Table 7. U.S. Posture Correction market, by product, 2017 - 2030 (USD Million)
- Table 8. U.S. Posture Correction market, by distribution channel, 2017 - 2030 (USD Million)
- Table 9. U.S. Posture Correction market, by end use, 2017 - 2030 (USD Million)
- Table 10. Canada Posture Correction market, by product, 2017 - 2030 (USD Million)
- Table 11. Canada Posture Correction market, by distribution channel, 2017 - 2030 (USD Million)
- Table 12. Canada Posture Correction market, by end use, 2017 - 2030 (USD Million)
- Table 13. Europe Posture Correction market, by country, 2017 - 2030 (USD Million)
- Table 14. Europe Posture Correction market, by product, 2017 - 2030 (USD Million)
- Table 15. Europe Posture Correction market, by distribution channel, 2017 - 2030 (USD Million)
- Table 16. Europe Posture Correction market, by end use, 2017 - 2030 (USD Million)
- Table 17. U.K. America Posture Correction market, by product, 2017 - 2030 (USD Million)
- Table 18. U.K. Posture Correction market, by distribution channel, 2017 - 2030 (USD Million)
- Table 19. U.K. Posture Correction market, by end use, 2017 - 2030 (USD Million)
- Table 20. Germany Posture Correction market, by product, 2017 - 2030 (USD Million)
- Table 21. Germany Posture Correction market, by distribution channel, 2017 - 2030 (USD Million)
- Table 22. Germany Posture Correction market, by end use, 2017 - 2030 (USD Million)
- Table 23. France Posture Correction market, by product, 2017 - 2030 (USD Million)
- Table 24. France Posture Correction market, by distribution channel, 2017 - 2030 (USD Million)
- Table 25. France Posture Correction market, by end use, 2017 - 2030 (USD Million)
- Table 26. Italy Posture Correction market, by product, 2017 - 2030 (USD Million)
- Table 27. Italy Posture Correction market, by distribution channel, 2017 - 2030 (USD Million)
- Table 28. Italy Posture Correction market, by end use, 2017 - 2030 (USD Million)
- Table 29. Spain Posture Correction market, by product, 2017 - 2030 (USD Million)
- Table 30. Spain Posture Correction market, by distribution channel, 2017 - 2030 (USD Million)
- Table 31. Spain Posture Correction market, by end use, 2017 - 2030 (USD Million)
- Table 32. Asia pacific Posture Correction market, by country, 2017 - 2030 (USD Million)
- Table 33. Asia Pacific Posture Correction market, by product, 2017 - 2030 (USD Million)
- Table 34. Asia Pacific Posture Correction market, by distribution channel, 2017 - 2030 (USD Million)
- Table 35. Asia Pacific Posture Correction market, by end use, 2017 - 2030 (USD Million)
- Table 36. China Posture Correction market, by product, 2017 - 2030 (USD Million)
- Table 37. China Posture Correction market, by distribution channel, 2017 - 2030 (USD Million)
- Table 38. China Posture Correction market, by end use, 2017 - 2030 (USD Million)
- Table 39. Japan Posture Correction market, by product, 2017 - 2030 (USD Million)
- Table 40. Japan Posture Correction market, by distribution channel, 2017 - 2030 (USD Million)
- Table 41. Japan Posture Correction market, by end use, 2017 - 2030 (USD Million)
- Table 42. India Posture Correction market, by product, 2017 - 2030 (USD Million)
- Table 43. India Posture Correction market, by distribution channel, 2017 - 2030 (USD Million)
- Table 44. India Posture Correction market, by end use, 2017 - 2030 (USD Million)
- Table 45. Australia Posture Correction market, by product, 2017 - 2030 (USD Million)
- Table 46. Australia Posture Correction market, by distribution channel, 2017 - 2030 (USD Million)
- Table 47. Australia Posture Correction market, by end use, 2017 - 2030 (USD Million)
- Table 48. South Korea Posture Correction market, by product, 2017 - 2030 (USD Million)
- Table 49. South Korea Posture Correction market, by distribution channel, 2017 - 2030 (USD Million)
- Table 50. South Korea Posture Correction market, by end use, 2017 - 2030 (USD Million)
- Table 51. LATAM Posture Correction market, by country, 2017 - 2030 (USD Million)
- Table 52. LATAM Posture Correction market, by product, 2017 - 2030 (USD Million)
- Table 53. LATAM Posture Correction market, by distribution channel, 2017 - 2030 (USD Million)
- Table 54. LATAM Posture Correction market, by end use, 2017 - 2030 (USD Million)
- Table 55. Brazil Posture Correction market, by product, 2017 - 2030 (USD Million)
- Table 56. Brazil Posture Correction market, by distribution channel, 2017 - 2030 (USD Million)
- Table 57. Brazil Posture Correction market, by end use, 2017 - 2030 (USD Million)
- Table 58. Mexico Posture Correction market, by product, 2017 - 2030 (USD Million)
- Table 59. Mexico Posture Correction market, by distribution channel, 2017 - 2030 (USD Million)
- Table 60. Mexico Posture Correction market, by end use, 2017 - 2030 (USD Million)
- Table 61. Argentina Posture Correction market, by product, 2017 - 2030 (USD Million)
- Table 62. Argentina Posture Correction market, by distribution channel, 2017 - 2030 (USD Million)
- Table 63. Argentina Posture Correction market, by end use, 2017 - 2030 (USD Million)
- Table 64. MEA Posture Correction market, by country, 2017 - 2030 (USD Million)
- Table 65. MEA Posture Correction market, by product, 2017 - 2030 (USD Million)
- Table 66. MEA Posture Correction market, by distribution channel, 2017 - 2030 (USD Million)
- Table 67. MEA Posture Correction market, by end use, 2017 - 2030 (USD Million)
- Table 68. South Africa Posture Correction market, by product, 2017 - 2030 (USD Million)
- Table 69. South Africa Posture Correction market, by distribution channel, 2017 - 2030 (USD Million)
- Table 70. South Africa Posture Correction market, by end use, 2017 - 2030 (USD Million)
- Table 71. Saudi Arabia Posture Correction market, by product, 2017 - 2030 (USD Million)
- Table 72. Saudi Arabia Posture Correction market, by distribution channel, 2017 - 2030 (USD Million)
- Table 73. Saudi Arabia Posture Correction market, by end use, 2017 - 2030 (USD Million)
- Table 74. Israel Posture Correction market, by product, 2017 - 2030 (USD Million)
- Table 75. Israel Posture Correction market, by distribution channel, 2017 - 2030 (USD Million)
- Table 76. Israel Posture Correction market, by end use, 2017 - 2030 (USD Million)
- Table 77. Global Posture Correction market, by region, 2017 - 2030 (USD Million)
- Table 78. Global Posture Correction market, by product, 2017 - 2030 (USD Million)
- Table 79. Global Posture Correction market, by distribution channel, 2017 - 2030 (USD Million)
- Table 80. Global Posture Correction market, by end use, 2017 - 2030 (USD Million)
List of Figures
- Fig. 1 Market segmentation
- Fig. 2 Market research process
- Fig. 3 Data triangulation techniques
- Fig. 4 Primary research pattern
- Fig. 5 Market research approaches
- Fig. 6 Value-chain-based sizing & forecasting
- Fig. 7 QFD Modeling for market share assessment
- Fig. 8 Market formulation & validation
- Fig. 9 Commodity flow analysis
- Fig. 10 Segment-Based Penetration Model
- Fig. 11 Market summary (2021, Million)
- Fig. 12 Segment Outlook, By Product Type
- Fig. 13 Segment outlook, By End-User
- Fig. 14 Segment Outlook, By Distribution Channel
- Fig. 15 Penetration & growth prospect mapping, 2021
- Fig. 16 Market variable analysis
- Fig. 17 Market driver relevance analysis (Current & future impact)
- Fig. 18 Market restraint relevance analysis (Current & future impact)
- Fig. 19 Posture Correction Market: By Product Type Movement Analysis, 2021 & 2030
- Fig. 20 Global Kinesiology Tape Market, 2017 - 2030 (Million)
- Fig. 21 Global Sitting Support Devices market, 2017 - 2030 (Million)
- Fig. 22 Global Posture Braces Benefit market, 2017 - 2030 (Million)
- Fig. 23 Global Others Benefit market, 2017 - 2030 (Million)
- Fig. 24 Posture Correction Market: By End-User Movement Analysis, 2021 & 2030
- Fig. 25 Global Kids market, 2017 - 2030 (Million)
- Fig. 26 Global Adults market, 2017 - 2030 (Million)
- Fig. 27 Global Geriatric market, 2017 - 2030 (Million)
- Fig. 28 Posture Correction Market: By Distribution Channel Movement Analysis, 2021 & 2030
- Fig. 29 Global Pharmacies & Retail Stores market, 2017 - 2030 (Million)
- Fig. 30 Global E-Commerce Market, 2017 - 2030 (Million
- Fig. 31 Regional marketplace: Key takeaways
- Fig. 32 Regional outlook, 2021 & 2030
- Fig. 33 North America Posture Correction Market, 2017 - 2030 (Million)
- Fig. 34 U.S. Posture Correction Market, 2017 - 2030 (Million)
- Fig. 35 Canada Posture Correction Market, 2017 - 2030 (Million)
- Fig. 36 Europe Posture Correction Market, 2017 - 2030 (Million)
- Fig. 37 U.K. Posture Correction Market, 2017 - 2030 (Million)
- Fig. 38 Germany Posture Correction Market, 2017 - 2030 (Million)
- Fig. 39 France Posture Correction Market, 2017 - 2030 (Million)
- Fig. 40 Italy Posture Correction Market, 2017 - 2030 (Million)
- Fig. 41 Spain Posture Correction Market, 2017 - 2030 (Million)
- Fig. 42 Asia Pacific Posture Correction Market, 2017 - 2030 (Million)
- Fig. 43 Japan Posture Correction Market, 2017 - 2030 (Million)
- Fig. 44 China Posture Correction Market, 2017 - 2030 (Million)
- Fig. 45 India Posture Correction Market, 2017- 2030 (Million)
- Fig. 46 South Korea Posture Correction Market, 2017 - 2030 (Million)
- Fig. 47 Australia America Posture Correction Market, 2017 - 2030 (Million)
- Fig. 48 Latin America Posture Correction Market, 2017 - 2030 (Million)
- Fig. 49 Brazil Posture Correction Market, 2017 - 2030 (Million)
- Fig. 50 Argentina Posture Correction Market, 2017 - 2030 (Million)
- Fig. 51 Mexico Posture Correction Market, 2017 - 2030 (Million)
- Fig. 52 MEA Posture Correction Market, 2017 - 2030 (Million)
- Fig. 53 South Africa Posture Correction Market, 2017 - 2030 (Million)
- Fig. 54 Saudi Arabia Posture Correction Market, 2017 - 2030 (Million)
- Fig. 55 Israel Posture Correction Market, 2017 - 2030 (Million)
- Fig. 56 Market Participation Categorization
- Fig. 57 Company market position analysis
Posture Correction Market Growth & Trends:
The global posture correction market size is anticipated to reach USD 1.99 billion by 2030, according to a new report by Grand View Research, Inc. The market is expected to expand at a lucrative CAGR of 7.9% from 2022 to 2030. The key factors driving the market growth include the rising number of back pain issues across the globe and the aging population. For instance, as per the NCBI in February 2022, back pain is a common condition among adults, up to 23% of people worldwide experience chronic low back pain.
The COVID-19 pandemic resulted in several challenges such as logistical blocks, low demand, decreased sales & marketing events, and reduced deals. On the other hand, lockdowns travel bans, and social isolation have made many posture-related issues worse as the most population had to work long period of durations while being seated at a one place which causes conditions including discomfort, stiffness, and muscle strain. However, sedentary lifestyles, bad posture, and chronic pain are the results. In addition, the pandemic has made it difficult for individuals to visit parks, gyms, and other activities, which has made their lives more sedentary.
Furthermore, long periods of sitting put more strain on the spinal disc and back muscles, resulting in back pain. Therefore, people use posture corrector goods to maintain and enhance their posture, which is driving up demand for these items. Products like backrests, lumbar support backrest cushions, and posture corrector chairs that assist people to improve their posture and lessen chronic pain while working are becoming more and more in demand. Therefore, the market for posture correctors has expanded due to the pandemic.
The market for posture correctors has been positively impacted by both the older population's growth and children's increased awareness of the advantages of good posture. For instance, Victoria State Government which is the state-level authority for Victoria, Australia provides plans to improve people's posture which includes regular exercise and stretching, ergonomic furniture, and paying attention to the way the body feels. In addition, governments are attempting to raise awareness about numerous ongoing problems through a variety of media, and numerous businesses are seeking to correct posture deformities. One of the main forces for market expansion is the rising trend of naturally improving posture. Millennials are aware of the issues posture deformity can cause. They are taking preventative measures to avoid this issue, which is why posture correctors are being used. The increased use of posture correctors by young people has increased market revenue.
In addition, increasing demand for posture correction chairs is another driver estimated to contribute to the market growth. Since most people who work have desk jobs, they are more likely to experience chronic pain, musculoskeletal injuries, and other conditions that could harm their long-term health and productivity. The need for posture corrector chairs is rising as more people realize how crucial it is to adopt healthy working practices that promote posture. For improved spine alignment, posture corrector chairs have built-in headrests and lumbar supports. Hence, back pain is reduced, and various body parts are supported by posture correction chairs. But as more people choose to sit for extended periods while working, the need for posture correction chairs is rising.
Posture Correction Market Report Highlights:
- The market was valued at USD 1.01 billion in 2021 and is expected to grow at a CAGR of 7.9% during the forecast period.
- Rising trend of perfecting the posture around the globe. This is one of the key contributing factors towards market growth.
- The product segment was dominated by kinesiology tape in 2021. It is very useful in sports because it decreases injuries from sports. By adhering it to the knee or any other joint, injuries can be prevented by expanding the joint space. Potentially, it will increase blood flow.
- The kinesiology tape segment, however, is also anticipated to grow the fastest.
- By distribution channel, the Posture Correction Market comprises of pharmacies & retail stores and e-commerce. The pharmacies & retail stores segment held the largest share of the market in 2021 and is also expected to register the highest CAGR during the forecast period. Easy availability of product is one of the primary factors driving this segment.
Table of Contents
Chapter 1 Research Methodology & Scope
- 1.1 Market Segmentation & Scope
- 1.1.1 Estimates and Forecast Timeline
- 1.2 Research Methodology
- 1.3 Information Procurement
- 1.3.1 Purchased Database:
- 1.3.2 GVR's Internal Database
- 1.3.3 Secondary Sources
- 1.3.4 Primary Research:
- 1.3.5 Details of Primary Research
- 1.4 Information or Data Analysis
- 1.4.1 Data Analysis Models
- 1.5 Market Formulation & Validation
- 1.6 Model Details
- 1.6.1 Commodity Flow Analysis (Model 1)
- 1.6.1.1 Approach 1: Commodity Flow Approach
- 1.6.1 Commodity Flow Analysis (Model 1)
- 1.7 List of Secondary Sources
- 1.8 List of Primary Sources
- 1.9 Report Objectives
Chapter 2 Executive Summary
- 2.1 Market Outlook
- 2.1.1 Posture Correction Market Outlook, 2017 - 2030 (Million)
- 2.2 Segment Outlook
- 2.3 Posture Correction Market Summary, 2021
Chapter 3 Posture Correction Market Variables, Trends & Scope
- 3.1 Market Lineage Outlook
- 3.2 Penetration & Growth Prospect Mapping
- 3.3 Posture Correction Market Dynamics
- 3.3.1 Market Driver Analysis
- 3.3.1.1 Rising prevalence of spine and back problems
- 3.3.1.2 Growing popularity of naturally improving posture
- 3.3.1.3 The rise in awareness of the benefits of the perfect posture among kids
- 3.3.1.4 Technological advancement
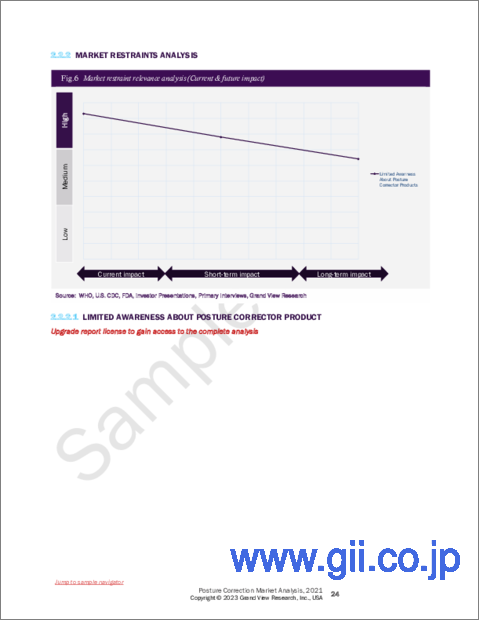
- 3.3.2 Market Restraints Analysis
- 3.3.2.1 Limited awareness about posture corrector product
- 3.3.1 Market Driver Analysis
- 3.4 Posture Correction Market Analysis Tools: Porter's Five Forces Analysis
- 3.4.1 Supplier Power:
- 3.4.2 Buyer Power:
- 3.4.3 Threat of Substitutes:
- 3.4.4 Threat of New Entrants:
- 3.4.5 Competitive Rivalry:
- 3.5 PESTLE Analysis
- 3.5.1 Political & Legal Landscape
- 3.5.2 Economic Landscape
- 3.5.3 Social Landscape
- 3.5.4 Technology Landscape
- 3.5.5 Environmental Landscape
- 3.6 Regulatory Framework
- 3.7 Investment Opportunity Analysis
- 3.8 Pricing Analysis
- 3.9 Clinical Trials Analysis
- 3.10 Technology Trends Analysis
- 3.11 COVID-19 Impact Analysis
- 3.11.1 Current and Future Impact Analysis
- 3.11.2 Impact of COVID-19 On Market Players
Chapter 4 Competitive Landscape
- 4.1 Market Participation Categorization
- 4.2 Competitive Dashboard Analysis
- 4.3 Public Companies
- 4.3.1 Company Market Share/Position Analysis
- 4.3.2 Heat Map Analysis
- 4.4 Detailed List of Players
- 4.5 List of Distributors
Chapter 5 Posture Correction Market: Segment Analysis, By Product Type, 2017 - 2030 (USD Million)
- 5.1 Product Movement Analysis, 2021 & 2030
- 5.1.1 Sitting Support Devices
- 5.1.1.1 Sitting Support Devices Market Estimates and Forecasts, 2017 - 2030 (Million)
- 5.1.2 Kinesiology Tape
- 5.1.2.1 Kinesiology Tape Market Estimates and Forecasts, 2017 - 2030 (Million)
- 5.1.3 Posture Braces
- 5.1.3.1 Posture Braces Market Estimates and Forecasts, 2017 - 2030 (Million)
- 5.1.4 Others
- 5.1.4.1 Posture Braces Market Estimates and Forecasts, 2017 - 2030 (Million)
- 5.1.1 Sitting Support Devices
Chapter 6 Posture Correction Market: Segment Analysis, By End-User, 2017 - 2030 (USD Million)
- 6.1 End-User Movement Analysis, 2021 & 2030
- 6.1.1 Kids
- 6.1.1.1 Kids Market Estimates and Forecasts, 2017 - 2030 (Million)
- 6.1.2 Adults
- 6.1.2.1 Adults Market Estimates and Forecasts, 2017 - 2030 (Million)
- 6.1.3 Geriatric
- 6.1.3.1 Geriatric Market Estimates and Forecasts, 2017 - 2030 (Million)
- 6.1.1 Kids
Chapter 7 Posture Correction Market Analysis, By Distribution Channel, 2017 - 2030 (Revenue, USD Million)
- 7.1 Distribution Channel Movement Analysis & Market Share, 2021 & 2030
- 7.1.1 Pharmacies & Retail Stores
- 7.1.1.1 Pharmacies & Retail Stores Market Estimates and Forecasts, 2017 - 2030 (Million)
- 7.1.2 E-Commerce
- 7.1.2.1 E-Commerce Market Estimates and Forecasts, 2017 - 2030 (Million)
- 7.1.1 Pharmacies & Retail Stores
Chapter 8 Posture Correction Market: Regional Market Analysis, By Product Type, By End-User, By Distribution, 2017 - 2030 (USD Million)
- 8.1 Market Size, & Forecasts, Volume, And Trend Analysis, 2017 To 2030
- 8.2 North America
- 8.2.1 North America Posture Correction Market Estimates and Forecasts, 2017 - 2030 (Million)
- 8.2.2 U.S.
- 8.2.2.1 U.S. Posture Correction Market Estimates and Forecasts, 2017 - 2030 (Million)
- 8.2.3 Canada
- 8.2.3.1 Canada Posture Correction Market Estimates and Forecasts, 2017 - 2030 (Million)
- 8.3 Europe
- 8.3.1 Europe Posture Correction Market Estimates and Forecasts, 2017 - 2030 (Million)
- 8.3.2 U.K.
- 8.3.2.1 U.K. Posture Correction Market Estimates and Forecasts, 2017 - 2030(Million)
- 8.3.3 Germany
- 8.3.3.1 Germany Posture Correction Market Estimates and Forecasts, 2017 - 2030 (Million)
- 8.3.4 Spain
- 8.3.4.1 Spain Posture Correction Market Estimates and Forecasts, 2017 - 2030 (Million)
- 8.3.4 France
- 8.3.4.1 France Posture Correction Market Estimates and Forecasts, 2017 - 2030 (Million)
- 8.3.6 Italy
- 8.3.6.1 Italy Posture Correction Market Estimates and Forecasts, 2017 - 2030 (Million)
- 8.4 Asia Pacific
- 8.4.1 Asia Pacific Posture Correction Market Estimates and Forecasts, 2017 - 2030 (Million)
- 8.4.2 Japan
- 8.4.2.1 Japan Posture Correction Market Estimates and Forecasts, 2017 - 2030 (Million)
- 8.4.3 China
- 8.4.3.1 China Posture Correction Market Estimates and Forecasts, 2017 - 2030 (Million)
- 8.4.4 Australia
- 8.4.4.1 Australia Posture Correction Market Estimates and Forecasts, 2017 - 2030 (Million)
- 8.4.5 India
- 8.4.5.1 India Posture Correction Market Estimates and Forecasts, 2017 - 2030 (Million)
- 8.4.6 South Korea
- 8.4.6.1 South Korea Posture Correction Market Estimates and Forecasts, 2017 - 2030 (Million)
- 8.5 Latin America
- 8.5.1 Latin America Posture Correction Market Estimates and Forecasts, 2017 - 2030 (Million)
- 8.5.2 Brazil
- 8.5.2.1 Brazil Posture Correction Market Estimates and Forecasts, 2017 - 2030 (Million)
- 8.5.3 Argentina
- 8.5.3.1 Argentina Posture Correction Market Estimates and Forecasts, 2017 - 2030 (Million)
- 8.5.4 Mexico
- 8.5.4.1 Mexico Posture Correction Market Estimates and Forecasts, 2017 - 2030 (Million)
- 8.6 MEA
- 8.6.1 MEA Posture Correction Market Estimates and Forecasts, 2017 - 2030 (Million)
- 8.6.2 South Africa
- 8.6.2.1 South Africa Posture Correction Market Estimates and Forecasts, 2017 - 2030 (Million)
- 8.6.3 Saudi Arabia
- 8.6.3.1 Saudi Arabia Posture Correction Market Estimates and Forecasts, 2017 - 2030 (Million)
- 8.6.4 Israel
- 8.6.4.1 Israel Posture Correction Market Estimates and Forecasts, 2017 - 2030 (Million)
Chapter 9 Company Profiles
- 9.1 BackJoy
- 9.1.1 Company Overview
- 9.1.2 Financial Performance
- 9.1.3 Product Benchmarking
- 9.1.4 Strategic Initiatives
- 9.2 Swedish Posture
- 9.2.1 Company Overview
- 9.2.2 Financial Performance
- 9.2.3 Product Benchmarking
- 9.3 Acorn International
- 9.3.1 Company Overview
- 9.3.2 Financial Performance
- 9.3.3 Product Benchmarking
- 9.3.4 Strategic Initiatives
- 9.4 Upright
- 9.4.1 Company Overview
- 9.4.2 Financial Performance
- 9.4.3 Product Benchmarking
- 9.4.4 Strategic Initiatives
- 9.5 Aspen Medical Products, LLC
- 9.5.1 Company Overview
- 9.5.2 Financial Performance
- 9.5.3 Product Benchmarking
- 9.5.4 Strategic Initiatives
- 9.6 Evoke Pro
- 9.6.1 Company Overview
- 9.6.2 Financial Performance
- 9.6.3 Product Benchmarking
- 9.6.4 Strategic Initiatives
- 9.7 Comfy Brace
- 9.7.1 Company Overview
- 9.7.2 Financial Performance
- 9.7.3 Product Benchmarking
- 9.7.4 Strategic Initiatives
- 9.8 ITA-Med Co.
- 9.8.1 Company Overview
- 9.8.2 Financial Performance
- 9.8.3 Product Benchmarking
- 9.8.4 Strategic Initiatives
- 9.9 Super Ortho
- 9.9.1 Company Overview
- 9.9.2 Financial Performance
- 9.9.3 Product Benchmarking
- 9.9.4 Strategic Initiatives
- 9.10 Ottobock
- 9.10.1 Company Overview
- 9.10.2 Financial Performance
- 9.10.3 Product Benchmarking
- 9.10.4 Strategic Initiatives