|
|
市場調査レポート
商品コード
1122158
双胴船の市場規模、シェア、動向分析レポート:製品別(セーリング双胴船、パワー双胴船)、サイズ別(小型、中型、大型)、用途別(スポーツ、レジャー、輸送)、地域別、セグメント別予測、2022年~2030年Catamaran Market Size, Share & Trends Analysis Report By Product (Sailing Catamarans, Power Catamarans), By Size (Small, Medium, Large), By Application (Sport, Leisure, Transport), By Region, And Segment Forecasts, 2022 - 2030 |
||||||
|
|
|||||||
|
● お客様のご希望に応じて、既存データの加工や未掲載情報(例:国別セグメント)の追加などの対応が可能です。 詳細はお問い合わせください。 |
|||||||


| 双胴船の市場規模、シェア、動向分析レポート:製品別(セーリング双胴船、パワー双胴船)、サイズ別(小型、中型、大型)、用途別(スポーツ、レジャー、輸送)、地域別、セグメント別予測、2022年~2030年 |
|
出版日: 2022年08月10日
発行: Grand View Research
ページ情報: 英文 100 Pages
納期: 2~10営業日
|
- 全表示
- 概要
- 図表
- 目次
双胴船市場の成長と動向
Grand View Research社の最新レポートによると、世界の双胴船市場規模は2030年までに22億3000万米ドルに達すると予測されています。同市場は2022年から2030年にかけてCAGR5.8%で拡大すると予測されています。レジャー観光やレースイベントの増加、世界中の人々の可処分所得の増加が、双胴船産業の成長を促進する主な要因の一つです。
双胴船は、2つの平行な船体を1つの甲板で繋いでいます。2つの船体で構成されているため、2つの船体の間にあるコックピットやリビングルームに十分なスペースがあり、モノハルよりも大きな内部空間を持っています。遠くの場所から別の場所へ移動する間、双胴船の存在意義は大きいです。海上観光が盛んになり、豪華な休暇を好む人々が増えたため、ビジネスが急速に拡大しています。
双胴船は、主にレジャーを好み、旅費に余裕のある富裕層(HNWI)の間で有名です。双胴船の人気の理由は、その大きさと安定性にあります。双胴船の2つの船体の間には、デッキの下にも上にもスペースがある傾向があります。双胴船を使用する利点の一部をご紹介します。
ボートメーカーが超大型化造船所の規模は常に拡大しており、ボートメーカーは思い切ってスケールとスピードの限界に課題する大胆な設計を行うようになってきています。その結果、双胴船はより大規模に、より軽量になりつつあります。例えば、Sunreef Yachtsは、その船隊規模を徐々に拡大し、2022年にはSunreef 49 Power Catモデルを納入し、これは現在、160フィートの船隊で最大のヨットです。
安定性の向上、すなわち船酔いの軽減。双胴船の2船体構造と広いビームは、ローリングの少ない穏やかなセイリングを実現し、船酔いしやすいゲストに最適です。マルチハルの双胴船は、より大きな表面積を持つため、より安定性が高いです。
単胴船と同じ大きさの双胴船は、より高価です。ボートを購入すると、別途ランニングコストやメンテナンス費用(=所有コスト)がかかります。例えば、購入後、個人はより重要で包括的なマリーナのスリップを支払う必要があり、双胴船は2つのエンジンを持っているので燃料費がすぐに蓄積されます。
また、双胴船の欠点としてよく言われるのが、万が一転覆した場合に「自立」できないことです。モノハル・ヨットは、嵐で大波にさらわれたときでも、自力で転覆しないように設計されています。しかし、双胴船(双胴船)は、その定義からして、このようなことはできないです。
双胴船は、設計や技術の進歩により、より速く、より燃費の良いボートを製造しています。その結果、多くの忠実なモノハルオーナーが双胴船オーナーに転向しています。2021年11月、Servo Yachts LLCは、ゲストの船酔いを治療する革新的な技術を備えた165フィートの双胴船艇、The Martini 7.0をデビューさせました。
双胴船市場のレポートハイライト
双胴船は、他の高価なレジャー観光と同じです。富裕層の家族、裕福な個人、そしてさまざまな体験をしたい十分な資金がある人は、安全であることを条件に双胴船にお金を払うことを望んでいます。
2022年1月、乗客に船酔い治療を施す独自の技術を搭載した165フィートの双胴船ヨット「マルティーニ7.0」がサーボヨットによって発表されました。英国を拠点とするシャトルワース・デザイン社との提携により誕生したマルティーニ7.0は、斬新な海上安定化技術により、ヨットが水面をよりソフトに滑走し、ゲストがしばしば船酔いをするような動きを排除することができます。
パワー双胴船は、2022年から2030年にかけてCAGR6.2%で拡大し、主要な市場シェアを占めると推定されます。
小型双胴船セグメントは、予測期間中に最も高いCAGRで前進すると予測されます。
スポーツ用途の双胴船市場は、評価期間中に最も高いCAGRで拡大すると予測されます。
業界の主要な企業は、 African Cats., Bavaria Catamarans, Beneteau Group、CATATHAI などです。
目次
第1章 調査手法と範囲
- 調査手法
- 調査範囲と前提
- データソースのリスト
- 略語一覧
第2章 エグゼクティブサマリー
- 市場の洞察
- 市場のスナップショット
- セグメントの洞察
第3章 市場変数、動向、および範囲の見通し
- 市場セグメンテーション
- 双胴船の市場規模と成長見通し
- 双胴船市場-バリューチェーン分析
- 双胴船市場力学
- 市場促進要因分析
- 市場制約分析
- 市場機会分析
- 双胴船の浸透と成長の見通しのマッピング
- 双胴船市場- ポーターのファイブフォース分析
- サプライヤーの力
- 買い手の交渉力
- 代替の脅威
- 新規参入者からの脅威
- 競争企業間の敵対関係
- 双胴船市場PEST分析
- 政治情勢
- 経済情勢
- 社会情勢
- テクノロジー情勢
- COVID-19影響分析
第4章 双胴船市場の製品展望
- 双胴船市場、製品分析と市場シェア別、2021年と2030年
- セーリング双胴船
- スポーツ
- レジャー
- 輸送
- その他
- パワー双胴船
- スポーツ
- レジャー
- 輸送
- その他
第5章 双胴船市場規模の見通し
- 双胴船市場、サイズ分析と市場シェア別、2021年と2030年
- 小さな
- 中くらい
- 大きい
第6章 双胴船市場のアプリケーションの見通し
- 双胴船市場、アプリケーション分析と市場シェア別、2021年と2030年
- スポーツ
- レジャー
- 輸送
- その他
第7章 双胴船市場:地域の推定・動向分析
- 地域別双胴船市場シェア、2021年および2030年
- 北米
- 米国
- カナダ
- 欧州
- 英国
- ドイツ
- フランス
- イタリア
- スペイン
- アジア太平洋
- 中国
- 日本
- インド
- オーストラリア
- ラテンアメリカ
- メキシコ
- ブラジル
- 中東とアフリカ
第8章 競合分析
- 主要な市場参加者別最近の動向と影響分析
- 企業/競合の分類(主要なイノベーター、マーケットリーダー、新興企業、ニッチプレイヤー)
- ベンダー情勢
- 主要企業の市場シェア分析、2021年
- 企業分析ツール
- 市況分析
- 競合ダッシュボード分析
第9章 競合情勢
- 企業プロファイル
- African Cats.
- 会社概要
- 財務実績
- 製品のベンチマーク
- 戦略的イニシアチブ
- Bavaria Catamarans
- 会社概要
- 財務実績
- 製品のベンチマーク
- 戦略的イニシアチブ
- Beneteau Group
- 会社概要
- 財務実績
- 製品のベンチマーク
- 戦略的イニシアチブ
- CATATHAI
- 会社概要
- 財務実績
- 製品のベンチマーク
- 戦略的イニシアチブ
- Fountaine Pajot Catamarans
- 会社概要
- 財務実績
- 製品のベンチマーク
- 戦略的イニシアチブ
- Leopard Catamarans
- 会社概要
- 財務実績
- 製品のベンチマーク
- 戦略的イニシアチブ
- NAUTITECH
- 会社概要
- 財務実績
- 製品のベンチマーク
- 戦略的イニシアチブ
- Outremer Yachting
- 会社概要
- 財務実績
- 製品のベンチマーク
- 戦略的イニシアチブ
- Seawind
- 会社概要
- 財務実績
- 製品のベンチマーク
- 戦略的イニシアチブ
- Voyage
- 会社概要
- 財務実績
- 製品のベンチマーク
- 戦略的イニシアチブ
List of Tables
- Table 1 Global catamaran market, 2017 - 2030 (USD Million)
- Table 2 Global market estimates and forecasts by region, 2017 - 2030 (USD Million)
- Table 3 Global market estimates and forecasts by product, 2017 - 2030 (USD Million)
- Table 4 Global market estimates and forecasts by size, 2017 - 2030 (USD Million)
- Table 5 Global market estimates and forecasts by application, 2017 - 2030 (USD Million)
- Table 6 Global sailing catamaran market by region, 2017 - 2030 (USD Million)
- Table 7 Global sailing catamaran market by application, 2017 - 2030 (USD Million)
- Table 8 Global power catamaran market by region, 2017 - 2030 (USD Million)
- Table 9 Global power catamaran market by application, 2017 - 2030 (USD Million)
- Table 10 Global small catamaran market by region, 2017 - 2030 (USD Million)
- Table 11 Global medium catamaran market by region, 2017 - 2030 (USD Million)
- Table 12 Global large catamaran market by region, 2017 - 2030 (USD Million)
- Table 13 Global sports catamaran market by region, 2017 - 2030 (USD Million)
- Table 14 Global leisure catamaran market by region, 2017 - 2030 (USD Million)
- Table 15 Global transport catamaran market by region, 2017 - 2030 (USD Million)
- Table 16 Global other catamaran market by region, 2017 - 2030 (USD Million)
- Table 17 North America catamaran market by product, 2017 - 2030 (USD Million)
- Table 18 North America sailing catamaran market by application, 2017 - 2030 (USD Million)
- Table 19 North America power catamaran market by application, 2017 - 2030 (USD Million)
- Table 20 North America catamaran market by size, 2017 - 2030 (USD Million)
- Table 21 North America catamaran market by application, 2017 - 2030 (USD Million)
- Table 22 U.S. catamaran market by product, 2017 - 2030 (USD Million)
- Table 23 U.S. catamaran market by size, 2017 - 2030 (USD Million)
- Table 24 U.S. catamaran market by application, 2017 - 2030 (USD Million)
- Table 25 Canada catamaran market by product, 2017 - 2030 (USD Million)
- Table 26 Canada catamaran market by size, 2017 - 2030 (USD Million)
- Table 27 Canada catamaran market by application, 2017 - 2030 (USD Million)
- Table 28 Europe catamaran market by product, 2017 - 2030 (USD Million)
- Table 29 Europe sailing catamaran market by application, 2017 - 2030 (USD Million)
- Table 30 Europe power catamaran market by application, 2017 - 2030 (USD Million)
- Table 31 Europe catamaran market by size, 2017 - 2030 (USD Million)
- Table 32 Europe catamaran market by application, 2017 - 2030 (USD Million)
- Table 33 U.K. catamaran market by product, 2017 - 2030 (USD Million)
- Table 34 U.K. catamaran market by size, 2017 - 2030 (USD Million)
- Table 35 U.K. catamaran market by application, 2017 - 2030 (USD Million)
- Table 36 Germany catamaran market by product, 2017 - 2030 (USD Million)
- Table 37 Germany catamaran market by size, 2017 - 2030 (USD Million)
- Table 38 Germany catamaran market by application, 2017 - 2030 (USD Million)
- Table 39 France catamaran market by product, 2017 - 2030 (USD Million)
- Table 40 France catamaran market by size, 2017 - 2030 (USD Million)
- Table 41 France catamaran market by application, 2017 - 2030 (USD Million)
- Table 42 Italy catamaran market by product, 2017 - 2030 (USD Million)
- Table 43 Italy catamaran market by size, 2017 - 2030 (USD Million)
- Table 44 Italy catamaran market by application, 2017 - 2030 (USD Million)
- Table 45 Spain catamaran market by product, 2017 - 2030 (USD Million)
- Table 46 Spain catamaran market by size, 2017 - 2030 (USD Million)
- Table 47 Spain catamaran market by application, 2017 - 2030 (USD Million)
- Table 48 Asia-Pacific catamaran market by product, 2017 - 2030 (USD Million)
- Table 49 Asia-Pacific sailing catamaran market by application, 2017 - 2030 (USD Million)
- Table 50 Asia-Pacific power catamaran market by application, 2017 - 2030 (USD Million)
- Table 51 Asia-Pacific catamaran market by size, 2017 - 2030 (USD Million)
- Table 52 Asia-Pacific catamaran market by application, 2017 - 2030 (USD Million)
- Table 53 China catamaran market by product, 2017 - 2030 (USD Million)
- Table 54 China catamaran market by size, 2017 - 2030 (USD Million)
- Table 55 China catamaran market by application, 2017 - 2030 (USD Million)
- Table 56 India catamaran market by product, 2017 - 2030 (USD Million)
- Table 57 India catamaran market by size, 2017 - 2030 (USD Million)
- Table 58 India catamaran market by application, 2017 - 2030 (USD Million)
- Table 59 Japan catamaran market by product, 2017 - 2030 (USD Million)
- Table 60 Japan catamaran market by size, 2017 - 2030 (USD Million)
- Table 61 Japan catamaran market by application, 2017 - 2030 (USD Million)
- Table 62 Australia catamaran market by product, 2017 - 2030 (USD Million)
- Table 63 Australia catamaran market by size, 2017 - 2030 (USD Million)
- Table 64 Australia catamaran market by application, 2017 - 2030 (USD Million)
- Table 65 Latin America catamaran market by product, 2017 - 2030 (USD Million)
- Table 66 Latin America sailing catamaran market by application, 2017 - 2030 (USD Million)
- Table 67 Latin America power catamaran market by application, 2017 - 2030 (USD Million)
- Table 68 Latin America catamaran market by size, 2017 - 2030 (USD Million)
- Table 69 Latin America catamaran market by application, 2017 - 2030 (USD Million)
- Table 70 Mexico catamaran market by product, 2017 - 2030 (USD Million)
- Table 71 Mexico catamaran market by size, 2017 - 2030 (USD Million)
- Table 72 Mexico catamaran market by application, 2017 - 2030 (USD Million)
- Table 73 Brazil catamaran market by product, 2017 - 2030 (USD Million)
- Table 74 Brazil catamaran market by size, 2017 - 2030 (USD Million)
- Table 75 Brazil catamaran market by application, 2017 - 2030 (USD Million)
- Table 76 Middle East and Africa catamaran market by product, 2017 - 2030 (USD Million)
- Table 77 Middle East and Africa sailing catamaran market by application, 2017 - 2030 (USD Million)
- Table 78 Middle East and Africa power catamaran market by application, 2017 - 2030 (USD Million)
- Table 79 Middle East and Africa catamaran market by size, 2017 - 2030 (USD Million)
- Table 80 Middle East and Africa catamaran market by application, 2017 - 2030 (USD Million)
List of Figures
- Fig. 1 Catamaran market segmentation and scope
- Fig. 2 Catamaran market, 2017 - 2030 (USD Million)
- Fig. 3 Product segmental Insights
- Fig. 4 Size segmental Insights
- Fig. 5 Application segmental Insights
- Fig. 6 Value chain analysis
- Fig. 7 Catamaran market driver impact
- Fig. 8 Catamaran market restraint impact
- Fig. 9 Catamaran market opportunity impact
- Fig. 10 Catamaran penetration and growth prospects mapping
- Fig. 11 Catamaran market - Porter's five forces analysis
- Fig. 12 Catamaran market - PEST analysis
- Fig. 13 Catamaran market, By Product, 2021 & 2030 (USD Million)
- Fig. 14 Catamaran market, By Size, 2021 & 2030 (USD Million)
- Fig. 15 Catamaran market, By Application, 2021 & 2030 (USD Million)
- Fig. 16 North America Catamaran market - Key takeaways
- Fig. 17 Europe Catamaran market - Key takeaways
- Fig. 18 Asia-Pacific Catamaran market - Key takeaways
- Fig. 19 Latin America Catamaran market - Key takeaways
- Fig. 20 MEA Catamaran market - Key takeaways
Catamaran Market Growth & Trends:
The global catamaran market size is expected to reach USD 2.23 billion by 2030, according to a new report by Grand View Research, Inc. The market is anticipated to expand at a CAGR of 5.8% from 2022 to 2030. The increase in leisure tourism and racing events and the increasing disposable income of people across the globe are some of the key factors driving the growth of the catamaran industry.
A catamaran has a single deck that holds together two parallel hulls. It has more significant internal space than a monohull because of its two-hull structure, which means that the cockpit and living room between the two hulls have ample space. The catamaran is significant while traveling from one distant location to another. Because of increased maritime tourism and people's preference for opulent vacations, the business is expanding at a rapid pace.
A catamaran is mainly famous among High-Net-Worth Individuals (HNWI) who prefer leisure travel and have enough money to spend on those travels. One of the main reasons why catamarans are so popular these days is because of their size and stability. The space between the two hulls of a catamaran tends to have more room for the catamaran, both below and above decks. Some of the benefits of using a catamaran:
Boat manufacturers supersize: Shipyards are constantly growing in size, and boatbuilders are venturing out and creating bolder designs that push the limits of scale and speed. As a result, catamarans are growing more extensive and lighter. Sunreef Yachts, for example, has progressively increased its fleet size, and in 2022, they delivered the Sunreef 49 Power Cat model, which is currently the biggest yacht in the fleet, measuring 160 feet
Increased stability, i.e., reduces seasickness: The two-hull construction and broad beam of a catamaran give a calm sailing experience with little rolling, which is perfect for seasick guests. A multi-hull catamaran has higher stability because of its more significant surface area
A catamaran of the same size as a monohull is more expensive. Once a boat is purchased, there are extra running and maintenance fees (i.e., cost of ownership). For example, after the purchase, the individual will have to pay more for a more significant and comprehensive marina slip, and fuel expenses quickly build up because a catamaran has two engines.
Another frequently claimed disadvantage of catamaran cruising is that these sorts of boats cannot "self-right" themselves in the improbable event of capsizing. Monohull sailboats are built to "right" themselves if they go flipped in high-volume waves during a storm. Catamarans, by definition, cannot accomplish this.
Boat makers are manufacturing catamarans that are faster and more fuel-efficient as design and technology advance. As a result, many loyal monohull owners have converted to catamaran ownership. In November 2021, Servo Yachts LLC debuted The Martini 7.0, a 165-foot catamaran boat with revolutionary technology that treats seasickness in guests.
Catamaran Market Report Highlights:
- A catamaran is like any other type of expensive leisure tourism. Wealthy families, affluent individuals, and anyone with enough money who wants to try different experiences are willing to pay for a catamaran on the condition that it is safe
- In January 2022, the Martini 7.0, a 165-foot catamaran yacht, featuring unique technology that gives passengers seasickness treatment, was presented by Servo Yachts. The Martini 7.0, created in partnership with the U.K.-based company Shuttleworth Design, has novel marine stabilization techniques that allow the yacht to glide more softly across the water, eliminating the kind of motion that often causes guests to get seasick
- The power catamaran segment is estimated to hold the major market share and expand at a CAGR of 6.2% from 2022 to 2030
- The small-sized catamarans segment is projected to advance at the highest CAGR during the forecast period
- The catamaran market for sports applications is expected to expand at the highest CAGR during the assessment period
- Key industry players include African Cats., Bavaria Catamarans, Beneteau Group, and CATATHAI
Table of Contents
Chapter 1. Methodology and Scope
- 1.1. Research Methodology
- 1.2. Research Scope and Assumptions
- 1.3. List of Data Sources
- 1.4. List of Abbreviations
Chapter 2. Executive Summary
- 2.1. Market Insights
- 2.2. Market Snapshot
- 2.3. Segmental Insights
- 2.4. Catamaran Market Revenue Estimates, 2017 - 2030
Chapter 3. Market Variables, Trends, & Scope Outlook
- 3.1. Market Segmentation
- 3.2. Catamaran Market Size & Growth Prospects
- 3.3. Catamaran Market - Value Chain Analysis
- 3.4. Catamaran Market Dynamics
- 3.4.1. Market Driver Analysis
- 3.4.2. Market Restraint Analysis
- 3.4.3. Market Opportunity Analysis
- 3.5. Catamaran Penetration & Growth Prospects Mapping
- 3.6. Catamaran Market - Porter's Five Forces Analysis
- 3.6.1. Supplier power
- 3.6.2. Buyer power
- 3.6.3. Substitution threat
- 3.6.4. Threat from new entrant
- 3.6.5. Competitive rivalry
- 3.7. Catamaran Market - PEST Analysis
- 3.7.1. Political landscape
- 3.7.2. Economic landscape
- 3.7.3. Social landscape
- 3.7.4. Technology landscape
- 3.8. COVID-19 Impact Analysis
Chapter 4. Catamaran Market Product Outlook
- 4.1. Catamaran Market, By Product Analysis & Market Share, 2021 & 2030
- 4.2. Sailing Catamarans
- 4.2.1. Market estimates and forecasts, 2017 - 2030 (USD Million)
- 4.2.2. Market estimates and forecasts, By Region, 2017 - 2030 (USD Million)
- 4.2.3. Sport
- 4.2.3.1. Market estimates and forecasts, 2017 - 2030 (USD Million)
- 4.2.3.2. Market estimates and forecasts, By Region, 2017 - 2030 (USD Million)
- 4.2.4. Leisure
- 4.2.4.1. Market estimates and forecasts, 2017 - 2030 (USD Million)
- 4.2.4.2. Market estimates and forecasts, By Region, 2017 - 2030 (USD Million)
- 4.2.5. Transport
- 4.2.5.1. Market estimates and forecasts, 2017 - 2030 (USD Million)
- 4.2.5.2. Market estimates and forecasts, By Region, 2017 - 2030 (USD Million)
- 4.2.6. Others
- 4.2.6.1. Market estimates and forecasts, 2017 - 2030 (USD Million)
- 4.2.6.2. Market estimates and forecasts, By Region, 2017 - 2030 (USD Million)
- 4.3. Power Catamarans
- 4.3.1. Market estimates and forecasts, 2017 - 2030 (USD Million)
- 4.3.2. Market estimates and forecasts, By Region, 2017 - 2030 (USD Million)
- 4.3.3. Sport
- 4.3.3.1. Market estimates and forecasts, 2017 - 2030 (USD Million)
- 4.3.3.2. Market estimates and forecasts, By Region, 2017 - 2030 (USD Million)
- 4.3.4. Leisure
- 4.3.4.1. Market estimates and forecasts, 2017 - 2030 (USD Million)
- 4.3.4.2. Market estimates and forecasts, By Region, 2017 - 2030 (USD Million)
- 4.3.5. Transport
- 4.3.5.1. Market estimates and forecasts, 2017 - 2030 (USD Million)
- 4.3.5.2. Market estimates and forecasts, By Region, 2017 - 2030 (USD Million)
- 4.3.6. Others
- 4.3.6.1. Market estimates and forecasts, 2017 - 2030 (USD Million)
- 4.3.6.2. Market estimates and forecasts, By Region, 2017 - 2030 (USD Million)
Chapter 5. Catamaran Market Size Outlook
- 5.1. Catamaran Market, By Size Analysis & Market Share, 2021 & 2030
- 5.2. Small
- 5.2.1. Market estimates and forecasts, 2017 - 2030 (USD Million)
- 5.2.2. Market estimates and forecasts, By Region, 2017 - 2030 (USD Million)
- 5.3. Medium
- 5.3.1. Market estimates and forecasts, 2017 - 2030 (USD Million)
- 5.3.2. Market estimates and forecasts, By Region, 2017 - 2030 (USD Million)
- 5.4. Large
- 5.4.1. Market estimates and forecasts, 2017 - 2030 (USD Million)
- 5.4.2. Market estimates and forecasts, By Region, 2017 - 2030 (USD Million)
Chapter 6. Catamaran Market Application Outlook
- 6.1. Catamaran Market, By Application Analysis & Market Share, 2021 & 2030
- 6.2. Sport
- 6.2.1. Market estimates and forecasts, 2017 - 2030 (USD Million)
- 6.2.2. Market estimates and forecasts, By Region, 2017 - 2030 (USD Million)
- 6.3. Leisure
- 6.3.1. Market estimates and forecasts, 2017 - 2030 (USD Million)
- 6.3.2. Market estimates and forecasts, By Region, 2017 - 2030 (USD Million)
- 6.4. Transport
- 6.4.1. Market estimates and forecasts, 2017 - 2030 (USD Million)
- 6.4.2. Market estimates and forecasts, By Region, 2017 - 2030 (USD Million)
- 6.5. Others
- 6.5.1. Market estimates and forecasts, 2017 - 2030 (USD Million)
- 6.5.2. Market estimates and forecasts, By Region, 2017 - 2030 (USD Million)
Chapter 7. Catamaran Market: Regional Estimates & Trend Analysis
- 7.1. Catamaran Market Share by Region, 2021 & 2030
- 7.2. North America
- 7.2.1. Market estimates and forecasts, 2017 - 2030
- 7.2.2. Market estimates and forecasts, By Product, 2017 - 2030 (USD Million)
- 7.2.3. Market estimates and forecasts, By Size, 2017 - 2030 (USD Million)
- 7.2.4. Market estimates and forecasts, By Application, 2017 - 2030 (USD Million)
- 7.2.5. U.S.
- 7.2.5.1. Market estimates and forecasts, By Product, 2017 - 2030 (USD Million)
- 7.2.5.2. Market estimates and forecasts, By Size, 2017 - 2030 (USD Million)
- 7.2.5.3. Market estimates and forecasts, By Application, 2017 - 2030 (USD Million)
- 7.2.6. Canada
- 7.2.6.1. Market estimates and forecasts, By Product, 2017 - 2030 (USD Million)
- 7.2.6.2. Market estimates and forecasts, By Size, 2017 - 2030 (USD Million)
- 7.2.6.3. Market estimates and forecasts, By Application, 2017 - 2030 (USD Million)
- 7.3. Europe
- 7.3.1. Market estimates and forecasts, 2017 - 2030
- 7.3.2. Market estimates and forecasts, By Product, 2017 - 2030 (USD Million)
- 7.3.3. Market estimates and forecasts, By Size, 2017 - 2030 (USD Million)
- 7.3.4. Market estimates and forecasts, By Application, 2017 - 2030 (USD Million)
- 7.3.5. U.K.
- 7.3.5.1. Market estimates and forecasts, By Product, 2017 - 2030 (USD Million)
- 7.3.5.2. Market estimates and forecasts, By Size, 2017 - 2030 (USD Million)
- 7.3.5.3. Market estimates and forecasts, By Application, 2017 - 2030 (USD Million)
- 7.3.6. Germany
- 7.3.6.1. Market estimates and forecasts, By Product, 2017 - 2030 (USD Million)
- 7.3.6.2. Market estimates and forecasts, By Size, 2017 - 2030 (USD Million)
- 7.3.6.3. Market estimates and forecasts, By Application, 2017 - 2030 (USD Million)
- 7.3.7. France
- 7.3.7.1. Market estimates and forecasts, By Product, 2017 - 2030 (USD Million)
- 7.3.7.2. Market estimates and forecasts, By Size, 2017 - 2030 (USD Million)
- 7.3.7.3. Market estimates and forecasts, By Application, 2017 - 2030 (USD Million)
- 7.3.8. Italy
- 7.3.8.1. Market estimates and forecasts, By Product, 2017 - 2030 (USD Million)
- 7.3.8.2. Market estimates and forecasts, By Size, 2017 - 2030 (USD Million)
- 7.3.8.3. Market estimates and forecasts, By Application, 2017 - 2030 (USD Million)
- 7.3.9. Spain
- 7.3.9.1. Market estimates and forecasts, By Product, 2017 - 2030 (USD Million)
- 7.3.9.2. Market estimates and forecasts, By Size, 2017 - 2030 (USD Million)
- 7.3.9.3. Market estimates and forecasts, By Application, 2017 - 2030 (USD Million)
- 7.4. Asia-Pacific
- 7.4.1. Market estimates and forecasts, 2017 - 2030
- 7.4.2. Market estimates and forecasts, By Product, 2017 - 2030 (USD Million)
- 7.4.3. Market estimates and forecasts, By Size, 2017 - 2030 (USD Million)
- 7.4.4. Market estimates and forecasts, By Application, 2017 - 2030 (USD Million)
- 7.4.5. China
- 7.4.5.1. Market estimates and forecasts, By Product, 2017 - 2030 (USD Million)
- 7.4.5.2. Market estimates and forecasts, By Size, 2017 - 2030 (USD Million)
- 7.4.5.3. Market estimates and forecasts, By Application, 2017 - 2030 (USD Million)
- 7.4.6. Japan
- 7.4.6.1. Market estimates and forecasts, By Product, 2017 - 2030 (USD Million)
- 7.4.6.2. Market estimates and forecasts, By Size, 2017 - 2030 (USD Million)
- 7.4.6.3. Market estimates and forecasts, By Application, 2017 - 2030 (USD Million)
- 7.4.7. India
- 7.4.7.1. Market estimates and forecasts, By Product, 2017 - 2030 (USD Million)
- 7.4.7.2. Market estimates and forecasts, By Size, 2017 - 2030 (USD Million)
- 7.4.7.3. Market estimates and forecasts, By Application, 2017 - 2030 (USD Million)
- 7.4.8. Australia
- 7.4.8.1. Market estimates and forecasts, By Product, 2017 - 2030 (USD Million)
- 7.4.8.2. Market estimates and forecasts, By Size, 2017 - 2030 (USD Million)
- 7.4.8.3. Market estimates and forecasts, By Application, 2017 - 2030 (USD Million)
- 7.5. Latin America
- 7.5.1. Market estimates and forecasts, 2017 - 2030
- 7.5.2. Market estimates and forecasts, By Product, 2017 - 2030 (USD Million)
- 7.5.3. Market estimates and forecasts, By Size, 2017 - 2030 (USD Million)
- 7.5.4. Market estimates and forecasts, By Application, 2017 - 2030 (USD Million)
- 7.5.5. Mexico
- 7.5.5.1. Market estimates and forecasts, By Product, 2017 - 2030 (USD Million)
- 7.5.5.2. Market estimates and forecasts, By Size, 2017 - 2030 (USD Million)
- 7.5.5.3. Market estimates and forecasts, By Application, 2017 - 2030 (USD Million)
- 7.5.6. Brazil
- 7.5.6.1. Market estimates and forecasts, By Product, 2017 - 2030 (USD Million)
- 7.5.6.2. Market estimates and forecasts, By Size, 2017 - 2030 (USD Million)
- 7.5.6.3. Market estimates and forecasts, By Application, 2017 - 2030 (USD Million)
- 7.6. Middle East & Africa
- 7.6.1. Market estimates and forecasts, 2017 - 2030
- 7.6.2. Market estimates and forecasts, By Product, 2017 - 2030 (USD Million)
- 7.6.3. Market estimates and forecasts, By Size, 2017 - 2030 (USD Million)
- 7.6.4. Market estimates and forecasts, By Application, 2017 - 2030 (USD Million)
Chapter 8. Competitive Analysis
- 8.1. Recent Developments and Impact Analysis, by Key Market Participants
- 8.2. Company/Competition Categorization (Key Innovators, Market Leaders, Emerging, Niche Players)
- 8.3. Vendor Landscape
- 8.3.1. Key company market share analysis, 2021
- 8.4. Company Analysis Tools
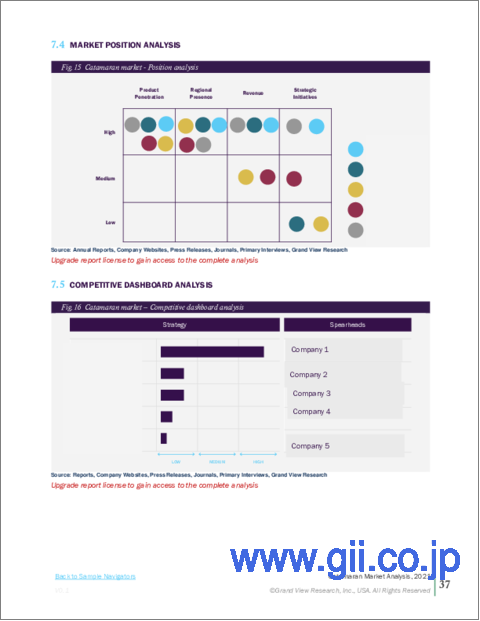
- 8.4.1. Market Position Analysis
- 8.4.2. Competitive Dashboard Analysis
Chapter 9. Competitive Landscape
- 9.1. Company Profiles
- 9.2. African Cats.
- 9.2.1. Company overview
- 9.2.2. Financial performance
- 9.2.3. Product benchmarking
- 9.2.4. Strategic initiatives
- 9.3. Bavaria Catamarans
- 9.3.1. Company overview
- 9.3.2. Financial performance
- 9.3.3. Product benchmarking
- 9.3.4. Strategic initiatives
- 9.4. Beneteau Group
- 9.4.1. Company overview
- 9.4.2. Financial performance
- 9.4.3. Product benchmarking
- 9.4.4. Strategic initiatives
- 9.5. CATATHAI
- 9.5.1. Company overview
- 9.5.2. Financial performance
- 9.5.3. Product benchmarking
- 9.5.4. Strategic initiatives
- 9.6. Fountaine Pajot Catamarans
- 9.6.1. Company overview
- 9.6.2. Financial performance
- 9.6.3. Product benchmarking
- 9.6.4. Strategic initiatives
- 9.7. Leopard Catamarans
- 9.7.1. Company overview
- 9.7.2. Financial performance
- 9.7.3. Product benchmarking
- 9.7.4. Strategic initiatives
- 9.8. NAUTITECH
- 9.8.1. Company overview
- 9.8.2. Financial performance
- 9.8.3. Product benchmarking
- 9.8.4. Strategic initiatives
- 9.9. Outremer Yachting
- 9.9.1. Company overview
- 9.9.2. Financial performance
- 9.9.3. Product benchmarking
- 9.9.4. Strategic initiatives
- 9.10. Seawind
- 9.10.1. Company overview
- 9.10.2. Financial performance
- 9.10.3. Product benchmarking
- 9.10.4. Strategic initiatives
- 9.11. Voyage
- 9.11.1. Company overview
- 9.11.2. Financial performance
- 9.11.3. Product benchmarking
- 9.11.4. Strategic initiatives