|
|
市場調査レポート
商品コード
1122099
Wi-Fi AS A Serviceの市場規模、シェア、動向分析レポート:コンポーネント別(インフラ、ソフトウェア、サービス)、ロケーションタイプ別(屋内、屋外)、組織規模別(大規模、中小企業)、業種別、地域別、セグメント別予測、2022年~2030年Wi-Fi AS A Service Market Size, Share & Trends Analysis Report By Component (Infrastructure, Software, Services), By Location Type (Indoor, Outdoor), By Organization Size (Large, SMEs), By Vertical, By Region, And Segment Forecasts, 2022 - 2030 |
||||||
|
|
|||||||
|
● お客様のご希望に応じて、既存データの加工や未掲載情報(例:国別セグメント)の追加などの対応が可能です。 詳細はお問い合わせください。 |
|||||||


| Wi-Fi AS A Serviceの市場規模、シェア、動向分析レポート:コンポーネント別(インフラ、ソフトウェア、サービス)、ロケーションタイプ別(屋内、屋外)、組織規模別(大規模、中小企業)、業種別、地域別、セグメント別予測、2022年~2030年 |
|
出版日: 2022年08月02日
発行: Grand View Research
ページ情報: 英文 120 Pages
納期: 2~10営業日
|
- 全表示
- 概要
- 図表
- 目次
Wi-Fi AS A Service市場の成長と動向
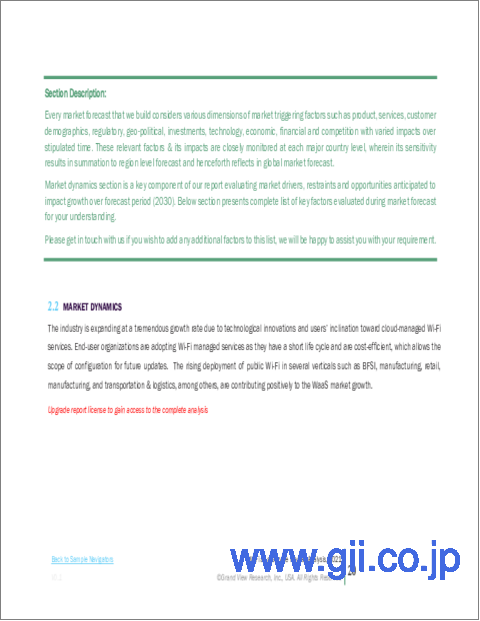
Grand View Research, Inc.の最新レポートによると、サービスとしてのWi-Fiの世界市場規模は、2030年までに243億6000万米ドルに達し、予測期間中に21.4%のCAGRを記録すると予測されています。技術革新とクラウド管理型Wi-Fiサービスへのユーザーの傾倒が成長を後押ししています。BFSI、ヘルスケア、小売、製造、輸送・物流など、いくつかの垂直分野で公衆Wi-Fiの導入が進んでいることが、業界の成長にプラスに寄与しています。エンドユーザー企業は、ライフサイクルが短く、費用対効果の高いソリューションを提供し、将来のアップデートのための設定範囲を許容することから、Wi-Fi as a Service(WaaS)を採用しています。
Wi-Fi as a Serviceは、エンドツーエンドのWi-Fiソリューション、システムの自動アップグレード、アクセスポイント、クラウドネイティブの管理/コントロールプレーンを提供する、サブスクリプション中心のクラウドベースの管理システムです。WaaSは、インフラストラクチャー、ソフトウェア、プロフェッショナルサービス、マネージドサービスから構成されています。WaaSを利用することで、ユーザーはリアルタイムのネットワーク監視や、Wi-Fiネットワークの使用状況に関する履歴データとリアルタイムデータの組み合わせを利用することができます。
Wi-Fiサービスは、ネットワーク・オペレーティング・センターを通じて制御され、高速で信頼性の高いデータネットワークを提供するため、中小企業、オフィス移転、仮設店舗に最適です。WaaSは、ITリソースを持つ企業や組織が、信頼性が高く安全で高速な無線LAN(WLAN)アクセスを複数の拠点に提供することを可能にします。
Wi-Fiの使用事例が増加している背景には、低価格のサービス、拡張性の高さ、確かな技術力、様々な分野での使用事例の増加が挙げられます。さらに、広範囲かつ高速なネットワークへの需要の高まりや、エアギャップ・サービスの採用が増加していることも、市場の成長を後押しする要因の1つとなっています。
WaaSは、BYOD(Bring Your Own Device)技術に関するセキュリティ対策をサービス利用者に提供します。BYOD技術では、ネットワークに接続されていないデバイスに限定的なネットワークアクセスを許可するため、ベンダーはユーザーのネットワークアクセスパラメータの区分け、デバイスの取り消し、選択したデバイスからのデータのリモートワイプを支援することが可能です。多くの組織でBYODポリシーが採用されるようになってきており、市場の成長にプラスに働くと予想されます。
WaaS業界で事業を展開する企業は、市場で大きなシェアを獲得するために、製品の発売、パートナーシップやコラボレーション、M&Aなど、数多くの重要な戦略を採用しています。例えば、Cisco Inc.は、catalyst 9000Xシリーズスイッチ、マネージドサービスとしてのプライベート5G、ハイエンドWi-Fi 6Eアクセスポイントなどの新技術の導入を発表しています。これらの新しいソリューションは、組織や企業が運用をデジタル化し、ネットワークを拡張してキャンパス体験を再定義し、ハイブリッドワークをサポートすることを目的としています。
Wi-Fi AS A Service市場のレポートハイライト
Wi-Fi as a ServiceやクラウドベースのWi-Fiインフラの採用が進んでいることから、同市場の予測期間中のCAGRは21.4%と予測されています。また、クラウドプラットフォームの採用拡大、エアギャップサービスなどの技術的進歩、多くの組織におけるBYOD技術の採用拡大などの動向が、市場の成長を促進しています。
コンポーネント別では、インフラストラクチャー分野が2021年に44%超の最大の売上シェアを占めました。ワイヤレスインフラは、技術、セキュリティ対策、デバイスの統合を通じて、ワイヤレス通信の管理と配信を可能にするためです。WaaSインフラストラクチャは、小売&eコマース、BFSI、輸送&物流、製造などの複数の垂直分野で広く使用されており、このセグメントの成長を促進しています。
ロケーションタイプ別では、2021年に屋内型が市場を占め、低遅延、高速、ネットワーク容量の増加、デバイス密度といった閉じた環境におけるWaaSの利点により、予測期間中に22.4%の著しいCAGRを記録すると予想されます。
組織規模別では、大企業向けが2021年に市場を席巻し、予測期間中のCAGRは20.0%と予測されます。この成長は、大企業でWaaSがかなりの割合で急速に採用され、成長を促進していることに起因しています。大企業は、データセキュリティやプライバシー、クラウド接続の障害などの問題に対処するため、WaaSにかなりの投資を行っています。
業種別では、決済取引の増加やBFSI業界におけるWaaSの採用拡大により、BFSI業界がWaaS市場を独占した
アジア太平洋地域は、スマートフォンの普及とインターネット加入者の増加により、2021年の市場を独占し、37%以上の最大の売上シェアを占めました。また、新興の組織や企業がWaaSを採用し、売上、貴重なデータ、店舗での顧客行動、顧客の嗜好を分析・追跡していることが、この地域の成長を後押ししています。
目次
第1章 調査手法と範囲
- 調査手法
- 調査範囲と前提
- データソースのリスト
- 略語一覧
第2章 エグゼクティブサマリー
- 市場の洞察
- 市場のスナップショット
- セグメントの洞察
第3章 市場変数、動向、および範囲の見通し
- 市場セグメンテーション
- サービスとしてのWi-Fiの市場規模と成長の見通し
- Wi-Fi as a Service市場-バリューチェーン分析
- Wi-Fi as a Service市場力学
- 市場促進要因分析
- 市場制約分析
- 市場機会分析
- 宇宙旅行の浸透と成長の見通しのマッピング
- Wi-Fi as a Service市場- ポーターのファイブフォース分析
- サプライヤーの力
- 買い手の交渉力
- 代替の脅威
- 新規参入者からの脅威
- 競争企業間の敵対関係
- Wi-Fi as a Service市場-PEST分析
- 政治情勢
- 経済情勢
- 社会情勢
- テクノロジー情勢
- COVID-19影響分析
第4章 Wi-Fi as a Service市場:コンポーネントの見通し
- Wi-Fi as a Service市場:コンポーネント分析と市場シェア別、2021年と2030年
- インフラストラクチャー
- アクセス・ポイント
- 無線LANコントローラー
- その他
- ソフトウェア
- サービス
- プロフェッショナルサービス
- マネージドサービス
第5章 Wi-Fi as a Service市場:ロケーションタイプの見通し
- Wi-Fi as a Service市場、ロケーションタイプ分析と市場シェア別、2021年と2030年
- 屋内
- アウトドア
第6章 Wi-Fi as a Service市場:組織規模の見通し
- Wi-Fi as a Service市場、組織規模分析と市場シェア別、2021年と2030年
- 大企業
- 中小企業
第7章 Wi-Fi as a Service市場:垂直方向の見通し
- Wi-Fi as a Service市場、業界別分析と市場シェア別、2021年と2030年
- 銀行、金融サービス、保険(BFSI)
- 小売
- 情報技術
- 製造業
- 運輸・物流
- 教育
- ヘルスケア
- 政府
- その他
第8章 Wi-Fi as a Service市場:地域の推定・動向分析
- Wi-Fi as a Serviceの地域別市場シェア、2021年および2030年
- 北米
- 米国
- カナダ
- 欧州
- ドイツ
- フランス
- 英国
- アジア太平洋地域
- 中国
- 日本
- インド
- ラテンアメリカ
- ブラジル
- メキシコ
- 中東とアフリカ
第9章 競合分析
- 主要な市場参加者別最近の動向と影響分析
- 企業/競合の分類(主要なイノベーター、マーケットリーダー、新興企業、ニッチプレイヤー)
- ベンダー情勢
- 主要企業の市場シェア分析、2021年
- 企業分析ツール
- 市況分析
- 競合ダッシュボード分析
第10章 競合情勢
- 企業プロファイル
- Cisco Systems
- 会社概要
- 財務実績
- コンポーネントのベンチマーク
- 戦略的イニシアチブ
- Huawei Technologies Co. Ltd
- 会社概要
- 財務実績
- コンポーネントのベンチマーク
- 戦略的イニシアチブ
- Commscope
- 会社概要
- 財務実績
- コンポーネントのベンチマーク
- 戦略的イニシアチブ
- Aruba
- 会社概要
- 財務実績
- コンポーネントのベンチマーク
- 戦略的イニシアチブ
- Singtel
- 会社概要
- 財務実績
- コンポーネントのベンチマーク
- 戦略的イニシアチブ
- Rogers Communications
- 会社概要
- 財務実績
- コンポーネントのベンチマーク
- 戦略的イニシアチブ
- Juniper Networks Inc
- 会社概要
- 財務実績
- コンポーネントのベンチマーク
- 戦略的イニシアチブ
- Dell Technologies
- 会社概要
- 財務実績
- コンポーネントのベンチマーク
- 戦略的イニシアチブ
- TP-Link
- 会社概要
- 財務実績
- コンポーネントのベンチマーク
- 戦略的イニシアチブ
- Extreme Networks
- 会社概要
- 財務実績
- コンポーネントのベンチマーク
- 戦略的イニシアチブ
- Fortinet
- 会社概要
- 財務実績
- コンポーネントのベンチマーク
- 戦略的イニシアチブ
- Arista Networks
- 会社概要
- 財務実績
- コンポーネントのベンチマーク
- 戦略的イニシアチブ
- D-Link Corporations
- 会社概要
- 財務実績
- コンポーネントのベンチマーク
- 戦略的イニシアチブ
- Cambium Networks
- 会社概要
- 財務実績
- コンポーネントのベンチマーク
- 戦略的イニシアチブ
- Superloop
- 会社概要
- 財務実績
- コンポーネントのベンチマーク
- 戦略的イニシアチブ
List of Tables
- TABLE 1 Global Wi-Fi as a service market, 2017 - 2030 (USD Million)
- TABLE 2 Wi-Fi as a service market by region, 2017 - 2030 (USD Million)
- TABLE 3 Wi-Fi as a service market by component, 2017 - 2030 (USD Million)
- TABLE 4 Wi-Fi as a service market by location type, 2017 - 2030 (USD Million)
- TABLE 5 Wi-Fi as a service market by organization size, 2017 - 2030 (USD Million)
- TABLE 6 Wi-Fi as a service market by vertical, 2017 - 2030 (USD Million)
- TABLE 7 Wi-Fi as a service market by application, 2017 - 2030 (USD Million)
- TABLE 8 Infrastructure Wi-Fi as a Service Component, 2017 - 2030 (USD Million)
- TABLE 9 Infrastructure Wi-Fi as a Service Component, by region, 2017 - 2030 (USD Million)
- TABLE 10 Software Wi-Fi as a Service Component, 2017 - 2030 (USD Million)
- TABLE 11 Software Wi-Fi as a Service Component, by region, 2017 - 2030 (USD Million)
- TABLE 12 Service Wi-Fi as a Service Component, 2017 - 2030 (USD Million)
- TABLE 13 Service Wi-Fi as a Service Component, by region, 2017 - 2030 (USD Million)
- TABLE 14 Indoor Wi-Fi as a Service Location Type, 2017 - 2030 (USD Million)
- TABLE 15 Indoor Wi-Fi as a Service Location Type, by region, 2017 - 2030 (USD Million)
- TABLE 16 Outdoor Wi-Fi as a Service Location Type, 2017 - 2030 (USD Million)
- TABLE 17 Outdoor Wi-Fi as a Service Location Type, by region, 2017 - 2030 (USD Million)
- TABLE 18 Large Enterprise Wi-Fi as a Service Organization Size, 2017 - 2030 (USD Million)
- TABLE 19 Large Enterprise Wi-Fi as a Service Organization Size, by region, 2017 - 2030 (USD Million)
- TABLE 20 Small & Medium Enterprises Wi-Fi as a Service Organization Size, 2017 - 2030 (USD Million)
- TABLE 21 Small & Medium Enterprises Wi-Fi as a Service Organization Size, by region, 2017 - 2030 (USD Million)
- TABLE 22 Banking, Financial Services and Insurance Wi-Fi as a Service Vertical, 2017 - 2030 (USD Million)
- TABLE 23 Banking, Financial Services and Insurance Wi-Fi as a Service Vertical, by region, 2017 - 2030 (USD Million)
- TABLE 24 Retail Wi-Fi as a Service Vertical, 2017 - 2030 (USD Million)
- TABLE 25 Retail Wi-Fi as a Service Vertical, by region, 2017 - 2030 (USD Million)
- TABLE 26 Information Technology Wi-Fi as a Service Vertical, 2017 - 2030 (USD Million)
- TABLE 27 Information Technology Wi-Fi as a Service Vertical, by region, 2017 - 2030 (USD Million)
- TABLE 28 Manufacturing Wi-Fi as a Service Vertical, 2017 - 2030 (USD Million)
- TABLE 29 Manufacturing Wi-Fi as a Service Vertical, by region, 2017 - 2030 (USD Million)
- TABLE 30 Transportation & Logistics Wi-Fi as a Service Vertical, 2017 - 2030 (USD Million)
- TABLE 31 Transportation & Logistics Wi-Fi as a Service Vertical, by region, 2017 - 2030 (USD Million)
- TABLE 32 Education Wi-Fi as a Service Vertical, 2017 - 2030 (USD Million)
- TABLE 33 Education Wi-Fi as a Service Vertical, by region, 2017 - 2030 (USD Million)
- TABLE 34 Healthcare Wi-Fi as a Service Vertical, 2017 - 2030 (USD Million)
- TABLE 35 Healthcare Wi-Fi as a Service Vertical, by region, 2017 - 2030 (USD Million)
- TABLE 36 Government Wi-Fi as a Service Vertical, 2017 - 2030 (USD Million)
- TABLE 37 Government Wi-Fi as a Service Vertical, by region, 2017 - 2030 (USD Million)
- TABLE 38 Others Wi-Fi as a Service Vertical, 2017 - 2030 (USD Million)
- TABLE 39 Others Wi-Fi as a Service Vertical, by region, 2017 - 2030 (USD Million)
- TABLE 40 North America Wi-Fi as a service market, by component, 2017 - 2030 (USD Million)
- TABLE 41 North America Wi-Fi as a service market, by location type, 2017 - 2030 (USD Million)
- TABLE 42 North America Wi-Fi as a service market, by organization size, 2017 - 2030 (USD Million)
- TABLE 43 North America Wi-Fi as a service market, by vertical, 2017 - 2030 (USD Million)
- TABLE 44 U.S. Wi-Fi as a service market, by component, 2017 - 2030 (USD Million)
- TABLE 45 U.S. Wi-Fi as a service market, by location type, 2017 - 2030 (USD Million)
- TABLE 46 U.S. Wi-Fi as a service market, by organization size, 2017 - 2030 (USD Million)
- TABLE 47 U.S. Wi-Fi as a service market, by vertical, 2017 - 2030 (USD Million)
- TABLE 48 Canada. Wi-Fi as a service market, by component, 2017 - 2030 (USD Million)
- TABLE 49 Canada Wi-Fi as a service market, by location type, 2017 - 2030 (USD Million)
- TABLE 50 Canada Wi-Fi as a service market, by organization size, 2017 - 2030 (USD Million)
- TABLE 51 Canada. Wi-Fi as a service market, by vertical, 2017 - 2030 (USD Million)
- TABLE 52 Europe Wi-Fi as a service market, by component, 2017 - 2030 (USD Million)
- TABLE 53 Europe Wi-Fi as a service market, by location type, 2017 - 2030 (USD Million)
- TABLE 54 Europe Wi-Fi as a service market, by organization size, 2017 - 2030 (USD Million)
- TABLE 55 Europe Wi-Fi as a service market, by vertical, 2017 - 2030 (USD Million)
- TABLE 56 U.K. Wi-Fi as a service market, by component, 2017 - 2030 (USD Million)
- TABLE 57 U.K. Wi-Fi as a service market, by location type, 2017 - 2030 (USD Million)
- TABLE 58 U.K. Wi-Fi as a service market, by organization size, 2017 - 2030 (USD Million)
- TABLE 59 U.K. Wi-Fi as a service market, by vertical, 2017 - 2030 (USD Million)
- TABLE 60 Germany Wi-Fi as a service market, by component, 2017 - 2030 (USD Million)
- TABLE 61 Germany Wi-Fi as a service market, by location type, 2017 - 2030 (USD Million)
- TABLE 62 Germany Wi-Fi as a service market, by organization size, 2017 - 2030 (USD Million)
- TABLE 63 Germany Wi-Fi as a service market, by vertical, 2017 - 2030 (USD Million)
- TABLE 64 France Wi-Fi as a service market, by component, 2017 - 2030 (USD Million)
- TABLE 65 France Wi-Fi as a service market, by location type, 2017 - 2030 (USD Million)
- TABLE 66 France Wi-Fi as a service market, by organization size, 2017 - 2030 (USD Million)
- TABLE 67 France Wi-Fi as a service market, by vertical, 2017 - 2030 (USD Million)
- TABLE 68 Asia Pacific Wi-Fi as a service market, by component, 2017 - 2030 (USD Million)
- TABLE 69 Asia Pacific Wi-Fi as a service market, by location type, 2017 - 2030 (USD Million)
- TABLE 70 Asia Pacific Wi-Fi as a service market, by organization size, 2017 - 2030 (USD Million)
- TABLE 71 Asia Pacific Wi-Fi as a service market, by vertical, 2017 - 2030 (USD Million)
- TABLE 72 China Wi-Fi as a service market, by component, 2017 - 2030 (USD Million)
- TABLE 73 China Wi-Fi as a service market, by location type, 2017 - 2030 (USD Million)
- TABLE 74 China Wi-Fi as a service market, by organization size, 2017 - 2030 (USD Million)
- TABLE 75 China Wi-Fi as a service market, by vertical, 2017 - 2030 (USD Million)
- TABLE 76 Japan Wi-Fi as a service market, by component, 2017 - 2030 (USD Million)
- TABLE 77 Japan Wi-Fi as a service market, by location type, 2017 - 2030 (USD Million)
- TABLE 78 Japan Wi-Fi as a service market, by organization size, 2017 - 2030 (USD Million)
- TABLE 79 Japan Wi-Fi as a service market, by vertical, 2017 - 2030 (USD Million)
- TABLE 80 India Wi-Fi as a service market, by component, 2017 - 2030 (USD Million)
- TABLE 81 India Wi-Fi as a service market, by location type, 2017 - 2030 (USD Million)
- TABLE 82 India Wi-Fi as a service market, by organization size, 2017 - 2030 (USD Million)
- TABLE 83 India Wi-Fi as a service market, by vertical, 2017 - 2030 (USD Million)
- TABLE 84 Latin America Wi-Fi as a service market, by component, 2017 - 2030 (USD Million)
- TABLE 85 Latin America Wi-Fi as a service market, by location type, 2017 - 2030 (USD Million)
- TABLE 86 Latin America Wi-Fi as a service market, by organization size, 2017 - 2030 (USD Million)
- TABLE 87 Latin America Wi-Fi as a service market, by vertical, 2017 - 2030 (USD Million)
- TABLE 88 Brazil Wi-Fi as a service market, by component, 2017 - 2030 (USD Million)
- TABLE 89 Brazil Wi-Fi as a service market, by location type, 2017 - 2030 (USD Million)
- TABLE 90 Brazil Wi-Fi as a service market, by organization size, 2017 - 2030 (USD Million)
- TABLE 91 Brazil Wi-Fi as a service market, by vertical, 2017 - 2030 (USD Million)
- TABLE 92 Mexico Wi-Fi as a service market, by component, 2017 - 2030 (USD Million)
- TABLE 93 Mexico Wi-Fi as a service market, by location type, 2017 - 2030 (USD Million)
- TABLE 84 Mexico Wi-Fi as a service market, by organization size, 2017 - 2030 (USD Million)
- TABLE 95 Mexico Wi-Fi as a service market, by vertical, 2017 - 2030 (USD Million)
- TABLE 96 MEA Wi-Fi as a service market, by component, 2017 - 2030 (USD Million)
- TABLE 97 MEA Wi-Fi as a service market, by location type, 2017 - 2030 (USD Million)
- TABLE 98 MEA Wi-Fi as a service market, by organization size, 2017 - 2030 (USD Million)
- TABLE 99 MEA Wi-Fi as a service market, by vertical, 2017 - 2030 (USD Million)
List of Figures
- FIG. 1 Wi-Fi as a Service Market segmentation and scope
- FIG. 2 Wi-Fi as a Service Market, 2017 - 2030 (USD Million)
- FIG. 3 Component segmental Insights
- FIG. 4 Location type segmental Insights
- FIG. 5 Organization size segmental Insights
- FIG. 6 Vertical segmental Insights
- FIG. 7 Value chain analysis
- FIG. 8 Wi-Fi as a Service Market driver impact
- FIG. 9 Wi-Fi as a Service Market restraint impact
- FIG. 10 Wi-Fi as a Service Market opportunity impact
- FIG. 11 Wi-Fi as a Service penetration and growth prospects mapping
- FIG. 12 Wi-Fi as a Service Market - Porter's five forces analysis
- FIG. 13 Wi-Fi as a Service Market - PEST analysis
- FIG. 14 Wi-Fi as a Service Market, By Component, 2021 & 2030 (USD Million)
- FIG. 15 Wi-Fi as a Service Market, By Location Type, 2021 & 2030 (USD Million)
- FIG. 16 Wi-Fi as a Service Market, By Organization Size, 2021 & 2030 (USD Million)
- FIG. 17 Wi-Fi as a Service Market, By Vertical, 2021 & 2030 (USD Million)
- FIG. 18 North America Wi-Fi as a Service Market - Key takeaways
- FIG. 19 Europe Wi-Fi as a Service Market - Key takeaways
- FIG. 20 Asia-Pacific Wi-Fi as a Service Market - Key takeaways
- FIG. 21 Latin America Wi-Fi as a Service Market - Key takeaways
- FIG. 22 MEA Wi-Fi as a Service Market - Key takeaways
Wi-Fi AS A Service Market Growth & Trends:
The global wi-fi as a service market size is anticipated to reach USD 24.36 billion by 2030, registering a CAGR of 21.4% over the forecast period, according to a new report by Grand View Research, Inc. Technological innovations and users' inclination toward cloud-managed Wi-Fi services are driving the growth. The rising deployment of public Wi-Fi in several verticals such as BFSI, healthcare, retail, manufacturing, and transportation & logistics is positively contributing to the growth of the industry. End-user organizations are adopting Wi-Fi as a Service (WaaS) as it has a short life cycle and offers a cost-efficient solution, which allows the scope of configuration for future updates.
Wi-Fi as a service is a subscription-centered, cloud-based management system that provides end-to-end Wi-Fi solutions, automatic system upgrades, access points, and a cloud-native management/control plane. WaaS comprises infrastructure, software, and professional as well as managed services. With WaaS, users can benefit from real-time network monitoring and a combination of historical and real-time data on Wi-Fi network usage.
Wi-Fi as a service is ideal for smaller businesses, office relocations, and temporary locations, as it can be controlled through a network operating center delivering a fast and reliable data network. WaaS allows businesses and organizations with IT resource to provide reliable, secure, and fast wireless local area network (WLAN) access across several locations.
The rising deployment of Wi-Fi as a service is attributed to low-cost services, greater scalability, resolute technological advancements, and increasing use cases in several sectors. Additionally, growing demand for widespread and high-speed network coverage and increasing adoption of air-gapped services are some of the factors fueling the growth of the market.
WaaS provides service users with security measures about bring your own device (BYOD) technology. BYOD technology grants limited network access to a non-network device, enabling the vendor to help the user compartmentalize network access parameters, assist the user in revoking devices, and remotely wipe data from selected devices. The growing adoption of BYOD policy in many organizations is expected to contribute positively to the growth of the market.
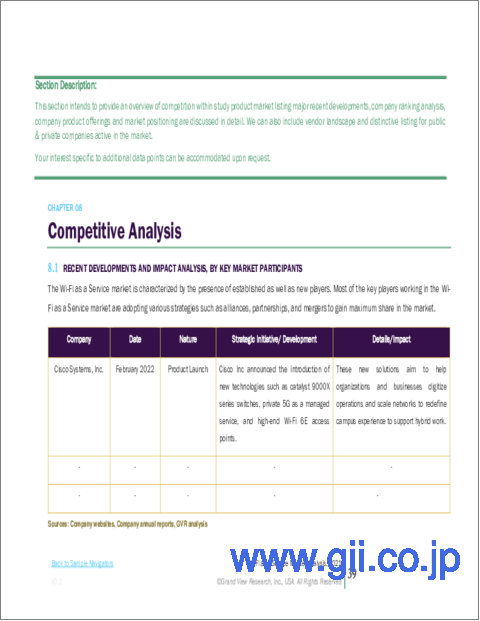
The players operating in the WaaS industry are adopting numerous key strategies such as product launches, partnerships and collaborations, and mergers and acquisitions to obtain a significant share in the market. For instance, Cisco Inc. announced the introduction of new technologies such as catalyst 9000X series switches, private 5G as a managed service, and high-end Wi-Fi 6E access points. These new solutions aim to help organizations and businesses digitize operations and scale networks to redefine campus experience to support hybrid work.
Wi-Fi AS A Service Market Report Highlights:
- The market is expected to witness a CAGR of 21.4% over the forecast period owing to the rising adoption of Wi-Fi as a service and cloud-based Wi-Fi infrastructure. Moreover, trends such as growing adoption of cloud platforms, ongoing technological advancements such as air-gapped services along with increasing adoption of BYOD technology in a number of organizations are propelling the growth of the market
- Based on component, the infrastructure segment accounted for the largest revenue share of over 44% in 2021. As wireless infrastructure enables the management and delivery of wireless communications through the integration of technology, security measures, and devices. WaaS infrastructure is extensively used in several verticals such as retail & e-commerce, BFSI, transportation & logistics, and manufacturing which is driving the growth of this segment
- Based on location type, the indoor segment dominated the market in 2021 and is expected to witness a significant CAGR of 22.4% over the forecast period owing to the benefits of WaaS for closed environments such as low latency, higher speed, increased network capacity, and device density
- Based on organization size, the large enterprise segment dominated the market in 2021 and is expected to witness a significant CAGR of 20.0% over the forecast period. The growth is attributed to the rapid adoption of WaaS at a substantial rate in large enterprises is propelling the growth. Large enterprises are making considerable investments in WaaS to address issues such as data security, privacy, and cloud connectivity failure
- Based on vertical, the BFSI industry vertical dominated the market for Wi-Fi as a service owing to increasing payment transactions and the growing adoption of WaaS in the BFSI industry
- Asia Pacific dominated the market in 2021 and accounted for the largest revenue share of more than 37%, owing to the extensive adoption of smartphones and growing internet subscribers. Additionally, adopting WaaS by emerging organizations and businesses to analyze and track sales, valuable data, in-store customer behavior, and customer preferences drives the regional growth
Table of Contents
Chapter 1. Methodology and Scope
- 1.1. Research Methodology
- 1.2. Research Scope and Assumptions
- 1.3. List of Data Sources
- 1.4. List of Abbreviations
Chapter 2. Executive Summary
- 2.1. Market Insights
- 2.2. Market Snapshot
- 2.3. Segmental Insights
- 2.4. Wi-Fi as a Service Market Revenue Estimates, 2017 - 2030
Chapter 3. Market Variables, Trends, & Scope Outlook
- 3.1. Market Segmentation
- 3.2. Wi-Fi as a Service Market Size & Growth Prospects
- 3.3. Wi-Fi as a Service Market - Value Chain Analysis
- 3.4. Wi-Fi as a Service Market Dynamics
- 3.4.1. Market Driver Analysis
- 3.4.2. Market Restraint Analysis
- 3.4.3. Market Opportunity Analysis
- 3.5. Space Tourism Penetration & Growth Prospects Mapping
- 3.6. Wi-Fi as a Service Market - Porter's Five Forces Analysis
- 3.6.1. Supplier power
- 3.6.2. Buyer power
- 3.6.3. Substitution threat
- 3.6.4. Threat from new entrant
- 3.6.5. Competitive rivalry
- 3.7. Wi-Fi as a Service Market - PEST Analysis
- 3.7.1. Political landscape
- 3.7.2. Economic landscape
- 3.7.3. Social landscape
- 3.7.4. Technology landscape
- 3.8. COVID-19 Impact Analysis
Chapter 4. Wi-Fi as a Service Market Component Outlook
- 4.1. Wi-Fi as a Service Market, By Component Analysis & Market Share, 2021 & 2030
- 4.2. Infrastructure
- 4.2.1. Market estimates and forecasts, 2017 - 2030 (USD Million)
- 4.2.2. Market estimates and forecasts, By Region, 2017 - 2030 (USD Million)
- 4.2.3. Access point
- 4.2.3.1. Market estimates and forecasts, 2017 - 2030 (USD Million)
- 4.2.3.2. Market estimates and forecasts, By Region, 2017 - 2030 (USD Million)
- 4.2.4. WLAN controllers
- 4.2.4.1. Market estimates and forecasts, 2017 - 2030 (USD Million)
- 4.2.4.2. Market estimates and forecasts, By Region, 2017 - 2030 (USD Million)
- 4.2.5. Others
- 4.2.5.1. Market estimates and forecasts, 2017 - 2030 (USD Million)
- 4.2.5.2. Market estimates and forecasts, By Region, 2017 - 2030 (USD Million)
- 4.3. Software
- 4.3.1. Market estimates and forecasts, 2017 - 2030 (USD Million)
- 4.3.2. Market estimates and forecasts, By Region, 2017 - 2030 (USD Million)
- 4.4. Services
- 4.4.1. Market estimates and forecasts, 2017 - 2030 (USD Million)
- 4.4.2. Market estimates and forecasts, By Region, 2017 - 2030 (USD Million)
- 4.4.3. Professional Services
- 4.4.3.1. Market estimates and forecasts, 2017 - 2030 (USD Million)
- 4.4.3.2. Market estimates and forecasts, By Region, 2017 - 2030 (USD Million)
- 4.4.4. Managed services
- 4.4.4.1. Market estimates and forecasts, 2017 - 2030 (USD Million)
- 4.4.4.2. Market estimates and forecasts, By Region, 2017 - 2030 (USD Million)
Chapter 5. Wi-Fi as a Service Market Location Type Outlook
- 5.1. Wi-Fi as a Service Market, By Location Type Analysis & Market Share, 2021 & 2030
- 5.2. Indoor
- 5.2.1. Market estimates and forecasts, 2017 - 2030 (USD Million)
- 5.2.2. Market estimates and forecasts, By Region, 2017 - 2030 (USD Million)
- 5.3. Outdoor
- 5.3.1. Market estimates and forecasts, 2017 - 2030 (USD Million)
- 5.3.2. Market estimates and forecasts, By Region, 2017 - 2030 (USD Million)
Chapter 6. Wi-Fi as a Service Market Organization Size Outlook
- 6.1. Wi-Fi as a Service Market, By Organization Size Analysis & Market Share, 2021 & 2030
- 6.2. Large Enterprise
- 6.2.1. Market estimates and forecasts, 2017 - 2030 (USD Million)
- 6.2.2. Market estimates and forecasts, By Region, 2017 - 2030 (USD Million)
- 6.3. Small & Medium Enterprises
- 6.3.1. Market estimates and forecasts, 2017 - 2030 (USD Million)
- 6.3.2. Market estimates and forecasts, By Region, 2017 - 2030 (USD Million)
Chapter 7. Wi-Fi as a Service Market Vertical Outlook
- 7.1. Wi-Fi as a Service Market, By Vertical Analysis & Market Share, 2021 & 2030
- 7.2. Banking, Financial Services, and Insurance (BFSI)
- 7.2.1. Market estimates and forecasts, 2017 - 2030 (USD Million)
- 7.2.2. Market estimates and forecasts, By Region, 2017 - 2030 (USD Million)
- 7.3. Retail
- 7.3.1. Market estimates and forecasts, 2017 - 2030 (USD Million)
- 7.3.2. Market estimates and forecasts, By Region, 2017 - 2030 (USD Million)
- 7.4. Information Technology
- 7.4.1. Market estimates and forecasts, 2017 - 2030 (USD Million)
- 7.4.2. Market estimates and forecasts, By Region, 2017 - 2030 (USD Million)
- 7.5. Manufacturing
- 7.5.1. Market estimates and forecasts, 2017 - 2030 (USD Million)
- 7.5.2. Market estimates and forecasts, By Region, 2017 - 2030 (USD Million)
- 7.6. Transportation & Logistics
- 7.6.1. Market estimates and forecasts, 2017 - 2030 (USD Million)
- 7.6.2. Market estimates and forecasts, By Region, 2017 - 2030 (USD Million)
- 7.7. Education
- 7.7.1. Market estimates and forecasts, 2017 - 2030 (USD Million)
- 7.7.2. Market estimates and forecasts, By Region, 2017 - 2030 (USD Million)
- 7.8. Healthcare
- 7.8.1. Market estimates and forecasts, 2017 - 2030 (USD Million)
- 7.8.2. Market estimates and forecasts, By Region, 2017 - 2030 (USD Million)
- 7.9. Government
- 7.9.1. Market estimates and forecasts, 2017 - 2030 (USD Million)
- 7.9.2. Market estimates and forecasts, By Region, 2017 - 2030 (USD Million)
- 7.10. Others
- 7.10.1. Market estimates and forecasts, 2017 - 2030 (USD Million)
- 7.10.2. Market estimates and forecasts, By Region, 2017 - 2030 (USD Million)
Chapter 8. Wi-Fi as a Service Market: Regional Estimates & Trend Analysis
- 8.1. Wi-Fi as a Service Market Share by Region, 2021 & 2030
- 8.2. North America
- 8.2.1. Market estimates and forecasts, 2017 - 2030
- 8.2.2. Market estimates and forecasts, By Component, 2017 - 2030 (USD Million)
- 8.2.3. Market estimates and forecasts, By Location Type, 2017 - 2030 (USD Million)
- 8.2.4. Market estimates and forecasts, By Organization Size, 2017 - 2030 (USD Million)
- 8.2.5. Market estimates and forecasts, By Vertical, 2017 - 2030 (USD Million)
- 8.2.6. U.S.
- 8.2.6.1. Market estimates and forecasts, By Component, 2017 - 2030 (USD Million)
- 8.2.6.2. Market estimates and forecasts, By Location Type, 2017 - 2030 (USD Million)
- 8.2.6.3. Market estimates and forecasts, By Organization Size, 2017 - 2030 (USD Million)
- 8.2.6.4. Market estimates and forecasts, By Vertical, 2017 - 2030 (USD Million)
- 8.2.7. Canada
- 8.2.7.1. Market estimates and forecasts, By Component, 2017 - 2030 (USD Million)
- 8.2.7.2. Market estimates and forecasts, By Location Type, 2017 - 2030 (USD Million)
- 8.2.7.3. Market estimates and forecasts, By Organization Size, 2017 - 2030 (USD Million)
- 8.2.7.4. Market estimates and forecasts, By Vertical, 2017 - 2030 (USD Million)
- 8.3. Europe
- 8.3.1. Market estimates and forecasts, 2017 - 2030
- 8.3.2. Market estimates and forecasts, By Component, 2017 - 2030 (USD Million)
- 8.3.3. Market estimates and forecasts, By Location Type, 2017 - 2030 (USD Million)
- 8.3.4. Market estimates and forecasts, By Organization Size, 2017 - 2030 (USD Million)
- 8.3.5. Market estimates and forecasts, By Vertical, 2017 - 2030 (USD Million)
- 8.3.6. Germany
- 8.3.6.1. Market estimates and forecasts, By Component, 2017 - 2030 (USD Million)
- 8.3.6.2. Market estimates and forecasts, By Location Type, 2017 - 2030 (USD Million)
- 8.3.6.3. Market estimates and forecasts, By Organization Size, 2017 - 2030 (USD Million)
- 8.3.6.4. Market estimates and forecasts, By Vertical, 2017 - 2030 (USD Million)
- 8.3.7. France
- 8.3.7.1. Market estimates and forecasts, By Component, 2017 - 2030 (USD Million)
- 8.3.7.2. Market estimates and forecasts, By Location Type, 2017 - 2030 (USD Million)
- 8.3.7.3. Market estimates and forecasts, By Organization Size, 2017 - 2030 (USD Million)
- 8.3.7.4. Market estimates and forecasts, By Vertical, 2017 - 2030 (USD Million)
- 8.3.8. U.K.
- 8.3.8.1. Market estimates and forecasts, By Component, 2017 - 2030 (USD Million)
- 8.3.8.2. Market estimates and forecasts, By Location Type, 2017 - 2030 (USD Million)
- 8.3.8.3. Market estimates and forecasts, By Organization Size, 2017 - 2030 (USD Million)
- 8.3.8.4. Market estimates and forecasts, By Vertical, 2017 - 2030 (USD Million)
- 8.4. Asia Pacific
- 8.4.1. Market estimates and forecasts, 2017 - 2030
- 8.4.2. Market estimates and forecasts, By Component, 2017 - 2030 (USD Million)
- 8.4.3. Market estimates and forecasts, By Location Type, 2017 - 2030 (USD Million)
- 8.4.4. Market estimates and forecasts, By Organization Size, 2017 - 2030 (USD Million)
- 8.4.5. Market estimates and forecasts, By Vertical, 2017 - 2030 (USD Million)
- 8.4.6. China
- 8.4.6.1. Market estimates and forecasts, By Component, 2017 - 2030 (USD Million)
- 8.4.6.2. Market estimates and forecasts, By Location Type, 2017 - 2030 (USD Million)
- 8.4.6.3. Market estimates and forecasts, By Organization Size, 2017 - 2030 (USD Million)
- 8.4.6.4. Market estimates and forecasts, By Vertical, 2017 - 2030 (USD Million)
- 8.4.7. Japan
- 8.4.7.1. Market estimates and forecasts, By Component, 2017 - 2030 (USD Million)
- 8.4.7.2. Market estimates and forecasts, By Location Type, 2017 - 2030 (USD Million)
- 8.4.7.3. Market estimates and forecasts, By Organization Size, 2017 - 2030 (USD Million)
- 8.4.7.4. Market estimates and forecasts, By Vertical, 2017 - 2030 (USD Million)
- 8.4.8. India
- 8.4.8.1. Market estimates and forecasts, By Component, 2017 - 2030 (USD Million)
- 8.4.8.2. Market estimates and forecasts, By Location Type, 2017 - 2030 (USD Million)
- 8.4.8.3. Market estimates and forecasts, By Organization Size, 2017 - 2030 (USD Million)
- 8.4.8.4. Market estimates and forecasts, By Vertical, 2017 - 2030 (USD Million)
- 8.5. Latin America
- 8.5.1. Market estimates and forecasts, 2017 - 2030
- 8.5.2. Market estimates and forecasts, By Component, 2017 - 2030 (USD Million)
- 8.5.3. Market estimates and forecasts, By Location Type, 2017 - 2030 (USD Million)
- 8.5.4. Market estimates and forecasts, By Organization Size, 2017 - 2030 (USD Million)
- 8.5.5. Market estimates and forecasts, By Vertical, 2017 - 2030 (USD Million)
- 8.5.6. Brazil
- 8.5.6.1. Market estimates and forecasts, By Component, 2017 - 2030 (USD Million)
- 8.5.6.2. Market estimates and forecasts, By Location Type, 2017 - 2030 (USD Million)
- 8.5.6.3. Market estimates and forecasts, By Organization Size, 2017 - 2030 (USD Million)
- 8.5.6.4. Market estimates and forecasts, By Vertical, 2017 - 2030 (USD Million)
- 8.5.7. Mexico
- 8.5.7.1. Market estimates and forecasts, By Component, 2017 - 2030 (USD Million)
- 8.5.7.2. Market estimates and forecasts, By Location Type, 2017 - 2030 (USD Million)
- 8.5.7.3. Market estimates and forecasts, By Organization Size, 2017 - 2030 (USD Million)
- 8.5.7.4. Market estimates and forecasts, By Vertical, 2017 - 2030 (USD Million)
- 8.6. Middle East & Africa
- 8.6.1. Market estimates and forecasts, 2017 - 2030
- 8.6.2. Market estimates and forecasts, By Component, 2017 - 2030 (USD Million)
- 8.6.3. Market estimates and forecasts, By Location Type, 2017 - 2030 (USD Million)
- 8.6.4. Market estimates and forecasts, By Organization Size, 2017 - 2030 (USD Million)
- 8.6.5. Market estimates and forecasts, By Vertical, 2017 - 2030 (USD Million)
Chapter 9. Competitive Analysis
- 9.1. Recent Developments and Impact Analysis, by Key Market Participants
- 9.2. Company/Competition Categorization (Key Innovators, Market Leaders, Emerging, Niche Players)
- 9.3. Vendor Landscape
- 9.3.1. Key company market share analysis, 2021
- 9.4. Company Analysis Tools
- 9.4.1. Market Position Analysis
- 9.4.2. Competitive Dashboard Analysis
Chapter 10. Competitive Landscape
- 10.1. Company Profiles
- 10.2. Cisco Systems
- 10.2.1. Company overview
- 10.2.2. Financial performance
- 10.2.3. Component benchmarking
- 10.2.4. Strategic initiatives
- 10.3. Huawei Technologies Co. Ltd
- 10.3.1. Company overview
- 10.3.2. Financial performance
- 10.3.3. Component benchmarking
- 10.3.4. Strategic initiatives
- 10.4. Commscope
- 10.4.1. Company overview
- 10.4.2. Financial performance
- 10.4.3. Component benchmarking
- 10.4.4. Strategic initiatives
- 10.5. Aruba
- 10.5.1. Company overview
- 10.5.2. Financial performance
- 10.5.3. Component benchmarking
- 10.5.4. Strategic initiatives
- 10.6. Singtel
- 10.6.1. Company overview
- 10.6.2. Financial performance
- 10.6.3. Component benchmarking
- 10.6.4. Strategic initiatives
- 10.7. Rogers Communications
- 10.7.1. Company overview
- 10.7.2. Financial performance
- 10.7.3. Component benchmarking
- 10.7.4. Strategic initiatives
- 10.8. Juniper Networks Inc
- 10.8.1. Company overview
- 10.8.2. Financial performance
- 10.8.3. Component benchmarking
- 10.8.4. Strategic initiatives
- 10.9. Dell Technologies
- 10.9.1. Company overview
- 10.9.2. Financial performance
- 10.9.3. Component benchmarking
- 10.9.4. Strategic initiatives
- 10.10. TP-Link
- 10.10.1. Company overview
- 10.10.2. Financial performance
- 10.10.3. Component benchmarking
- 10.10.4. Strategic initiatives
- 10.11. Extreme Networks
- 10.11.1. Company overview
- 10.11.2. Financial performance
- 10.11.3. Component benchmarking
- 10.11.4. Strategic initiatives
- 10.12. Fortinet
- 10.12.1. Company overview
- 10.12.2. Financial performance
- 10.12.3. Component benchmarking
- 10.12.4. Strategic initiatives
- 10.13. Arista Networks
- 10.13.1. Company overview
- 10.13.2. Financial performance
- 10.13.3. Component benchmarking
- 10.13.4. Strategic initiatives
- 10.14. D-Link Corporations
- 10.14.1. Company overview
- 10.14.2. Financial performance
- 10.14.3. Component benchmarking
- 10.14.4. Strategic initiatives
- 10.15. Cambium Networks
- 10.15.1. Company overview
- 10.15.2. Financial performance
- 10.15.3. Component benchmarking
- 10.15.4. Strategic initiatives
- 10.16. Superloop
- 10.16.1. Company overview
- 10.16.2. Financial performance
- 10.16.3. Component benchmarking
- 10.16.4. Strategic initiatives