|
|
市場調査レポート
商品コード
1114023
3Dプリント医薬品の市場規模、シェア&動向分析レポート:技術別(インクジェット印刷、Zipdose技術、ステレオリソグラフィー)、用途別(整形外科、神経)、最終用途別、地域別、セグメント別予測、2022年~2030年3D Printed Drugs Market Size, Share & Trends Analysis Report By Technology (Inkjet Printing, Zipdose Technology, Stereolithography), By Application (Orthopedic, Neurology), By End-use, Region, And Segment Forecasts, 2022 - 2030 |
||||||
|
|
|||||||
|
● お客様のご希望に応じて、既存データの加工や未掲載情報(例:国別セグメント)の追加などの対応が可能です。 詳細はお問い合わせください。 |
|||||||


| 3Dプリント医薬品の市場規模、シェア&動向分析レポート:技術別(インクジェット印刷、Zipdose技術、ステレオリソグラフィー)、用途別(整形外科、神経)、最終用途別、地域別、セグメント別予測、2022年~2030年 |
|
出版日: 2022年07月05日
発行: Grand View Research
ページ情報: 英文 150 Pages
納期: 2~10営業日
|
- 全表示
- 概要
- 図表
- 目次
3Dプリント医薬品市場の成長と動向
グランドビューリサーチ社の最新レポートによると、世界の3Dプリント医薬品市場は2030年までに2億6974万米ドルに達すると予測されています。
同市場は2022年から2030年にかけてCAGR15.32%で拡大すると予測されています。慢性疾患の有病率の上昇に加え、世界中で嚥下障害患者の人口が増加していることが、即溶性薬剤の需要を押し上げ、市場を牽引するものと思われます。例えば、2022年4月に発表された研究によると、中咽頭嚥下障害の有病率は脳卒中や加齢などの状態で高く、高齢者では26.19%と報告されています。
高齢化社会の増加に伴い、高齢者向けの飲み込みやすい錠剤の開発要望が高まっています。3Dプリントされた高溶解性で飲み込みやすい薬は、飲み込みが困難な高齢者を助けることができます。さらに、国連によると、2050年には65歳以上の高齢者が15億人になると予測されています。このように、世界の高齢者人口の増加が、飲み込みやすい薬の需要を促進し、市場の成長をもたらすと考えられます。
その他、医薬品需要の急速な拡大、ヘルスケアの技術向上、政府の3Dプリンティング産業への注力や支出なども、市場の成長に寄与しています。例えば、2022年3月、Evonik Venture Capitalは、3Dプリントタブレットの製造のため、ネバダ州のLaxxon Medicalに投資しました。後者の会社は、時間の経過とともにAPIの放出が制御された構造化錠剤を製造するための3Dスクリーン印刷技術を開発しました。こうした投資は、今後数年間の市場成長を補完するものと思われます。
COVID-19の大流行が市場成長にプラスの影響を与えると予想されます。先進的な製造業の事業会社によって、医薬品やその他の必要な製品の製造を増やすのに役立ついくつかのプリンターが発売されました。その結果、COVID-19の流行期間中は、これらの技術の利用が増加すると予測されます。
個別化医療に対する需要の高まりは、今後数年間、市場の成長を大きく促進すると予想されます。医薬品の3Dプリントは、慎重に調整された形状、用量、サイズの個別化医療を小ロットで製造できるため、近い将来、市場は指数関数的に成長すると予想されます。また、3Dプリンティング技術の利用により、製造コストを大幅に削減できるため、この分野への投資がさらに増加することが予想されます。
一方、これらの薬物による副作用、違法薬物の作成に3D印刷が使用されていること、3D印刷製品に対する政府の規制がないことなどが、市場の成長を制限しています。例えば、2018年3月には、アムステルダムで、これらの薬物を違法に取り扱ったとして、警察沙汰になったことがあります。しかし、即時溶解性、製造時間の短縮、廃棄物の削減、容易なオンデマンド製造など、これらの医薬品の利点に対する認知度の向上は、市場成長のための複数の展望を生み出すと思われます。
3Dプリント医薬品市場レポートハイライト
技術別では、ジップドーズセグメントが3D市場で最大のシェアを占めています。これは、口の中で素早く分散する速溶性薬剤への要求が高まっていることに起因しており、その結果、採用が進み、市場成長が見込まれます。
インクジェットプリンターセグメントは、予測期間中に有利に成長すると予想されます。3D医薬品は、各患者のニーズに合わせてカスタマイズできるため、バッチ生産された医薬品よりもはるかに多くの患者を支援し、その需要は今後数年間で急増すると予想されます。
用途別では、神経分野が世界市場で大きなシェアを占めています。これは、神経障害を発症するリスクの高い高齢者の割合が増加し、市場の成長を後押ししているためと考えられています。
エンドユーザー別では、個別化医療に対する需要の高まりと、この技術を採用したバイオ医薬品の費用対効果の高い利用により、2021年には病院・診療所セグメントが大きなシェアを占めました。
北米は、技術的に高度なヘルスケア研究の枠組みを利用できること、高い研究開発投資の存在、同地域での3Dプリント医薬品の開発などにより、2021年の世界市場を独占しています。
アジア太平洋地域は、慢性疾患の有病率の上昇と主要プレイヤーの存在により、将来的に大きく成長すると予想されます。
主要な市場プレイヤーの例としては、3Dプリンター・ドラッグマシン、Aprecia Pharmaceuticals、BV LLC、Hewlett Packard Caribe、その他が挙げられます。
目次
第1章 調査手法
- 市場セグメンテーションと範囲
- 推定・予測のタイムライン
- 調査手法
- 情報調達
- 購入したデータベース
- Gvrの内部データベース
- 二次情報
- 1次調査
- 1次調査の詳細
- 情報またはデータ分析
- データ分析モデル
- 市場の策定と検証
- モデルの詳細
- コモディティフロー分析
- アプローチ1:コモディティフローアプローチ
- アプローチ2:ボトムアップアプローチを使用した国別の市場推定
- コモディティフロー分析
- 世界市場:CAGR計算
- 調査の仮定
- 二次情報一覧
- 一次情報のリスト
- 目的
- 略語一覧
第2章 市場の定義
第3章 エグゼクティブサマリー
- 市場概要
第4章 世界の3Dプリント医薬品市場の変数、動向、および範囲
- 3Dプリント医薬品市場の系譜の見通し
- 親市場の見通し
- 浸透と成長の見通しのマッピング
- 規制の枠組み
- 市場促進要因分析
- 医療産業における3Dプリントの使用の増加
- 個別化された薬の採用の増加
- さまざまな業界での3Dプリントの複数のアプリケーション
- 瞬間的に溶ける錠剤の高い需要
- COVID-19の発生
- 市場制約分析
- 3Dプリント医薬品の限界
- 3Dプリント製品に対する政府の規制の欠如
- 市場機会分析
- 3Dプリント技術の認知度と採用の高まり
- ポーターのファイブフォース分析
- パイプライン分析
第5章 3Dプリント市場- セグメント分析、技術別、2018年-2030年(100万米ドル)
- 世界の3Dプリント医薬品市場:技術変動分析
- インクジェット印刷
- 溶融堆積モデリング
- 光造形
- ZipDoseテクノロジー
第6章 3Dプリント医薬品市場- セグメント分析、用途別、2018年-2030年(100万米ドル)
- 世界の3Dプリント医薬品市場:アプリケーションの変動分析
- 整形外科
- 神経学
- 歯科
- その他
第7章 3Dプリント医薬品市場セグメント分析、エンドユーザー別、2018~2030年(100万米ドル)
- 3Dプリント医薬品市場:エンドユーザーの変動分析
- 病院と診療所
- 調査
- その他
第8章 3Dプリント医薬品市場:- セグメント分析、地域別、2018年-2030年(100万米ドル)
- 3Dプリント医薬品市場:地域の変動分析
- 北米
- 米国
- カナダ
- 欧州
- 英国
- ドイツ
- スペイン
- フランス
- イタリア
- アジア太平洋地域
- 日本
- 中国
- インド
- 韓国
- ラテンアメリカ
- ブラジル
- メキシコ
- 中東およびアフリカ(MEA)
- 南アフリカ
- サウジアラビア
第9章 競合情勢
- 上場企業
- 会社の市況分析
- 競合ダッシュボード分析
- 戦略的枠組み
- 非上場企業
- 主要な新興企業/テクノロジーディスラプター/イノベーターのリスト
- 地域ネットワークマップ
- 企業プロファイル
- APRECIA PHARMACEUTICALS LLC
- 会社概要
- 株式会社アレール
- 財務実績
- 製品のベンチマーク
- 戦略的イニシアチブ
- EXTEND BIOSCIENCES
- 会社概要
- 財務実績
- 製品のベンチマーク
- 戦略的イニシアチブ
- BIODURO
- 会社概要
- 財務実績
- 製品のベンチマーク
- 戦略的イニシアチブ
- AFFINITY THERAPEUTICS
- 会社概要
- 財務実績
- 製品のベンチマーク
- 戦略的イニシアチブ
- OSMOTICA PHARMACEUTICALS
- 会社概要
- 財務実績
- 製品のベンチマーク
- 戦略的イニシアチブ
- ACRUX
- 会社概要
- 財務実績
- 製品のベンチマーク
- 戦略的イニシアチブ
- GLAXOSMITHKLINE PLC
- 会社概要
- 財務実績
- 製品のベンチマーク
- 戦略的イニシアチブ
- HEWLETT PACKARD CARIBE
- 会社概要
- 財務実績
- 製品のベンチマーク
- 戦略的イニシアチブ
- MERCK
- 会社概要
- 財務実績
- 製品のベンチマーク
- 戦略的イニシアチブ
- CYCLE PHARMACEUTICALS
- 会社概要
- 財務実績
- 製品のベンチマーク
- 戦略的イニシアチブ
- ASTRAZENECA
- 会社概要
- 財務実績
- 製品のベンチマーク
- 戦略的イニシアチブ
- FABRX LTD.
- 会社概要
- 財務実績
- 製品のベンチマーク
- 戦略的イニシアチブ
- APRECIA PHARMACEUTICALS LLC
List of Tables
- TABLE 1 List of Secondary Sources
- TABLE 2 Regulatory Framework
- TABLE 3 Global 3D printed drugs market estimates and forecasts by technology, 2018 - 2030 (USD Million)
- TABLE 4 Global 3D printed drugs market estimates and forecasts by application, 2018 - 2030 (USD Million)
- TABLE 5 3D printed drugs- Key market restraint
- TABLE 6 Global 3D printed drugs inkjet printing market by region, 2018 - 2030 (USD Million)
- TABLE 7 Global 3D printed drugs fused deposition modeling market by region, 2018 - 2030 (USD Million)
- TABLE 8 Global 3D printed drugs stereolithography market by region, 2018 - 2030 (USD Million)
- TABLE 9 Global 3D printed drugs ZipDose technology market by region, 2018 - 2030 (USD Million)
- TABLE 10 Global 3D printed drugs demand in orthopedic by region, 2018 - 2030 (USD Million)
- TABLE 11 Global 3D printed drugs demand in neurology by region, 2018 - 2030 (USD Million)
- TABLE 12 Global 3D printed drugs demand in dental by region, 2018 - 2030 (USD Million)
- TABLE 13 Global 3D printed drugs demand in other applications by region, 2018 - 2030 (USD Million)
- TABLE 14 Global 3D printed drugs demand in hospitals & clinics by region, 2018 - 2030 (USD Million)
- TABLE 15 Global 3D printed drugs demand in research laboratories by region, 2018 - 2030 (USD Million)
- TABLE 16 Global 3D printed drugs demand in other end-use by region, 2018 - 2030 (USD Million)
- TABLE 17 North America 3D printed drugs market by technology, 2018 - 2030 (USD Million)
- TABLE 18 North America 3D printed drugs market by application, 2018 - 2030 (USD Million)
- TABLE 19 North America 3D printed drugs market by end-use, 2018 - 2030 (USD Million)
- TABLE 20 U.S. 3D printed drugs market by technology, 2018 - 2030 (USD Million)
- TABLE 21 U.S. 3D printed drugs market by application, 2018 - 2030 (USD Million)
- TABLE 22 U.S. 3D printed drugs market by end-user, 2018 - 2030 (USD Million)
- TABLE 23 Canada 3D printed drugs market by technology, 2018 - 2030 (USD Million)
- TABLE 24 Canada 3D printed drugs market by application, 2018 - 2030 (USD Million)
- TABLE 25 Canada 3D printed drugs market by end-user, 2018 - 2030 (USD Million)
- TABLE 26 Europe 3D printed drugs market by technology, 2018 - 2030 (USD Million)
- TABLE 27 Europe 3D printed drugs market by application, 2018 - 2030 (USD Million)
- TABLE 28 Europe 3D printed drugs market by end-user, 2018 - 2030 (USD Million)
- TABLE 29 Germany 3D printed drugs market by technology, 2018 - 2030 (USD Million)
- TABLE 30 Germany 3D printed drugs market by application, 2018 - 2030 (USD Million)
- TABLE 31 Germany 3D printed drugs market by end-user, 2018 - 2030 (USD Million)
- TABLE 32 U.K. 3D printed drugs market by technology, 2018 - 2030 (USD Million)
- TABLE 33 U.K. 3D printed drugs market by application, 2018 - 2030 (USD Million)
- TABLE 34 U.K. 3D printed drugs market by end-user, 2018 - 2030 (USD Million)
- TABLE 35 France 3D printed drugs market by technology, 2018 - 2030 (USD Million)
- TABLE 36 France 3D printed drugs market by application, 2018 - 2030 (USD Million)
- TABLE 37 France 3D printed drugs market by end-user, 2018 - 2030 (USD Million)
- TABLE 38 Italy 3D printed drugs market by technology, 2018 - 2030 (USD Million)
- TABLE 39 Italy 3D printed drugs market by application, 2018 - 2030 (USD Million)
- TABLE 40 Italy 3D printed drugs market by end-user, 2018 - 2030 (USD Million)
- TABLE 41 Spain 3D printed drugs market by technology, 2018 - 2030 (USD Million)
- TABLE 42 Spain 3D printed drugs market by application, 2018 - 2030 (USD Million)
- TABLE 43 Spain 3D printed drugs market by end-user, 2018 - 2030 (USD Million)
- TABLE 44 Asia Pacific 3D printed drugs market by technology, 2018 - 2030 (USD Million)
- TABLE 45 Asia Pacific 3D printed drugs market by application, 2018 - 2030 (USD Million)
- TABLE 46 Asia Pacific 3D printed drugs market by end-user, 2018 - 2030 (USD Million)
- TABLE 47 China 3D printed drugs market by technology, 2018 - 2030 (USD Million)
- TABLE 48 China 3D printed drugs market by application, 2018 - 2030 (USD Million)
- TABLE 49 China 3D printed drugs market by end-user, 2018 - 2030 (USD Million)
- TABLE 50 India 3D printed drugs market by technology, 2018 - 2030 (USD Million)
- TABLE 51 India 3D printed drugs market by application, 2018 - 2030 (USD Million)
- TABLE 52 India 3D printed drugs market by end-user, 2018 - 2030 (USD Million)
- TABLE 53 Japan 3D printed drugs market by technology, 2018 - 2030 (USD Million)
- TABLE 54 Japan 3D printed drugs market by application, 2018 - 2030 (USD Million)
- TABLE 55 Japan 3D printed drugs market by end-user, 2018 - 2030 (USD Million)
- TABLE 56 South Korea 3D printed drugs market by technology, 2018 - 2030 (USD Million)
- TABLE 57 South Korea 3D printed drugs market by application, 2018 - 2030 (USD Million)
- TABLE 58 South Korea 3D printed drugs market by end-user, 2018 - 2030 (USD Million)
- TABLE 59 Latin America 3D printed drugs market by technology, 2018 - 2030 (USD Million)
- TABLE 60 Latin America 3D printed drugs market by application, 2018 - 2030 (USD Million)
- TABLE 61 Latin America 3D printed drugs market by end-user, 2018 - 2030 (USD Million)
- TABLE 62 Brazil 3D printed drugs market by technology, 2018 - 2030 (USD Million)
- TABLE 63 Brazil 3D printed drugs market by application, 2018 - 2030 (USD Million)
- TABLE 64 Brazil 3D printed drugs market by end-user, 2018 - 2030 (USD Million)
- TABLE 65 Mexico 3D printed drugs market by technology, 2018 - 2030 (USD Million)
- TABLE 66 Mexico 3D printed drugs market by application, 2018 - 2030 (USD Million)
- TABLE 67 Mexico 3D printed drugs market by end-user, 2018 - 2030 (USD Million)
- TABLE 68 MEA 3D printed drugs market by technology, 2018 - 2030 (USD Million)
- TABLE 69 MEA 3D printed drugs market by application, 2018 - 2030 (USD Million)
- TABLE 70 MEA 3D printed drugs market by end-user, 2018 - 2030 (USD Million)
- TABLE 71 South Africa 3D printed drugs market by technology, 2018 - 2030 (USD Million)
- TABLE 72 South Africa 3D printed drugs market by application, 2018 - 2030 (USD Million)
- TABLE 73 South Africa 3D printed drugs market by end-user, 2018 - 2030 (USD Million)
- TABLE 74 Saudi Arabia 3D printed drugs market by technology, 2018 - 2030 (USD Million)
- TABLE 75 Saudi Arabia 3D printed drugs market by application, 2018 - 2030 (USD Million)
- TABLE 76 Saudi Arabia 3D printed drugs market by end-user, 2018 - 2030 (USD Million)
List of Figures
- FIG. 1 3D printed drugs market segmentation
- FIG. 2 Information procurement
- FIG. 3 Primary research pattern
- FIG. 4 Market research approaches
- FIG. 5 Market formulation & validation
- FIG. 6 Commodity flow analysis
- FIG. 7 3D printed drugs market snapshot (2021)
- FIG. 8 Market segmentation
- FIG. 9 Penetration & growth prospect mapping
- FIG. 10 Consumer behavior analysis
- FIG. 11 Market driver relevance analysis (Current & future impact)
- FIG. 12 Market restraint relevance analysis (Current & future impact)
- FIG. 13 Porter's five forces analysis
- FIG. 15 3D printed drugs market technology outlook: Segment dashboard
- FIG. 16 3D printed drugs market: Technology movement analysis
- FIG. 17 Inkjet printing market, 2018 - 2030 (USD Million)
- FIG. 18 Fused deposition modeling market, 2018 - 2030 (USD Million)
- FIG. 19 Stereolithography market, 2018 - 2030 (USD Million)
- FIG. 20 ZipDose Technology market, 2018 - 2030 (USD Million)
- FIG. 21 3D printed drugs market application outlook: Segment dashboard
- FIG. 22 3D printed drugs market: Application movement analysis
- FIG. 23 Orthopedic market, 2018 - 2030 (USD Million)
- FIG. 24 Neurology market, 2018 - 2030 (USD Million)
- FIG. 25 Dental market, 2018 - 2030 (USD Million)
- FIG. 26 Other applications market, 2018 - 2030 (USD Million)
- FIG. 27 3D printed drugs market end-user outlook: Segment dashboard
- FIG. 28 3D printed drugs market: End-user movement analysis
- FIG. 29 Hospitals & clinics market, 2018 - 2030 (USD Million)
- FIG. 30 Research laboratories market, 2018 - 2030 (USD Million)
- FIG. 31 Other end-users market, 2018 - 2030 (USD Million)
- FIG. 32 Regional market: Key takeaways
- FIG. 33 Regional outlook, 2021 & 2030
- FIG. 34 North America 3D printed drugs market, 2018 - 2030 (USD Million)
- FIG. 35 U.S. 3D printed drugs market, 2018 - 2030 (USD Million)
- FIG. 36 Canada 3D printed drugs market, 2018 - 2030 (USD Million)
- FIG. 37 Europe 3D printed drugs market, 2018 - 2030 (USD Million)
- FIG. 38 U.K. 3D printed drugs market, 2018 - 2030 (USD Million)
- FIG. 39 Germany 3D printed drugs market, 2018 - 2030 (USD Million)
- FIG. 40 France 3D printed drugs market, 2018 - 2030 (USD Million)
- FIG. 41 Italy 3D printed drugs market, 2018 - 2030 (USD Million)
- FIG. 42 Spain 3D printed drugs market, 2018 - 2030 (USD Million)
- FIG. 43 Asia Pacific 3D printed drugs market, 2018 - 2030 (USD Million)
- FIG. 44 Japan 3D printed drugs market, 2018 - 2030 (USD Million)
- FIG. 45 China 3D printed drugs market, 2018 - 2030 (USD Million)
- FIG. 46 India 3D printed drugs market, 2018 - 2030 (USD Million)
- FIG. 47 South Korea 3D printed drugs market, 2018 - 2030 (USD Million)
- FIG. 48 Latin America 3D printed drugs market, 2018 - 2030 (USD Million)
- FIG. 49 Brazil 3D printed drugs market, 2018 - 2030 (USD Million)
- FIG. 50 Mexico 3D printed drugs market, 2018 - 2030 (USD Million)
- FIG. 51 MEA 3D printed drugs market, 2018 - 2030 (USD Million)
- FIG. 52 South Africa 3D printed drugs market, 2018 - 2030 (USD Million)
- FIG. 53 Saudi Arabia 3D printed drugs market, 2018 - 2030 (USD Million)
3D Printed Drugs Market Growth & Trends:
The global 3D printed drugs market is expected to reach USD 269.74 million by 2030, according to a new report by Grand View Research, Inc. The market is expected to expand at a CAGR of 15.32% from 2022 to 2030. The rising prevalence of chronic diseases, combined with the rising population of patients with dysphagia around the globe is pushing the demand for immediate soluble medications, which is likely to drive the market. For instance, according to a study published in April 2022, the prevalence of oropharyngeal dysphagia is high in conditions such as stroke and aging and is reported to be 26.19% in the elderly.
An increase in the aging population has led to the growing demand for the development of easy-to-swallow pills for the elderly. The 3D printed highly soluble and easy-to-swallow drugs can help the elderly who have difficulty swallowing. Moreover, according to the United Nations, the number of people aged 65 and more in 2050 is projected to be 1.5 billion. Thus, the growing elderly population across the world would propel the demand for easy-to-swallow drugs resulting in market growth.
Other factors such as quickly expanding demand for pharmaceuticals, technical improvements in healthcare, as well as the government's focus and expenditures in the 3D printing industry, are also contributing to the market's growth. For instance, in March 2022, Evonik Venture Capital invested in Nevada-based Laxxon Medical for the manufacturing of 3D-printed tablets. The latter company has developed a 3D screen-printing technology for the production of structured tablets with the controlled release of API over time. Such investments are likely to supplement the market growth in the coming years.
The COVID-19 pandemic is anticipated to positively impact market growth. Several printers have been launched by the operating companies in the advanced manufacturing industry to help increase the manufacturing of medications and other necessary products. As a result, the usage of these technologies is projected to increase during the COVID-19 pandemic.
The growing demand for personalized medicine is expected to majorly drive market growth in the coming years. As 3D printing of pharmaceutical drugs can produce personalized medicine in small batches with carefully tailored shapes, dosages, and sizes, the market is anticipated to grow at an exponential rate in the near future. In addition, the use of 3D printing technology can significantly reduce manufacturing costs thus, further increasing investments in this space.
On the other hand, adverse effects from these drugs, the use of 3D printing to create illegal drugs, and a lack of government restrictions for 3D printed products are limiting the market's growth. For instance, in March 2018, a police case was filed in Amsterdam, for the illegal handling of these drugs. However, increased awareness of the benefits of these medications, such as their immediate solubility, faster manufacturing time, reduced waste, and easy on-demand manufacturing is likely to create multiple prospects for market growth.
3D Printed Drugs Market Report Highlights:
- By technology, the zip dose segment held the largest share of the 3D market. This is attributed to the increase in the requirement for rapid soluble drugs that disperse quickly in the mouth, which in turn is likely to increase the adoption and anticipate market growth.
- The inkjet printer segment is expected to grow lucratively during the forecast period. Due to the 3D medications can be personalized to each patient's needs, assisting them far more than batch-produced medicines, their demand is expected to skyrocket in the coming years.
- By application, the neurology segment held a larger share of the global market. This is attributed to an increase in the proportion of older people, which is at an increased risk of developing neurological disorders and hence, propelling the market growth.
- By end-use, the hospitals & clinics segment held a larger share in 2021, owing to the growing demand for personalized medicines and the cost-effective use of bio-drugs employing this technology.
- North America dominated the global market in 2021 due to the availability of technologically advanced healthcare research framework, the presence of high R&D investment, and the development of 3D printed drugs in the region.
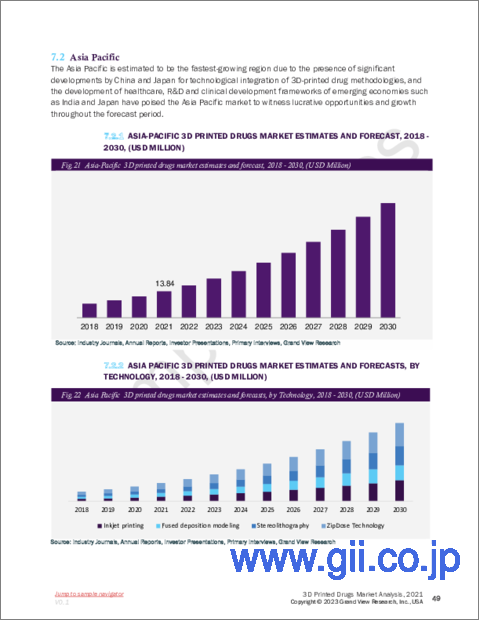
- The Asia Pacific is expected to grow considerably in the future owing to the rising prevalence of chronic diseases and the presence of key players.
- A few of the key market players include 3D Printer Drug Machine, Aprecia Pharmaceuticals, BV LLC, Hewlett Packard Caribe, and others.
Table of Contents
Chapter 1 Research Methodology
- 1.1 Market Segmentation & Scope
- 1.1.1 Estimates And Forecast Timeline
- 1.2 Research Methodology
- 1.3 Information Procurement
- 1.3.1 Purchased Database
- 1.3.2 Gvr's Internal Database
- 1.3.3 Secondary Sources
- 1.3.4 Primary Research
- 1.3.5 Details Of Primary Research
- 1.4 Information or Data Analysis
- 1.4.1 Data Analysis Models
- 1.5 Market Formulation & Validation
- 1.6 Model Details
- 1.6.1 Commodity Flow Analysis
- 1.6.1.1 Approach 1: Commodity flow approach
- 1.6.1.2 Approach 2: Country-wise market estimation using bottom-up approach
- 1.6.1 Commodity Flow Analysis
- 1.7 Global Market: CAGR Calculation
- 1.8 Research Assumptions
- 1.9 List of Secondary Sources
- 1.10 List of Primary Sources
- 1.11 Objectives
- 1.11.1 Objective 1:
- 1.11.2 Objective 2:
- 1.12 List of Abbreviations
Chapter 2 Market Definitions
Chapter 3 Executive Summary
- 3.1 Market Summary
Chapter 4 Global 3D Printed Drugs Market Variables, Trends, & Scope
- 4.1 3D Printed Drugs Market Lineage Outlook
- 4.1.1 Parent Market Outlook
- 4.2 Penetration and Growth Prospect Mapping
- 4.3 Regulatory Framework
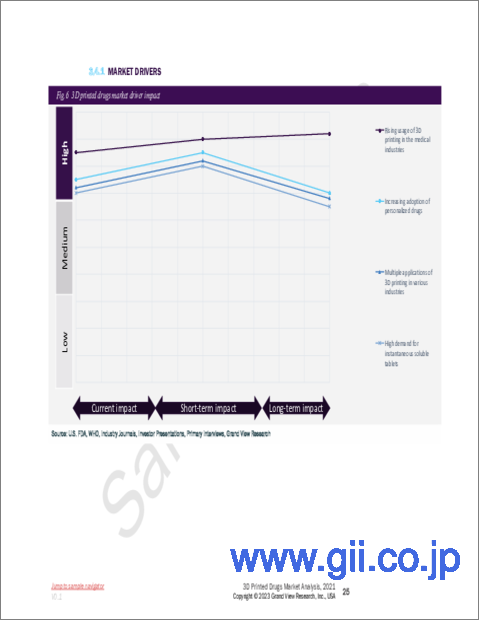
- 4.4 Market Driver Analysis
- 4.4.1 Rising Usage Of 3D Printing In The Medical Industries
- 4.4.2 Increasing Adoption Of Personalized Drugs
- 4.4.3 Multiple Applications Of 3D Printing In Various Industries
- 4.4.4 High Demand For Instantaneous Soluble Tablets
- 4.4.5 Outbreak Of Covid-19
- 4.5 Market Restraint Analysis
- 4.5.1 Limitations Of 3D Printed Medicines
- 4.5.2 Lack Of Government Regulations For 3D Printed Products
- 4.6 Market Opportunity Analysis
- 4.6.1 Rising Awareness And Adoption Of The 3D Printing Technology
- 4.7 Porter's Five Forces Analysis
- 4.8 Pipeline Analysis
Chapter 5 3D Printed Market - Segment Analysis, by technology, 2018 - 2030 (USD Million)
- 5.1 Global 3D Printed Drugs Market: Technology Movement Analysis
- 5.2 Inkjet Printing
- 5.2.1 Inkjet Printing Market Estimates And Forecast, 2018 - 2030 (USD Million)
- 5.3 Fused Deposition Modeling
- 5.3.1 Fused Deposition Modeling Market Estimates And Forecast, 2018 - 2030 (USD Million)
- 5.4 Stereolithography
- 5.4.1 Stereolithography Market Estimates And Forecast, 2018 - 2030 (USD Million)
- 5.5 ZipDose Technology
- 5.5.1 Zipdose Technology Market Estimates And Forecast, 2018 - 2030 (USD Million)
Chapter 6 3D Printed Drugs Market - Segment Analysis, by Application, 2018 - 2030 (USD Million)
- 6.1 Global 3D Printed Drugs Market: Application Movement Analysis
- 6.2 Orthopedic
- 6.2.1 Orthopedic Market Estimates And Forecast, 2018 - 2030 (USD Million)
- 6.3 Neurology
- 6.3.1 Neurology Market Estimates And Forecast, 2018 - 2030 (USD Million)
- 6.4 Dental
- 6.4.1 Dental Market Estimates And Forecast, 2018 - 2030 (USD Million)
- 6.5 Others
- 6.5.1 Other Market Estimates And Forecast, 2018 - 2030 (USD Million)
Chapter 7 3D Printed Drugs Market- Segment Analysis, By End-User, 2018 - 2030 (USD Million)
- 7.1 3D Printed Drugs Market: End-User Movement Analysis
- 7.2 Hospitals & Clinics
- 7.2.1 Hospitals & Clinics Market Estimates And Forecast, 2018 - 2030 (USD Million)
- 7.3 Research Laboratories
- 7.3.1 Research Laboratories Market Estimates And Forecast, 2018 - 2030 (USD Million)
- 7.4. Others
- 7.4.1 Other Market Estimates And Forecast, 2018 - 2030 (USD Million)
Chapter 8 3D Printed Drugs Market: - Segment Analysis, by Region, 2018 - 2030 (USD Million)
- 8.1 3D Printed Drugs Market: Regional Movement Analysis
- 8.2 North America
- 8.2.1 North America Market Estimates And Forecast, 2018 - 2030 (USD Million)
- 8.2.2 U.S.
- 8.2.2.1 U.S. Market Estimates And Forecast, 2018 - 2030 (USD Million)
- 8.2.3 Canada
- 8.2.3.1 Canada Market Estimates And Forecast, 2018 - 2030 (USD Million)
- 8.3 Europe
- 8.3.1 Europe Market Estimates And Forecast, 2018 - 2030 (USD Million)
- 8.3.2 U.K.
- 8.3.2.1 U.K. Market Estimates And Forecast, 2018 - 2030 (USD Million)
- 8.3.3. Germany
- 8.3.3.1 Germany Market Estimates And Forecast, 2018 - 2030 (USD Million)
- 8.3.4 Spain
- 8.3.4.1 Spain Market Estimates And Forecast, 2018 - 2030 (USD Million)
- 8.3.5 France
- 8.3.5.1 France Market Estimates And Forecast, 2018 - 2030 (USD Million)
- 8.3.6 Italy
- 8.3.6.1 Italy Market Estimates And Forecast, 2018 - 2030 (USD Million)
- 8.4 Asia Pacific
- 8.4.1 Asia Pacific Market Estimates And Forecast, 2018 - 2030 (USD Million)
- 8.4.2 Japan
- 8.4.2.1 Japan Market Estimates And Forecast, 2018 - 2030 (USD Million)
- 8.4.3 China
- 8.4.3.1 China Market Estimates And Forecast, 2018 - 2030 (USD Million)
- 8.4.4 India
- 8.4.4.1 India Market Estimates And Forecast, 2018 - 2030
- 8.4.5 South Korea
- 8.4.5.1 South Korea Market Estimates And Forecast, 2018 - 2030
- 8.5 Latin America
- 8.5.1 Latin America Market Estimates And Forecast, 2018 - 2030 (USD Million)
- 8.5.2 Brazil
- 8.5.2.1 Brazil Market Estimates And Forecast, 2018 - 2030 (USD Million)
- 8.5.3 Mexico
- 8.5.3.1 Mexico Market estimates and forecast, 2018 - 2030 (USD Million)
- 8.6 Middle East & Africa (MEA)
- 8.6.1 Middle East & Africa Market Estimates And Forecast, 2018 - 2030 (USD Million)
- 8.6.2. South Africa
- 8.6.2.1 South Africa Market Estimates And Forecast, 2018 - 2030 (USD Million)
- 8.6.3 Saudi Arabia
- 8.6.3.1 Saudi Arabia market estimates and forecast, 2018 - 2030 (USD Million)
Chapter 9 Competitive Landscape
- 9.1 Public Companies
- 9.1.1 Company Market Position Analysis
- 9.1.2 Competitive Dashboard Analysis
- 9.1.3 Strategic Framework
- 9.2 Private Companies
- 9.2.1 List Of Key Emerging Companies/Technology Disruptors/Innovators
- 9.2.2 Regional Network Map
- 9.3 Company Profiles
- 9.3.1 APRECIA PHARMACEUTICALS LLC
- 9.3.1.1 Company Overview
- 9.3.1.2 Alere, Inc.
- 9.3.1.3 Financial Performance
- 9.3.1.4 Product Benchmarking
- 9.3.1.5 Strategic Initiatives
- 9.3.2 EXTEND BIOSCIENCES
- 9.3.2.1 Company Overview
- 9.3.2.2 Financial Performance
- 9.3.2.3 Product Benchmarking
- 9.3.2.4 Strategic Initiatives
- 9.3.3 BIODURO
- 9.3.3.1 Company Overview
- 9.3.3.2 Financial Performance
- 9.3.3.3 Product Benchmarking
- 9.3.3.4 Strategic Initiatives
- 9.3.4 AFFINITY THERAPEUTICS
- 9.3.4.1 Company Overview
- 9.3.4.2 Financial Performance
- 9.3.4.3 Product Benchmarking
- 9.3.4.4 Strategic Initiatives
- 9.3.5 OSMOTICA PHARMACEUTICALS
- 9.3.5.1 Company Overview
- 9.3.5.2 Financial Performance
- 9.3.5.3 Product Benchmarking
- 9.3.5.4 Strategic Initiatives
- 9.3.6 ACRUX
- 9.3.6.1 Company Overview
- 9.3.6.2 Financial Performance
- 9.3.6.3 Product Benchmarking
- 9.3.6.4 Strategic Initiatives
- 9.3.7 GLAXOSMITHKLINE PLC
- 9.3.7.1 Company Overview
- 9.3.7.2 Financial Performance
- 9.3.7.3 Product Benchmarking
- 9.3.7.4 Strategic Initiatives
- 9.3.8 HEWLETT PACKARD CARIBE
- 9.3.8.1 Company Overview
- 9.3.8.2 Financial Performance
- 9.3.8.3 Product Benchmarking
- 9.3.8.4 Strategic Initiatives
- 9.3.9 MERCK
- 9.3.9.1 Company Overview
- 9.3.9.2 Financial Performance
- 9.3.9.3 Product Benchmarking
- 9.3.9.4 Strategic Initiatives
- 9.3.10 CYCLE PHARMACEUTICALS
- 9.3.10.1 Company Overview
- 9.3.10.2 Financial Performance
- 9.3.10.3 Product Benchmarking
- 9.3.10.4 Strategic Initiatives
- 9.3.11 ASTRAZENECA
- 9.3.11.1 Company Overview
- 9.3.11.2 Financial Performance
- 9.3.11.3 Product Benchmarking
- 9.3.11.4 Strategic Initiatives
- 9.3.12 FABRX LTD.
- 9.3.12.1 Company Overview
- 9.3.12.2 Financial Performance
- 9.3.12.3 Product Benchmarking
- 9.3.12.4 Strategic Initiatives
- 9.3.1 APRECIA PHARMACEUTICALS LLC