|
|
市場調査レポート
商品コード
1092678
賦形剤の市場規模・市場シェア・動向分析 (2022-2030年):タイプ (ポリマー・アルコール・糖・ミネラル・ゼラチン)・地域別Excipients Market Size, Share & Trends Analysis Report By Type (Polymers, Alcohols, Sugars, Minerals, Gelatin), By Region, And Segment Forecasts, 2022 - 2030 |
||||||
|
|
|||||||
|
● お客様のご希望に応じて、既存データの加工や未掲載情報(例:国別セグメント)の追加などの対応が可能です。 詳細はお問い合わせください。 |
|||||||


| 賦形剤の市場規模・市場シェア・動向分析 (2022-2030年):タイプ (ポリマー・アルコール・糖・ミネラル・ゼラチン)・地域別 |
|
出版日: 2022年05月19日
発行: Grand View Research
ページ情報: 英文 104 Pages
納期: 2~10営業日
|
- 全表示
- 概要
- 図表
- 目次
世界の賦形剤の市場規模は予測期間中6.0%のCAGRで推移し、2030年には93億7,000万米ドルの規模に成長すると予測されています。
ジェネリック医薬品の世界的な普及が同市場の成長の主な要因となっています。また、薬物送達や安全性上の利点から、新しい賦形剤への需要が高まっていることも市場成長の要因となっています。
当レポートでは、世界の賦形剤の市場を調査し、市場概要、市場成長への各種影響因子の分析、市場規模の推移・予測、各種区分・地域/主要国別の内訳、競合環境、市場シェア、主要企業のプロファイルなどをまとめています。
目次
第1章 調査手法・調査範囲
第2章 エグゼクティブサマリー
第3章 賦形剤市場の可変因子・動向・展望
- 市場の分類・範囲
- 製品の普及・成長の見通しマッピング
- SWOT分析
- ポーターの分析
第4章 賦形剤市場:製品別の推計・動向分析
- 動向分析
- ポリマー
- 微結晶性セルロース (MCC)
- ヒドロキシプロピルメチルセルロース (HPMC)
- エチルセルロース
- メチルセルロース
- カルボキシメチルセルロース (CMC)
- クロスカルメロースナトリウム
- ポビドン
- アルファ化デンプン
- デンプングリコール酸ナトリウム
- ポリエチレングリコール
- アクリルポリマー
- アルコール
- グリセリン
- プロピレングリコール
- ソルビトール
- マンニトール
- その他
- ミネラル
- リン酸カルシウム
- 炭酸カルシウム
- 粘土
- 二酸化ケイ素
- 二酸化チタン
- その他
- 糖
- 乳糖
- スクロース
- その他
- ゼラチン
第5章 市場の分類:地域・製品別の推計・動向分析
- 動向分析
- 北米
- 欧州
- アジア太平洋
- ラテンアメリカ
- 中東・アフリカ
第6章 競合情勢
- 戦略的枠組み
- 参入事業者の分類
- 企業プロファイル
- Eastman Chemical Corporation
- P&G
- Avantor Performance Materials, LLC
- Huntsman Corporation
- BASF SE
- Ashland Inc.
- FMC Corporation
- Roquette
- Colorcon Inc.
- Lubrizol Corporation
- Valeant
- JRS PHARMA
- Shin-Etsu Chemical Co., Ltd
- DFE pharma
- FINAR LIMITED
List of Tables
- Table 1 North America excipients market, by product, 2018 - 2030 revenue (USD Million)
- Table 2 North America excipients market, by product, 2018 - 2030, volume (tons)
- Table 3 North America polymer excipients market, Revenue, 2018 - 2030 (USD Million)
- Table 4 North America polymer excipients market, Volume, 2018 - 2030 (tons)
- Table 5 North America alcohol excipients market, Revenue, 2018 - 2030 (USD Million)
- Table 6 North America alcohol excipients market, Volume, 2018 - 2030 (tons)
- Table 7 North America sugar excipients market, Revenue, 2018 - 2030 (USD Million)
- Table 8 North America sugar excipients market, Volume, 2018 - 2030 (tons)
- Table 9 North America minerals excipients market, Revenue, 2018 - 2030 (USD Million)
- Table 10 North America minerals excipients market, Volume, 2018 - 2030 (tons)
- Table 11 U.S. excipients market, by product, 2018 - 2030 revenue (USD Million)
- Table 12 U.S. excipients market, by product, 2018 - 2030, volume (tons)
- Table 13 U.S. polymer excipients market, Revenue, 2018 - 2030 (USD Million)
- Table 14 U.S. polymer excipients market, Volume, 2018 - 2030 (tons)
- Table 15 U.S. alcohol excipients market, Revenue, 2018 - 2030 (USD Million)
- Table 16 U.S. alcohol excipients market, Volume, 2018 - 2030 (tons)
- Table 17 U.S. sugar excipients market, Revenue, 2018 - 2030 (USD Million)
- Table 18 U.S. sugar excipients market, Volume, 2018 - 2030 (tons)
- Table 19 U.S. minerals excipients market, Revenue, 2018 - 2030 (USD Million)
- Table 20 U.S. minerals excipients market, Volume, 2018 - 2030 (tons)
- Table 21 Canada excipients market, by product, 2018 - 2030 revenue (USD Million)
- Table 22 Canada excipients market, by product, 2018 - 2030, volume (tons)
- Table 23 Canada polymer excipients market, Revenue, 2018 - 2030 (USD Million)
- Table 24 Canada polymer excipients market, Volume, 2018 - 2030 (tons)
- Table 25 Canada alcohol excipients market, Revenue, 2018 - 2030 (USD Million)
- Table 26 Canada alcohol excipients market, Volume, 2018 - 2030 (tons)
- Table 27 Canada sugar excipients market, Revenue, 2018 - 2030 (USD Million)
- Table 28 Canada sugar excipients market, Volume, 2018 - 2030 (tons)
- Table 29 Canada minerals excipients market, Revenue, 2018 - 2030 (USD Million)
- Table 30 Canada minerals excipients market, Volume, 2018 - 2030 (tons)
- Table 31 Europe excipients market, by product, 2018 - 2030 revenue (USD Million)
- Table 32 Europe excipients market, by product, 2018 - 2030, volume (tons)
- Table 33 Europe polymer excipients market, Revenue, 2018 - 2030 (USD Million)
- Table 34 Europe polymer excipients market, Volume, 2018 - 2030 (tons)
- Table 35 Europe alcohol excipients market, Revenue, 2018 - 2030 (USD Million)
- Table 36 Europe alcohol excipients market, Volume, 2018 - 2030 (tons)
- Table 37 Europe sugar excipients market, Revenue, 2018 - 2030 (USD Million)
- Table 38 Europe sugar excipients market, Volume, 2018 - 2030 (tons)
- Table 39 Europe minerals excipients market, Revenue, 2018 - 2030 (USD Million)
- Table 40 Europe minerals excipients market, Volume, 2018 - 2030 (tons)
- Table 41 Germany excipients market, by product, 2018 - 2030 revenue (USD Million)
- Table 42 Germany excipients market, by product, 2018 - 2030, volume (tons)
- Table 43 Germany polymer excipients market, Revenue, 2018 - 2030 (USD Million)
- Table 44 Germany polymer excipients market, Volume, 2018 - 2030 (tons)
- Table 45 Germany alcohol excipients market, Revenue, 2018 - 2030 (USD Million)
- Table 46 Germany alcohol excipients market, Volume, 2018 - 2030 (tons)
- Table 47 Germany sugar excipients market, Revenue, 2018 - 2030 (USD Million)
- Table 48 Germany sugar excipients market, Volume, 2018 - 2030 (tons)
- Table 49 Germany minerals excipients market, Revenue, 2018 - 2030 (USD Million)
- Table 50 Germany minerals excipients market, Volume, 2018 - 2030 (tons)
- Table 51 Asia Pacific excipients market, by product, 2018 - 2030 revenue (USD Million)
- Table 52 Asia Pacific excipients market, by product, 2018 - 2030, volume (tons)
- Table 53 Asia Pacific polymer excipients market, Revenue, 2018 - 2030 (USD Million)
- Table 54 Asia Pacific polymer excipients market, Volume, 2018 - 2030 (tons)
- Table 55 Asia Pacific alcohol excipients market, Revenue, 2018 - 2030 (USD Million)
- Table 56 Asia Pacific alcohol excipients market, Volume, 2018 - 2030 (tons)
- Table 57 Asia Pacific sugar excipients market, Revenue, 2018 - 2030 (USD Million)
- Table 58 Asia Pacific sugar excipients market, Volume, 2018 - 2030 (tons)
- Table 59 Asia Pacific minerals excipients market, Revenue, 2018 - 2030 (USD Million)
- Table 60 Asia Pacific minerals excipients market, Volume, 2018 - 2030 (tons)
- Table 61 Japan excipients market, by product, 2018 - 2030 revenue (USD Million)
- Table 62 Japan excipients market, by product, 2018 - 2030, volume (tons)
- Table 63 Japan polymer excipients market, Revenue, 2018 - 2030 (USD Million)
- Table 64 Japan polymer excipients market, Volume, 2018 - 2030 (tons)
- Table 65 Japan alcohol excipients market, Revenue, 2018 - 2030 (USD Million)
- Table 66 Japan alcohol excipients market, Volume, 2018 - 2030 (tons)
- Table 67 Japan sugar excipients market, Revenue, 2018 - 2030 (USD Million)
- Table 68 Japan sugar excipients market, Volume, 2018 - 2030 (tons)
- Table 69 Japan minerals excipients market, Revenue, 2018 - 2030 (USD Million)
- Table 70 Japan minerals excipients market, Volume, 2018 - 2030 (tons)
- Table 71 Latin America excipients market, by product, 2018 - 2030 revenue (USD Million)
- Table 72 Latin America excipients market, by product, 2018 - 2030, volume (tons)
- Table 73 Latin America polymer excipients market, Revenue, 2018 - 2030 (USD Million)
- Table 74 Latin America polymer excipients market, Volume, 2018 - 2030 (tons)
- Table 75 Latin America alcohol excipients market, Revenue, 2018 - 2030 (USD Million)
- Table 76 Latin America alcohol excipients market, Volume, 2018 - 2030 (tons)
- Table 77 Latin America sugar excipients market, Revenue, 2018 - 2030 (USD Million)
- Table 78 Latin America sugar excipients market, Volume, 2018 - 2030 (tons)
- Table 79 Latin America minerals excipients market, Revenue, 2018 - 2030 (USD Million)
- Table 80 Latin America minerals excipients market, Volume, 2018 - 2030 (tons)
- Table 81 Brazil excipients market, by product, 2018 - 2030 revenue (USD Million)
- Table 82 Brazil excipients market, by product, 2018 - 2030, volume (tons)
- Table 83 Brazil polymer excipients market, Revenue, 2018 - 2030 (USD Million)
- Table 84 Brazil polymer excipients market, Volume, 2018 - 2030 (tons)
- Table 85 Brazil alcohol excipients market, Revenue, 2018 - 2030 (USD Million)
- Table 86 Brazil alcohol excipients market, Volume, 2018 - 2030 (tons)
- Table 87 Brazil sugar excipients market, Revenue, 2018 - 2030 (USD Million)
- Table 88 Brazil sugar excipients market, Volume, 2018 - 2030 (tons)
- Table 89 Brazil minerals excipients market, Revenue, 2018 - 2030 (USD Million)
- Table 90 Brazil minerals excipients market, Volume, 2018 - 2030 (tons)
- Table 91 Middle East & Africa excipients market, by product, 2018 - 2030 revenue (USD Million)
- Table 92 Middle East & Africa excipients market, by product, 2018 - 2030, volume (tons)
- Table 93 Middle East & Africa polymer excipients market, Revenue, 2018 - 2030 (USD Million)
- Table 94 Middle East & Africa polymer excipients market, Volume, 2018 - 2030 (tons)
- Table 95 Middle East & Africa alcohol excipients market, Revenue, 2018 - 2030 (USD Million)
- Table 96 Middle East & Africa alcohol excipients market, Volume, 2018 - 2030 (tons)
- Table 97 Middle East & Africa sugar excipients market, Revenue, 2018 - 2030 (USD Million)
- Table 98 Middle East & Africa sugar excipients market, Volume, 2018 - 2030 (tons)
- Table 99 Middle East & Africa minerals excipients market, Revenue, 2018 - 2030 (USD Million)
- Table 100 Middle East & Africa minerals excipients market, Volume, 2018 - 2030 (tons)
- Table 101 South Africa excipients market, by product, 2018 - 2030 revenue (USD Million)
- Table 102 South Africa excipients market, by product, 2018 - 2030, volume (tons)
- Table 103 South Africa polymer excipients market, Revenue, 2018 - 2030 (USD Million)
- Table 104 South Africa polymer excipients market, Volume, 2018 - 2030 (tons)
- Table 105 South Africa alcohol excipients market, Revenue, 2018 - 2030 (USD Million)
- Table 106 South Africa alcohol excipients market, Volume, 2018 - 2030 (tons)
- Table 107 South Africa sugar excipients market, Revenue, 2018 - 2030 (USD Million)
- Table 108 South Africa sugar excipients market, Volume, 2018 - 2030 (tons)
- Table 109 South Africa minerals excipients market, Revenue, 2018 - 2030 (USD Million)
- Table 110 South Africa minerals excipients market, Volume, 2018 - 2030 (tons)
List of Figures
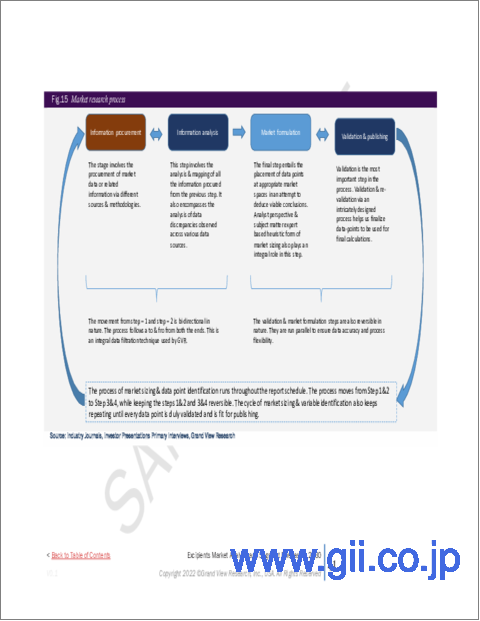
- Fig. 1 Market research process
- Fig. 2 Information Procurement
- Fig. 3 Primary research pattern
- Fig. 4 Market research approaches
- Fig. 5 Value chain based sizing & forecasting
- Fig. 6 QFD modelling for market share assessment
- Fig. 7 Market summary
- Fig. 8 Market trends & outlook
- Fig. 9 Market segmentation & scope
- Fig. 10 Market driver relevance analysis (Current & future impact)
- Fig. 11 Major drugs that lost patent protection in 2021 (Revenue in USD million)
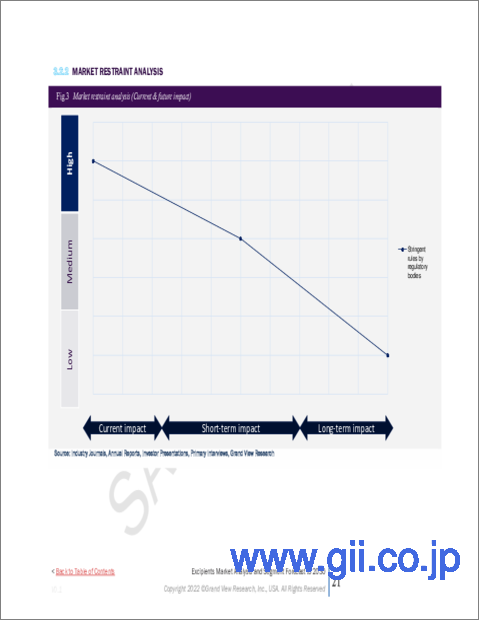
- Fig. 12 Market restraint relevance analysis (Current & future impact)
- Fig. 13 Penetration & growth prospect mapping for Products, 2021
- Fig. 14 SWOT Analysis, By Factor (political & legal, economic and technological)
- Fig. 15 Porter's Five Forces Analysis
- Fig. 16 Global excipients market: Product outlook key takeaways
- Fig. 17 Global excipients market: Product movement analysis
- Fig. 18 Global polymers market, 2018 - 2030 (USD Million, Tons)
- Fig. 19 Global MCC market, 2018 - 2030 (USD Million, Tons)
- Fig. 20 Global HPMC market, 2018 - 2030 (USD Million, Tons)
- Fig. 21 Global ethyl cellulose market, 2018 - 2030 (USD Million, Tons)
- Fig. 22 Global methyl cellulose market, 2018 - 2030 (USD Million, Tons)
- Fig. 23 Global CMC market, 2018 - 2030 (USD Million, Tons)
- Fig. 24 Global croscarmellose sodium market, 2018 - 2030 (USD Million, Tons)
- Fig. 25 Global povidone market, 2018 - 2030 (USD Million, Tons)
- Fig. 26 Global pregelatinized starch market, 2018 - 2030 (USD Million, Tons)
- Fig. 27 Global sodium starch glycolate market, 2018 - 2030 (USD Million, Tons)
- Fig. 28 Global polyethylene glycol market, 2018 - 2030 (USD Million, Tons)
- Fig. 29 Global acrylic polymers market, 2018 - 2030 (USD Million, Tons)
- Fig. 30 Global alcohol market, 2018 - 2030 (USD Million, Tons)
- Fig. 31 Global glycerine market, 2018 - 2030 (USD Million, Tons)
- Fig. 32 Global propylene glycol market, 2018 - 2030 (USD Million, Tons)
- Fig. 33 Global sorbitol market, 2018 - 2030 (USD Million, Tons)
- Fig. 34 Global mannitol market, 2018 - 2030 (USD Million, Tons)
- Fig. 35 Global other alcohol market, 2018 - 2030 (USD Million, Tons)
- Fig. 36 Global minerals market, 2018 - 2030 (USD Million, Tons)
- Fig. 37 Global calcium phosphate market, 2018 - 2030 (USD Million, Tons)
- Fig. 38 Global calcium carbonate market, 2018 - 2030 (USD Million, Tons)
- Fig. 39 Global clay market, 2018 - 2030 (USD Million, Tons)
- Fig. 40 Global silicon dioxide market, 2018 - 2030 (USD Million, Tons)
- Fig. 41 Global titanium dioxide market, 2018 - 2030 (USD Million, Tons)
- Fig. 42 Global other minerals market, 2018 - 2030 (USD Million, Tons)
- Fig. 43 Global sugar market, 2018 - 2030 (USD Million, Tons)
- Fig. 44 Global lactose market, 2018 - 2030 (USD Million, Tons)
- Fig. 45 Global sucrose market, 2018 - 2030 (USD Million, Tons)
- Fig. 46 Global other excipients market, 2018 - 2030 (USD Million, Tons)
- Fig. 47 Global gelatin market, 2018 - 2030 (USD Million, Tons)
- Fig. 48 Regional market place: Key takeaway
- Fig. 49 Excipients regional outlook, 2021 & 2030
- Fig. 50 North America excipients market, 2018 - 2030 (USD Million, Tons)
- Fig. 51 U.S. excipients market, 2018 - 2030 (USD Million, Tons)
- Fig. 52 Canada excipients market, 2018 - 2030 (USD Million, Tons)
- Fig. 53 Europe excipients market, 2018 - 2030 (USD Million, Tons)
- Fig. 54 Germany excipients market, 2018 - 2030 (USD Million, Tons)
- Fig. 55 Asia Pacific excipients market, 2018 - 2030 (USD Million, Tons)
- Fig. 56 Japan excipients market, 2018 - 2030 (USD Million, Tons)
- Fig. 57 Latin America excipients market, 2018 - 2030 (USD Million, Tons)
- Fig. 58 Brazil excipients market, 2018 - 2030 (USD Million, Tons)
- Fig. 59 Middle East & Africa excipients market, 2018 - 2030 (USD Million, Tons)
- Fig. 60 South Africa excipients market, 2018 - 2030 (USD Million, Tons)
- Fig. 61 Strategy framework
- Fig. 62 Participant categorization
Excipients Market Growth & Trends:
The global excipients market size is expected to reach USD 9.37 billion by 2030, expanding at a CAGR of 6.0% for the forecast period from 2022 to 2030, according to a new report by Grand View Research, Inc. Globally increasing reach of generic medicines has been a major factor driving market growth. In addition, rising demand for newer excipients owing to the advantages of drug delivery and stability has led to the growth of the market.
Excipients are essential components for the improvement of overall pharmaceutical activity and performance, both of which directly impact the characteristics of pharmaceutical formulations. An excipient in the right proportion can improve the shelf life and bioavailability of a formulation. These can also be used in drug delivery mechanisms such as sustained release and rapid release drugs.
Polymers were the largest product category in 2021 based on revenue and volume and are expected to maintain a comparatively moderate growth rate over the forecast period. Microcrystalline cellulose was the leading polymer in this category, accounting for a share of over 26.0% in 2021.
Sugars are expected to observe the fastest growth over the coming years, exhibiting an estimated CAGR of 6.9% from 2022 to 2030. Sugars can play an instrumental role in increasing solubility, taste masking, dissolution, and drug delivery, which can drive its market.
The Market is significantly driven by the increasing demand for pharmaceutical products due to the COVID-10 virus outbreak. The development of the COVID-19 vaccine was one of the major drivers for this market growth. Many key organizations capitalized on the opportunities that arose during the pandemic and witnessed significant growth.
Excipients Market Report Highlights:
- The global excipients demand exceeded 776,000 tons in 2021 and is expected to grow at a moderate rate from 2022 to 2030
- Owing to high market demand, polymer excipients accounted for the largest revenue share in 2021 and the segment can be anticipated to dominate the market for the coming years as well
- The global demand for sugars excipients was valued at over USD 1.85 billion in 2021 and is anticipated to witness significant growth over the coming years
- The Europe polymers market was pegged at 230,500 tons in 2021 and is estimated to reach a total volume of over 328,000 tons by 2030
- The market in Asia Pacific is projected to witness substantial growth over the course of the forecast period thanks to several development projects undertaken across major economies, especially in newer excipients markets. The regional market is expected to register a CAGR of 6.6% from 2022 to 2030
Table of Contents
Chapter 1. Research Methodology
- 1.1 Region Wise Market Calculation
- 1.1.1 Region Wise Market: Base Estimates
- 1.1.2 Global Market: CAGR Calculation
- 1.2 Region based segment share calculation
- 1.3 Data Analysis
- 1.4 List of Primary & Secondary Sources
Chapter 2. Executive Summary
- 2.1 Market Snapshot
Chapter 3. Excipients Market Variables, Trends & Scope
- 3.1 Market Segmentation & Scope
- 3.1.1 Market driver analysis
- 3.1.1.1 Growing pharmaceutical market
- 3.1.1.2 Rising demand for novel excipients
- 3.1.1.3 Patent cliffs driving the growth of excipients in the generics market
- 3.1.2 Market restraint analysis
- 3.1.2.1 Stringent rules by regulatory bodies
- 3.1.1 Market driver analysis
- 3.2 Penetration & Growth Prospect Mappingfor Products, 2021
- 3.3 Excipients Market - SWOT Analysis, By Factor (Political & Legal, Economic And Technological)
- 3.4 Industry Analysis - Porter's
Chapter 4. Excipients Market: Product Estimates & Trend Analysis
- 4.1 Global Excipients Market: Product Movement Analysis
- 4.2 Polymers
- 4.2.1 Global polymers market, 2018 - 2030 (USD Million, Tons)
- 4.2.2 Micro Crystalline Cellulose (MCC)
- 4.2.2.1 Global MCC market, 2018 - 2030 (USD Million, Tons)
- 4.2.3 Hydroxy Propyl Methyl Cellulose (HPMC)
- 4.2.3.1 Global HPMC market, 2018 - 2030 (USD Million, Tons)
- 4.2.4 Ethyl cellulose
- 4.2.4.1 Global ethyl cellulose market, 2018 - 2030 (USD Million, Tons)
- 4.2.5 Methyl cellulose
- 4.2.5.1 Global methyl cellulose market, 2018 - 2030 (USD Million, Tons)
- 4.2.6 Carboxy Methyl Cellulose (CMC)
- 4.2.6.1 Global CMC market, 2018 - 2030 (USD Million, Tons)
- 4.2.7 Croscarmellose sodium
- 4.2.7.1 Global croscarmellose sodium market, 2018 - 2030 (USD Million, Tons)
- 4.2.8 Povidone
- 4.2.8.1 Global povidone market, 2018 - 2030 (USD Million, Tons)
- 4.2.9 Pregelatinized starch
- 4.2.9.1 Global pregelatinized starch market, 2018 - 2030 (USD Million, Tons)
- 4.2.10 Sodium starch glycolate
- 4.2.10.1 Global sodium starch glycolate market, 2018 - 2030 (USD Million, Tons)
- 4.2.11 Polyethylene glycol
- 4.2.11.1 Global polyethylene glycol market, 2018 - 2030 (USD Million, Tons)
- 4.2.12 Acrylic polymers
- 4.2.12.1 Global acrylic polymers market, 2018 - 2030 (USD Million, Tons)
- 4.3 Alcohol
- 4.3.1 Global alcohol market, 2018 - 2030 (USD Million, Tons)
- 4.3.2 Glycerin
- 4.3.2.1 Global glycerin market, 2018 - 2030 (USD Million, Tons)
- 4.3.3 Propylene glycol
- 4.3.3.1 Global propylene glycol market, 2018 - 2030 (USD Million, Tons)
- 4.3.4 Sorbitol
- 4.3.4.1 Global sorbitol market, 2018 - 2030 (USD Million, Tons)
- 4.3.5 Mannitol
- 4.3.5.1 Global mannitol market, 2018 - 2030 (USD Million, Tons)
- 4.3.6 Others
- 4.3.6.1 Global other alcohol market, 2018 - 2030 (USD Million, Tons)
- 4.4 Minerals
- 4.4.1 Global minerals market, 2018 - 2030 (USD Million, Tons)
- 4.4.2 Calcium phosphate
- 4.4.2.1 Global calcium phosphate market, 2018 - 2030 (USD Million, Tons)
- 4.4.3 Calcium carbonate
- 4.4.3.1 Global calcium carbonate market, 2018 - 2030 (USD Million, Tons)
- 4.4.4 Clay
- 4.4.4.1 Global clay market, 2018 - 2030 (USD Million, Tons)
- 4.4.5 Silicon dioxide
- 4.4.5.1 Global silicon dioxide market, 2018 - 2030 (USD Million, Tons)
- 4.4.6 Titanium dioxide
- 4.4.6.1 Global titanium dioxide market, 2018 - 2030 (USD Million, Tons)
- 4.4.7 Others
- 4.4.7.1 Global other minerals market, 2018 - 2030 (USD Million, Tons)
- 4.5 Sugar
- 4.5.1 Global sugar market, 2018 - 2030 (USD Million, Tons)
- 4.5.2 Lactose
- 4.5.2.1 Global lactose market, 2018 - 2030 (USD Million, Tons)
- 4.5.3 Sucrose
- 4.5.3.1 Global sucrose market, 2018 - 2030 (USD Million, Tons)
- 4.5.4 Others
- 4.5.4.1 Global other excipients market, 2018 - 2030 (USD Million, Tons)
- 4.6 Gelatin
- 4.6.1 Global gelatin market, 2018 - 2030 (USD Million, Tons)
Chapter 5. Market Categorization: Regional Estimates & Trend Analysis, by Product
- 5.1 Global Excipients Market: Region Movement Analysis
- 5.2 North America
- 5.2.1 North America excipients market, 2018 - 2030 (USD Million, Tons)
- 5.2.2 U.S.
- 5.2.2.1 U.S. excipients market, 2018 - 2030 (USD Million, Tons)
- 5.2.3 Canada
- 5.2.3.1 Canada excipients market, 2018 - 2030 (USD Million, Tons)
- 5.3 Europe
- 5.3.1 Europe excipients market, 2018 - 2030 (USD Million, Tons)
- 5.3.2 Germany
- 5.3.2.1 Germany excipients market, 2018 - 2030 (USD Million, Tons)
- 5.4 Asia Pacific
- 5.4.1 Asia Pacific excipients market, 2018 - 2030 (USD Million, Tons)
- 5.4.2 Japan
- 5.4.2.1 Japan excipients market, 2018 - 2030 (USD Million, Tons)
- 5.5 Latin America
- 5.5.1 Latin America excipients market, 2018 - 2030 (USD Million, Tons)
- 5.5.2 Brazil
- 5.5.2.1 Brazil excipients market, 2018 - 2030 (USD Million, Tons)
- 5.6 Middle East & Africa (MEA)
- 5.6.1 Middle East & Africa excipients market, 2018 - 2030 (USD Million, Tons)
- 5.6.2 South Africa
- 5.6.2.1 South Africa excipients market, 2018 - 2030 (USD Million, Tons)
Chapter 6. Competitive Landscape
- 6.1 Strategy Framework
- 6.2 Market Participation Categorization
- 6.3 Company Profiles
- 6.3.1 Eastman Chemical Corporation
- 6.3.1.1 Company overview
- 6.3.1.2 Financial performance
- 6.3.1.3 Product benchmarking
- 6.3.2 P&G
- 6.3.2.1 Company overview
- 6.3.2.2 Financial performance
- 6.3.2.3 Product benchmarking
- 6.3.3 Avantor Performance Materials, LLC
- 6.3.3.1 Company overview
- 6.3.3.2 Financial performance
- 6.3.3.3 Product benchmarking
- 6.3.3.4 Strategic initiatives
- 6.3.4 Huntsman Corporation
- 6.3.4.1 Company overview
- 6.3.4.2 Financial performance
- 6.3.4.3 Product benchmarking
- 6.3.4.4 Strategic initiatives
- 6.3.5 BASF SE
- 6.3.5.1 Company overview
- 6.3.5.2 Financial performance
- 6.3.5.3 Product benchmarking
- 6.3.5.4 Strategic initiatives
- 6.3.6 Ashland Inc.
- 6.3.6.1 Company overview
- 6.3.6.2 Financial performance
- 6.3.6.3 Product benchmarking
- 6.3.6.4 Strategic initiatives
- 6.3.7 FMC Corporation
- 6.3.7.1 Company overview
- 6.3.7.2 Financial performance
- 6.3.7.3 Product benchmarking
- 6.3.7.4 Strategic initiatives
- 6.3.8 Roquette
- 6.3.8.1 Company overview
- 6.3.8.2 Financial performance
- 6.3.8.3 Product benchmarking
- 6.3.8.4 Strategic initiatives
- 6.3.9 Colorcon Inc.
- 6.3.9.1 Company overview
- 6.3.9.2 Financial performance
- 6.3.9.3 Product benchmarking
- 6.3.9.4 Strategic initiatives
- 6.3.10 Lubrizol Corporation
- 6.3.10.1 Company overview
- 6.3.10.2 Financial performance
- 6.3.10.3 Product benchmarking
- 6.3.10.4 Strategic initiatives
- 6.3.11 Valeant
- 6.3.11.1 Company overview
- 6.3.11.1.1 The Dow Chemical Company (Dow Pharma Solutions)
- 6.3.11.2 Financial performance
- 6.3.11.2.1 Financial performance
- 6.3.11.3 Product benchmarking
- 6.3.12 JRS PHARMA
- 6.3.12.1 Company overview
- 6.3.12.2 Financial performance
- 6.3.12.3 Product benchmarking
- 6.3.12.4 Strategic initiatives
- 6.3.13 Shin-Etsu Chemical Co., Ltd
- 6.3.13.1 Company overview
- 6.3.13.1.1 SE Pharma & Food Materials Distribution GmbH
- 6.3.13.2 Financial performance
- 6.3.13.3 Product benchmarking
- 6.3.13.4 Strategic initiatives
- 6.3.14 DFE pharma
- 6.3.14.1 Company overview
- 6.3.14.2 Financial performance
- 6.3.14.3 Product benchmarking
- 6.3.14.4 Strategic initiatives
- 6.3.15 FINAR LIMITED
- 6.3.15.1 Company overview
- 6.3.15.2 Financial performance
- 6.3.15.3 Product benchmarking
- 6.3.1 Eastman Chemical Corporation