|
|
市場調査レポート
商品コード
1678665
マイクロニードルドラッグデリバリーシステム市場規模、シェア、動向分析レポート:タイプ別、材料別、用途別、地域別、セグメント別予測、2025年~2030年Microneedle Drug Delivery Systems Market Size, Share & Trends Analysis Report By Type, By Material, By Application, By Region, And Segment Forecasts, 2025 - 2030 |
||||||
|
|||||||
カスタマイズ可能
|
|||||||


| マイクロニードルドラッグデリバリーシステム市場規模、シェア、動向分析レポート:タイプ別、材料別、用途別、地域別、セグメント別予測、2025年~2030年 |
|
出版日: 2025年02月13日
発行: Grand View Research
ページ情報: 英文 100 Pages
納期: 2~10営業日
|

全表示
- 概要
- 図表
- 目次
マイクロニードルドラッグデリバリーシステム市場の成長と動向
Grand View Research, Inc.の最新レポートによると、世界のマイクロニードルドラッグデリバリーシステム市場規模は、2025~2030年にかけてCAGR 7.7%を記録し、2030年までに94億6,000万米ドルに達すると推定されています。
従来の皮下注射に代わるより安全な方法への需要の高まりと、低侵襲で痛みのない薬剤投与に対する意識の高まりが、マイクロニードルドラッグデリバリーシステムの市場成長を後押しすると予想されます。さらに、糖尿病患者の増加も市場成長を押し上げると予想されています。例えば、2021年の世界保健機関(WHO)の推定によると、世界中で約4億6,300万人の成人が糖尿病を患っており、これは世界人口の9.3%に相当します。
マイクロニードルは、経口経路や経皮経路といった従来のドラッグデリバリー方法に比べていくつかの利点があります。マイクロニードルによるドラッグデリバリーは、特に水溶性の低い薬剤や浸透性の低い薬剤の場合、薬剤の吸収、バイオアベイラビリティ、有効性を改善できることが研究で示されています。例えば、「Journal of Controlled Release」に掲載された研究では、マイクロニードルを用いたインスリンの経皮投与は皮下注射よりも効果的であることが示されました。
COVID-19パンデミックはマイクロニードルによるドラッグデリバリーに大きな影響を与えました。パンデミックが市場に与えた大きな影響は、ワクチンデリバリーに対する需要の増加でした。マイクロニードルは、その使いやすさ、低コスト、強力な免疫反応を引き起こす可能性から、COVID-19ワクチンの送達方法として検討されてきました。パンデミックはマイクロニードルを用いたワクチン送達システムの開発を加速させ、複数の企業や学術機関がCOVID-19ワクチンパッチの開発に取り組んでいます。
しかし、パンデミックは世界のサプライチェーンも混乱させ、マイクロニードルベースのドラッグデリバリーシステムの生産と流通に影響を及ぼしています。一部のメーカーは原料や部品の入手で課題に直面し、供給不足と価格上昇を招いています。
マイクロニードルドラッグデリバリーシステム市場レポートハイライト
- タイプ別では、中空マイクロニードルセグメンテーションが2024年に最大の収益シェアを占めました。ワクチンやホルモン療法患者の使用に最適と考えられているからです。
- 溶解マイクロニードルタイプは、挿入後にマイクロニードルを取り外す必要がなく、1ステップで済むため、予測期間中に最も速いCAGRで成長する見込み。
- 材料別では、金属セグメントが2024年に最も高い収益シェアを占め、ステンレスとチタンが最も頻繁に使用される金属です。
- ドラッグデリバリー用途セグメントは、がん、糖尿病、心血管疾患などの慢性疾患の有病率の上昇により、2024年に34.3%の最大市場シェアを占めました。
- ワクチンデリバリーセグメントは、人々の間でワクチン接種に対する意識が高まっていることから、予測期間中に最も速いCAGRを経験すると予想されています。
- アジア太平洋は、中国とインドの新興経済圏に未開拓の機会が存在するため、予測期間中に最も速いCAGRで成長すると予測されています。
目次
第1章 調査手法と範囲
第2章 エグゼクティブサマリー
第3章 マイクロニードルドラッグデリバリーシステム市場の変数、動向、範囲
- 市場系統の展望
- 市場力学
- 市場促進要因分析
- 市場抑制要因分析
- ビジネス環境分析
- 産業分析-ポーターのファイブフォース分析
- PESTLE分析
第4章 マイクロニードルドラッグデリバリーシステム市場:タイプビジネス分析
- タイプ市場シェア、2024年と2030年
- タイプセグメントダッシュボード
- 市場規模と予測と動向分析、タイプ別、2018~2030年
- ホロー
- 固体
- コーティング
- 溶解
- その他
第5章 マイクロニードルドラッグデリバリーシステム市場:材料ビジネス分析
- 材料市場シェア、2024年と2030年
- 材料セグメントダッシュボード
- 市場規模と予測と動向分析、材料別、2018~2030年
- 金属
- シリコン
- ポリマー
- その他
第6章 マイクロニードルドラッグデリバリーシステム市場:用途ビジネス分析
- 用途市場シェア、2024年と2030年
- 用途セグメントダッシュボード
- 市場規模と予測と動向分析、用途別、2018~2030年
- ドラッグデリバリー
- ワクチンの配送
- 疼痛管理
- がん治療
- 皮膚科
- その他
第7章 マイクロニードルドラッグデリバリーシステム市場:地域別、推定・動向分析
- 地域別市場シェア分析、2024年と2030年
- 地域別市場ダッシュボード
- 市場規模、予測動向分析、2018~2030年
- 北米
- 国別、2018~2030年
- 米国
- カナダ
- メキシコ
- 欧州
- 国別、2018~2030年
- 英国
- ドイツ
- フランス
- イタリア
- スペイン
- ノルウェー
- デンマーク
- スウェーデン
- アジア太平洋
- 国別、2018~2030年
- 日本
- 中国
- インド
- 韓国
- オーストラリア
- タイ
- ラテンアメリカ
- 国別、2018~2030年
- ブラジル
- アルゼンチン
- 中東・アフリカ
- 国別、2018~2030年
- 南アフリカ
- サウジアラビア
- アラブ首長国連邦
- クウェート
第8章 競合情勢
- 参加者概要
- 企業の市況分析
- 企業分類
- 戦略マッピング
- 企業プロファイル/上場企業
- Raphas Co., Ltd.
- Novartis AG
- BD
- B. Braun SE
- NanoPass
- Terumo Corporation
- Smiths Group plc
- Cardinal Health
- 3M
List of Tables
- Table 1 List of secondary sources
- Table 2 List of abbreviations
- Table 3 Global microneedle drug delivery systems market, by region, 2018 - 2030 (USD Million)
- Table 4 Global microneedle drug delivery systems market, by type, 2018 - 2030 (USD Million)
- Table 5 Global microneedle drug delivery systems market, by material, 2018 - 2030 (USD Million)
- Table 6 Global microneedle drug delivery systems market, by application, 2018 - 2030 (USD Million)
- Table 7 North America microneedle drug delivery systems market, by country, 2018 - 2030 (USD Million)
- Table 8 North America microneedle drug delivery systems market, by type, 2018 - 2030 (USD Million)
- Table 9 North America microneedle drug delivery systems market, by material, 2018 - 2030 (USD Million)
- Table 10 North America microneedle drug delivery systems market, by application, 2018 - 2030 (USD Million)
- Table 11 U.S. microneedle drug delivery systems market, by type, 2018 - 2030 (USD Million)
- Table 12 U.S. microneedle drug delivery systems market, by material, 2018 - 2030 (USD Million)
- Table 13 U.S. Microneedle drug delivery systems market, by application, 2018 - 2030 (USD Million)
- Table 14 Canada microneedle drug delivery systems market, by type, 2018 - 2030 (USD Million)
- Table 15 Canada microneedle drug delivery systems market, by material, 2018 - 2030 (USD Million)
- Table 16 Canada microneedle drug delivery systems market, by application, 2018 - 2030 (USD Million)
- Table 17 Mexico microneedle drug delivery systems market, by type, 2018 - 2030 (USD Million)
- Table 18 Mexico microneedle drug delivery systems market, by material, 2018 - 2030 (USD Million)
- Table 19 Mexico microneedle drug delivery systems market, by application, 2018 - 2030 (USD Million)
- Table 20 Europe microneedle drug delivery systems market, by country, 2018 - 2030 (USD Million)
- Table 21 Europe microneedle drug delivery systems market, by type, 2018 - 2030 (USD Million)
- Table 22 Europe microneedle drug delivery systems market, by material, 2018 - 2030 (USD Million)
- Table 23 Europe microneedle drug delivery systems market, by application, 2018 - 2030 (USD Million)
- Table 24 UK microneedle drug delivery systems market, by type, 2018 - 2030 (USD Million)
- Table 25 UK microneedle drug delivery systems market, by material, 2018 - 2030 (USD Million)
- Table 26 UK Microneedle drug delivery systems market, by application, 2018 - 2030 (USD Million)
- Table 27 Germany microneedle drug delivery systems market, by type, 2018 - 2030 (USD Million)
- Table 28 Germany microneedle drug delivery systems market, by material, 2018 - 2030 (USD Million)
- Table 29 Germany microneedle drug delivery systems market, by application, 2018 - 2030 (USD Million)
- Table 30 France microneedle drug delivery systems market, by type, 2018 - 2030 (USD Million)
- Table 31 France microneedle drug delivery systems market, by material, 2018 - 2030 (USD Million)
- Table 32 France Microneedle drug delivery systems market, by application, 2018 - 2030 (USD Million)
- Table 33 Italy microneedle drug delivery systems market, by type, 2018 - 2030 (USD Million)
- Table 34 Italy microneedle drug delivery systems market, by material, 2018 - 2030 (USD Million)
- Table 35 Italy microneedle drug delivery systems market, by application, 2018 - 2030 (USD Million)
- Table 36 Spain microneedle drug delivery systems market, by type, 2018 - 2030 (USD Million)
- Table 37 Spain microneedle drug delivery systems market, by material, 2018 - 2030 (USD Million)
- Table 38 Spain microneedle drug delivery systems market, by application, 2018 - 2030 (USD Million)
- Table 39 Norway microneedle drug delivery systems market, by type, 2018 - 2030 (USD Million)
- Table 40 Norway microneedle drug delivery systems market, by material, 2018 - 2030 (USD Million)
- Table 41 Norway Microneedle drug delivery systems market, by application, 2018 - 2030 (USD Million)
- Table 42 Denmark microneedle drug delivery systems market, by type, 2018 - 2030 (USD Million)
- Table 43 Denmark microneedle drug delivery systems market, by material, 2018 - 2030 (USD Million)
- Table 44 Denmark microneedle drug delivery systems market, by application, 2018 - 2030 (USD Million)
- Table 45 Sweden microneedle drug delivery systems market, by type, 2018 - 2030 (USD Million)
- Table 46 Sweden microneedle drug delivery systems market, by material, 2018 - 2030 (USD Million)
- Table 47 Sweden microneedle drug delivery systems market, by application, 2018 - 2030 (USD Million)
- Table 48 Asia Pacific microneedle drug delivery systems market, by country, 2018 - 2030 (USD Million)
- Table 49 Asia Pacific microneedle drug delivery systems market, by type, 2018 - 2030 (USD Million)
- Table 50 Asia Pacific microneedle drug delivery systems market, by material, 2018 - 2030 (USD Million)
- Table 51 Asia Pacific microneedle drug delivery systems market, by application, 2018 - 2030 (USD Million)
- Table 52 Japan microneedle drug delivery systems market, by type, 2018 - 2030 (USD Million)
- Table 53 Japan microneedle drug delivery systems market, by material, 2018 - 2030 (USD Million)
- Table 54 Japan microneedle drug delivery systems market, by application, 2018 - 2030 (USD Million)
- Table 55 China microneedle drug delivery systems market, by type, 2018 - 2030 (USD Million)
- Table 56 China microneedle drug delivery systems market, by material, 2018 - 2030 (USD Million)
- Table 57 China microneedle drug delivery systems market, by application, 2018 - 2030 (USD Million)
- Table 58 India microneedle drug delivery systems market, by type, 2018 - 2030 (USD Million)
- Table 59 India microneedle drug delivery systems market, by material, 2018 - 2030 (USD Million)
- Table 60 India microneedle drug delivery systems market, by application, 2018 - 2030 (USD Million)
- Table 61 Australia microneedle drug delivery systems market, by type, 2018 - 2030 (USD Million)
- Table 62 Australia microneedle drug delivery systems market, by material, 2018 - 2030 (USD Million)
- Table 63 Australia microneedle drug delivery systems market, by application, 2018 - 2030 (USD Million)
- Table 64 South Korea microneedle drug delivery systems market, by type, 2018 - 2030 (USD Million)
- Table 65 South Korea microneedle drug delivery systems market, by material, 2018 - 2030 (USD Million)
- Table 66 South Korea microneedle drug delivery systems market, by application, 2018 - 2030 (USD Million)
- Table 67 Thailand microneedle drug delivery systems market, by type, 2018 - 2030 (USD Million)
- Table 68 Thailand microneedle drug delivery systems market, by material, 2018 - 2030 (USD Million)
- Table 69 Thailand microneedle drug delivery systems market, by application, 2018 - 2030 (USD Million)
- Table 70 Latin America microneedle drug delivery systems market, by country, 2018 - 2030 (USD Million)
- Table 71 Latin America microneedle drug delivery systems market, by type, 2018 - 2030 (USD Million)
- Table 72 Latin America microneedle drug delivery systems market, by material, 2018 - 2030 (USD Million)
- Table 73 Latin America microneedle drug delivery systems market, by application, 2018 - 2030 (USD Million)
- Table 74 Brazil microneedle drug delivery systems market, by type, 2018 - 2030 (USD Million)
- Table 75 Brazil microneedle drug delivery systems market, by material, 2018 - 2030 (USD Million)
- Table 76 Brazil microneedle drug delivery systems market, by application, 2018 - 2030 (USD Million)
- Table 77 Argentina microneedle drug delivery systems market, by type, 2018 - 2030 (USD Million)
- Table 78 Argentina microneedle drug delivery systems market, by material, 2018 - 2030 (USD Million)
- Table 79 Argentina microneedle drug delivery systems market, by application, 2018 - 2030 (USD Million)
- Table 80 Middle East & Africa Microneedle drug delivery systems market, by country, 2018 - 2030 (USD Million)
- Table 81 Middle East & Africa microneedle drug delivery systems market, by type, 2018 - 2030 (USD Million)
- Table 82 Middle East & Africa microneedle drug delivery systems market, by material, 2018 - 2030 (USD Million)
- Table 83 Middle East & Africa microneedle drug delivery systems market, by application, 2018 - 2030 (USD Million)
- Table 84 South Africa microneedle drug delivery systems market, by type, 2018 - 2030 (USD Million)
- Table 85 South Africa microneedle drug delivery systems market, by material, 2018 - 2030 (USD Million)
- Table 86 South Africa microneedle drug delivery systems market, by application, 2018 - 2030 (USD Million)
- Table 87 Saudi Arabia microneedle drug delivery systems market, by type, 2018 - 2030 (USD Million)
- Table 88 Saudi Arabia microneedle drug delivery systems market, by material, 2018 - 2030 (USD Million)
- Table 89 Saudi Arabia microneedle drug delivery systems market, by application, 2018 - 2030 (USD Million)
- Table 90 UAE microneedle drug delivery systems market, by type, 2018 - 2030 (USD Million)
- Table 91 UAE microneedle drug delivery systems market, by material, 2018 - 2030 (USD Million)
- Table 92 UAE microneedle drug delivery systems market, by application, 2018 - 2030 (USD Million)
- Table 93 Kuwait microneedle drug delivery systems market, by type, 2018 - 2030 (USD Million)
- Table 94 Kuwait microneedle drug delivery systems market, by material, 2018 - 2030 (USD Million)
- Table 95 Kuwait microneedle drug delivery systems market, by application, 2018 - 2030 (USD Million)
List of Figures
- Fig. 1 Microneedle drug delivery systems market segmentation
- Fig. 2 Market research process
- Fig. 3 Data triangulation techniques
- Fig. 4 Primary research pattern
- Fig. 5 Market research approaches
- Fig. 6 Value-chain-based sizing & forecasting
- Fig. 7 Market formulation & validation
- Fig. 8 Market snapshot
- Fig. 9 Type and material outlook (USD Million)
- Fig. 10 Application outlook (USD Million)
- Fig. 11 Competitive landscape
- Fig. 12 Microneedle drug delivery systems market dynamics
- Fig. 13 Microneedle drug delivery systems market: Porter's five forces analysis
- Fig. 14 Microneedle drug delivery systems market: PESTLE analysis
- Fig. 15 Microneedle drug delivery systems market: Type segment dashboard
- Fig. 16 Microneedle drug delivery systems market: Type market share analysis, 2024 & 2030
- Fig. 17 Hollow market, 2018 - 2030 (USD Million)
- Fig. 18 Solid market, 2018 - 2030 (USD Million)
- Fig. 19 Coated market, 2018 - 2030 (USD Million)
- Fig. 20 Dissolving market, 2018 - 2030 (USD Million)
- Fig. 21 Others market, 2018 - 2030 (USD Million)
- Fig. 22 Microneedle drug delivery systems market: Material segment dashboard
- Fig. 23 Microneedle drug delivery systems market: Material market share analysis, 2024 & 2030
- Fig. 24 Metal market, 2018 - 2030 (USD Million)
- Fig. 25 Silicon market, 2018 - 2030 (USD Million)
- Fig. 26 Polymer market, 2018 - 2030 (USD Million)
- Fig. 27 Others market, 2018 - 2030 (USD Million)
- Fig. 28 Microneedle drug delivery systems market: Application segment dashboard
- Fig. 29 Microneedle drug delivery systems market: Application market share analysis, 2024 & 2030
- Fig. 30 Drug delivery market, 2018 - 2030 (USD Million)
- Fig. 31 Vaccine delivery market, 2018 - 2030 (USD Million)
- Fig. 32 Pain management market, 2018 - 2030 (USD Million)
- Fig. 33 Cancer therapy market, 2018 - 2030 (USD Million)
- Fig. 34 Dermatology market, 2018 - 2030 (USD Million)
- Fig. 35 Others market, 2018 - 2030 (USD Million)
- Fig. 36 Microneedle drug delivery systems market revenue, by region
- Fig. 37 Regional marketplace: Key takeaways
- Fig. 38 Regional marketplace: Key takeaways
- Fig. 39 North America microneedle drug delivery systems market, 2018 - 2030 (USD Million)
- Fig. 40 U.S. country dynamics
- Fig. 41 U.S. microneedle drug delivery systems market, 2018 - 2030 (USD Million)
- Fig. 42 Canada country dynamics
- Fig. 43 Canada microneedle drug delivery systems market, 2018 - 2030 (USD Million)
- Fig. 44 Mexico country dynamics
- Fig. 45 Mexico microneedle drug delivery systems market, 2018 - 2030 (USD Million)
- Fig. 46 Europe microneedle drug delivery systems market, 2018 - 2030 (USD Million)
- Fig. 47 UK country dynamics
- Fig. 48 UK microneedle drug delivery systems market, 2018 - 2030 (USD Million)
- Fig. 49 Germany country dynamics
- Fig. 50 Germany microneedle drug delivery systems market, 2018 - 2030 (USD Million)
- Fig. 51 France country dynamics
- Fig. 52 France microneedle drug delivery systems market, 2018 - 2030 (USD Million)
- Fig. 53 Italy country dynamics
- Fig. 54 Italy microneedle drug delivery systems market, 2018 - 2030 (USD Million)
- Fig. 55 Spain country dynamics
- Fig. 56 Spain microneedle drug delivery systems market, 2018 - 2030 (USD Million)
- Fig. 57 Norway country dynamics
- Fig. 58 Norway microneedle drug delivery systems market, 2018 - 2030 (USD Million)
- Fig. 59 Sweden country dynamics
- Fig. 60 Sweden microneedle drug delivery systems market, 2018 - 2030 (USD Million)
- Fig. 61 Denmark country dynamics
- Fig. 62 Denmark microneedle drug delivery systems market, 2018 - 2030 (USD Million)
- Fig. 63 Asia Pacific microneedle drug delivery systems market, 2018 - 2030 (USD Million)
- Fig. 64 Japan country dynamics
- Fig. 65 Japan microneedle drug delivery systems market, 2018 - 2030 (USD Million)
- Fig. 66 China country dynamics
- Fig. 67 China microneedle drug delivery systems market, 2018 - 2030 (USD Million)
- Fig. 68 India country dynamics
- Fig. 69 India microneedle drug delivery systems market, 2018 - 2030 (USD Million)
- Fig. 70 Australia country dynamics
- Fig. 71 Australia microneedle drug delivery systems market, 2018 - 2030 (USD Million)
- Fig. 72 South Korea country dynamics
- Fig. 73 South Korea microneedle drug delivery systems market, 2018 - 2030 (USD Million)
- Fig. 74 Thailand country dynamics
- Fig. 75 Thailand microneedle drug delivery systems market, 2018 - 2030 (USD Million)
- Fig. 76 Latin America microneedle drug delivery systems market, 2018 - 2030 (USD Million)
- Fig. 77 Brazil country dynamics
- Fig. 78 Brazil microneedle drug delivery systems market, 2018 - 2030 (USD Million)
- Fig. 79 Argentina country dynamics
- Fig. 80 Argentina microneedle drug delivery systems market, 2018 - 2030 (USD Million)
- Fig. 81 MEA microneedle drug delivery systems market, 2018 - 2030 (USD Million)
- Fig. 82 South Africa country dynamics
- Fig. 83 South Africa microneedle drug delivery systems market, 2018 - 2030 (USD Million)
- Fig. 84 Saudi Arabia country dynamics
- Fig. 85 Saudi Arabia microneedle drug delivery systems market, 2018 - 2030 (USD Million)
- Fig. 86 UAE country dynamics
- Fig. 87 UAE microneedle drug delivery systems market, 2018 - 2030 (USD Million)
- Fig. 88 Kuwait country dynamics
- Fig. 89 Kuwait microneedle drug delivery systems market, 2018 - 2030 (USD Million)
- Fig. 90 Company categorization
- Fig. 91 Company market position analysis
- Fig. 92 Strategic framework
Microneedle Drug Delivery Systems Market Growth & Trends:
The global microneedle drug delivery systems market size is estimated to reach USD 9.46 billion by 2030, registering a CAGR of 7.7% from 2025 to 2030, according to a new report by Grand View Research, Inc. Growing demand for safer alternatives to conventional hypodermic injection and increasing awareness about minimally invasive and pain-free administration of drugs is expected to boost the market growth for microneedle drug delivery systems. Furthermore, increasing cases of diabetes are also expected to boost the market growth. For instance, as per the estimates of the World Health Organization (WHO) in 2021, approximately 463 million adults were living with diabetes, worldwide, representing 9.3% of the global population.
Microneedles offer several advantages over traditional drug delivery methods, such as oral or transdermal routes. Studies have shown that drug delivery by microneedles can improve drug absorption, bioavailability and efficacy, especially for drugs with poor water solubility or low permeability. For instance, a study published in "Journal of Controlled Release" showed that transdermal delivery of insulin using microneedles was more effective than subcutaneous injection.
The COVID-19 pandemic had a significant impact on drug delivery by microneedles. The major impact of the pandemic on the market was the increased demand for vaccine delivery. Microneedles have been explored as a potential delivery method for the COVID-19 vaccines due to their ease of use, low cost, and potential to induce a strong immune response. The pandemic has accelerated development of the microneedle-based vaccine delivery systems, with several companies and academic institutions working on COVID-19 vaccine patches.
However, the pandemic has also disrupted global supply chains, which has affected the production and distribution of microneedle-based drug delivery systems. Some manufacturers have faced challenges in obtaining raw materials and components, which has resulted in supply shortages and increased prices.
Microneedle Drug Delivery Systems Market Report Highlights:
- By type, the hollow microneedle segment accounted for the largest revenue share in 2024, since they are considered ideal for the use of vaccine and hormonal therapy patients
- Dissolving microneedle type segment is expected to grow at the fastest CAGR during the forecast period, as it only requires one step, the microneedle needs not be removed after insertion
- Based on material, the metal segment accounted for the highest revenue share in 2024, stainless steel and titanium are the most frequently employed metals
- The drug delivery application segment held the largest market share of 34.3% in 2024, due to the rising prevalence of chronic diseases such as cancer, diabetes, and cardiovascular conditions
- The vaccine delivery segment is expected to experience the fastest CAGR during the forecast period, due to the increased awareness of vaccination among populations
- Asia Pacific is anticipated to grow at the fastest CAGR during the forecast period, due to the presence of untapped opportunities in the emerging economies of China and India.
Table of Contents
Chapter 1. Methodology and Scope
- 1.1. Market Segmentation & Scope
- 1.2. Segment Definitions
- 1.2.1. Type
- 1.2.2. Material
- 1.2.3. Application
- 1.3. Estimates and Forecast Timeline
- 1.4. Research Methodology
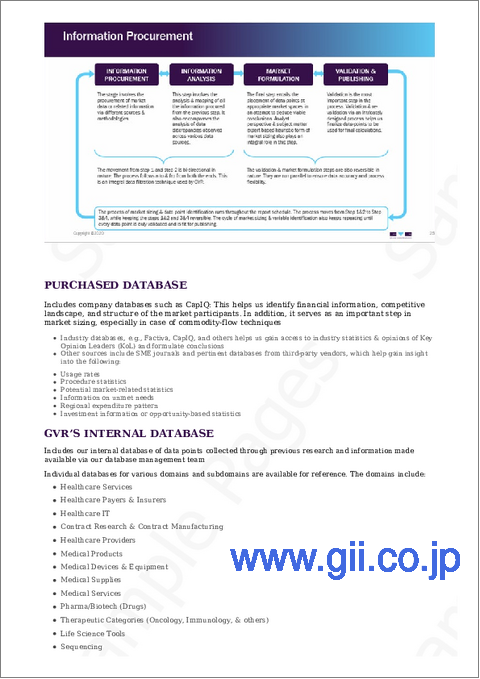
- 1.5. Information Procurement
- 1.5.1. Purchased Database
- 1.5.2. GVR's Internal Database
- 1.5.3. Secondary Sources
- 1.5.4. Primary Research
- 1.6. Information Analysis
- 1.6.1. Data Analysis Models
- 1.7. Market Formulation & Data Visualization
- 1.8. Model Details
- 1.8.1. Commodity Flow Analysis
- 1.9. List of Secondary Sources
- 1.10. Objectives
Chapter 2. Executive Summary
- 2.1. Market Snapshot
- 2.2. Segment Snapshot
- 2.3. Competitive Landscape Snapshot
Chapter 3. Microneedle Drug Delivery Systems Market Variables, Trends, & Scope
- 3.1. Market Lineage Outlook
- 3.2. Market Dynamics
- 3.2.1. Market Driver Analysis
- 3.2.2. Market Restraint Analysis
- 3.3. Business Environment Analysis
- 3.3.1. Industry Analysis - Porter's Five Forces Analysis
- 3.3.1.1. Supplier Power
- 3.3.1.2. Buyer Power
- 3.3.1.3. Substitution Threat
- 3.3.1.4. Threat of New Entrants
- 3.3.1.5. Competitive Rivalry
- 3.3.2. PESTLE Analysis
- 3.3.1. Industry Analysis - Porter's Five Forces Analysis
Chapter 4. Microneedle Drug Delivery Systems Market: Type Business Analysis
- 4.1. Type Market Share, 2024 & 2030
- 4.2. Type Segment Dashboard
- 4.3. Market Size & Forecasts and Trend Analysis, by Type, 2018 to 2030 (USD Million)
- 4.4. Hollow
- 4.4.1. Hollow Market, 2018 - 2030 (USD Million)
- 4.5. Solid
- 4.5.1. Solid Market, 2018 - 2030 (USD Million)
- 4.6. Coated
- 4.6.1. Coated Market, 2018 - 2030 (USD Million)
- 4.7. Dissolving
- 4.7.1. Dissolving Market, 2018 - 2030 (USD Million)
- 4.8. Others
- 4.8.1. Others Market, 2018 - 2030 (USD Million)
Chapter 5. Microneedle Drug Delivery Systems Market: Material Business Analysis
- 5.1. Material Market Share, 2024 & 2030
- 5.2. Material Segment Dashboard
- 5.3. Market Size & Forecasts and Trend Analysis, by Material, 2018 to 2030 (USD Million)
- 5.4. Metal
- 5.4.1. Metal Market, 2018 - 2030 (USD Million)
- 5.5. Silicon
- 5.5.1. Silicon Market, 2018 - 2030 (USD Million)
- 5.6. Polymer
- 5.6.1. Polymer Market, 2018 - 2030 (USD Million)
- 5.7. Others
- 5.7.1. Others Market, 2018 - 2030 (USD Million)
Chapter 6. Microneedle Drug Delivery Systems Market: Application Business Analysis
- 6.1. Application Market Share, 2024 & 2030
- 6.2. Application Segment Dashboard
- 6.3. Market Size & Forecasts and Trend Analysis, by Application, 2018 to 2030 (USD Million)
- 6.4. Drug Delivery
- 6.4.1. Drug Delivery Market, 2018 - 2030 (USD Million)
- 6.5. Vaccine Delivery
- 6.5.1. Vaccine Delivery Market, 2018 - 2030 (USD Million)
- 6.6. Pain Management
- 6.6.1. Pain Management Market, 2018 - 2030 (USD Million)
- 6.7. Cancer Therapy
- 6.7.1. Cancer Therapy Market, 2018 - 2030 (USD Million)
- 6.8. Dermatology
- 6.8.1. Dermatology Market, 2018 - 2030 (USD Million)
- 6.9. Others
- 6.9.1. Others Market, 2018 - 2030 (USD Million)
Chapter 7. Microneedle Drug Delivery Systems Market: Regional Estimates & Trend Analysis
- 7.1. Regional Market Share Analysis, 2024 & 2030
- 7.2. Regional Market Dashboard
- 7.3. Market Size, & Forecasts Trend Analysis, 2018 to 2030:
- 7.4. North America
- 7.4.1. North America Microneedle Drug Delivery Systems Market Estimates And Forecasts, By Country, 2018 - 2030 (USD Million)
- 7.4.2. U.S.
- 7.4.2.1. Key Country Dynamics
- 7.4.2.2. Regulatory Framework
- 7.4.2.3. Competitive Insights
- 7.4.2.4. U.S. Microneedle Drug Delivery Systems Market Estimates And Forecasts, 2018 - 2030 (USD Million)
- 7.4.3. Canada
- 7.4.3.1. Key Country Dynamics
- 7.4.3.2. Regulatory Framework
- 7.4.3.3. Competitive Insights
- 7.4.3.4. Canada Microneedle Drug Delivery Systems Market Estimates And Forecasts, 2018 - 2030 (USD Million)
- 7.4.4. Mexico
- 7.4.4.1. Key Country Dynamics
- 7.4.4.2. Regulatory Framework
- 7.4.4.3. Competitive Insights
- 7.4.4.4. Mexico Microneedle Drug Delivery Systems Market Estimates And Forecasts, 2018 - 2030 (USD Million)
- 7.5. Europe
- 7.5.1. Europe Microneedle Drug Delivery Systems Market Estimates And Forecasts, By Country, 2018 - 2030 (USD Million)
- 7.5.2. UK
- 7.5.2.1. Key Country Dynamics
- 7.5.2.2. Regulatory Framework
- 7.5.2.3. Competitive Insights
- 7.5.2.4. UK Microneedle Drug Delivery Systems Market Estimates And Forecasts, 2018 - 2030 (USD Million)
- 7.5.3. Germany
- 7.5.3.1. Key Country Dynamics
- 7.5.3.2. Regulatory Framework
- 7.5.3.3. Competitive Insights
- 7.5.3.4. Germany Microneedle Drug Delivery Systems Market Estimates And Forecasts, 2018 - 2030 (USD Million)
- 7.5.4. France
- 7.5.4.1. Key Country Dynamics
- 7.5.4.2. Regulatory Framework
- 7.5.4.3. Competitive Insights
- 7.5.4.4. France Microneedle Drug Delivery Systems Market Estimates And Forecasts, 2018 - 2030 (USD Million)
- 7.5.5. Italy
- 7.5.5.1. Key Country Dynamics
- 7.5.5.2. Regulatory Framework
- 7.5.5.3. Competitive Insights
- 7.5.5.4. Italy Microneedle Drug Delivery Systems Market Estimates And Forecasts, 2018 - 2030 (USD Million)
- 7.5.6. Spain
- 7.5.6.1. Key Country Dynamics
- 7.5.6.2. Regulatory Framework
- 7.5.6.3. Competitive Insights
- 7.5.6.4. Spain Microneedle Drug Delivery Systems Market Estimates And Forecasts, 2018 - 2030 (USD Million)
- 7.5.7. Norway
- 7.5.7.1. Key Country Dynamics
- 7.5.7.2. Regulatory Framework
- 7.5.7.3. Competitive Insights
- 7.5.7.4. Norway Microneedle Drug Delivery Systems Market Estimates And Forecasts, 2018 - 2030 (USD Million)
- 7.5.8. Denmark
- 7.5.8.1. Key Country Dynamics
- 7.5.8.2. Regulatory Framework
- 7.5.8.3. Competitive Insights
- 7.5.8.4. Denmark Microneedle Drug Delivery Systems Market Estimates And Forecasts, 2018 - 2030 (USD Million)
- 7.5.9. Sweden
- 7.5.9.1. Key Country Dynamics
- 7.5.9.2. Regulatory Framework
- 7.5.9.3. Competitive Insights
- 7.5.9.4. Sweden Microneedle Drug Delivery Systems Market Estimates And Forecasts, 2018 - 2030 (USD Million)
- 7.6. Asia Pacific
- 7.6.1. Asia Pacific Microneedle Drug Delivery Systems Market Estimates And Forecasts, By Country, 2018 - 2030 (USD Million)
- 7.6.2. Japan
- 7.6.2.1. Key Country Dynamics
- 7.6.2.2. Regulatory Framework
- 7.6.2.3. Competitive Insights
- 7.6.2.4. Japan Microneedle Drug Delivery Systems Market Estimates And Forecasts, 2018 - 2030 (USD Million)
- 7.6.3. China
- 7.6.3.1. Key Country Dynamics
- 7.6.3.2. Regulatory Framework
- 7.6.3.3. Competitive Insights
- 7.6.3.4. China Microneedle Drug Delivery Systems Market Estimates And Forecasts, 2018 - 2030 (USD Million)
- 7.6.4. India
- 7.6.4.1. Key Country Dynamics
- 7.6.4.2. Regulatory Framework
- 7.6.4.3. Competitive Insights
- 7.6.4.4. India Microneedle Drug Delivery Systems Market Estimates And Forecasts, 2018 - 2030 (USD Million)
- 7.6.5. South Korea
- 7.6.5.1. Key Country Dynamics
- 7.6.5.2. Regulatory Framework
- 7.6.5.3. Competitive Insights
- 7.6.5.4. South Korea Microneedle Drug Delivery Systems Market Estimates And Forecasts, 2018 - 2030 (USD Million)
- 7.6.6. Australia
- 7.6.6.1. Key Country Dynamics
- 7.6.6.2. Regulatory Framework
- 7.6.6.3. Competitive Insights
- 7.6.6.4. Australia Microneedle Drug Delivery Systems Market Estimates And Forecasts, 2018 - 2030 (USD Million)
- 7.6.7. Thailand
- 7.6.7.1. Key Country Dynamics
- 7.6.7.2. Regulatory Framework
- 7.6.7.3. Competitive Insights
- 7.6.7.4. Thailand Microneedle Drug Delivery Systems Market Estimates And Forecasts, 2018 - 2030 (USD Million)
- 7.7. Latin America
- 7.7.1. Latin America Microneedle Drug Delivery Systems Market Estimates And Forecasts, By Country, 2018 - 2030 (USD Million)
- 7.7.2. Brazil
- 7.7.2.1. Key Country Dynamics
- 7.7.2.2. Regulatory Framework
- 7.7.2.3. Competitive Insights
- 7.7.2.4. Brazil Microneedle Drug Delivery Systems Market Estimates And Forecasts, 2018 - 2030 (USD Million)
- 7.7.3. Argentina
- 7.7.3.1. Key Country Dynamics
- 7.7.3.2. Regulatory Framework
- 7.7.3.3. Competitive Insights
- 7.7.3.4. Argentina Microneedle Drug Delivery Systems Market Estimates And Forecasts, 2018 - 2030 (USD Million)
- 7.8. MEA
- 7.8.1. MEA Microneedle Drug Delivery Systems Market Estimates And Forecasts, By Country, 2018 - 2030 (USD Million)
- 7.8.2. South Africa
- 7.8.2.1. Key Country Dynamics
- 7.8.2.2. Regulatory Framework
- 7.8.2.3. Competitive Insights
- 7.8.2.4. South Africa Microneedle Drug Delivery Systems Market Estimates And Forecasts, 2018 - 2030 (USD Million)
- 7.8.3. Saudi Arabia
- 7.8.3.1. Key Country Dynamics
- 7.8.3.2. Regulatory Framework
- 7.8.3.3. Competitive Insights
- 7.8.3.4. Saudi Arabia Microneedle Drug Delivery Systems Market Estimates And Forecasts, 2018 - 2030 (USD Million)
- 7.8.4. UAE
- 7.8.4.1. Key Country Dynamics
- 7.8.4.2. Regulatory Framework
- 7.8.4.3. Competitive Insights
- 7.8.4.4. UAE Microneedle Drug Delivery Systems Market Estimates And Forecasts, 2018 - 2030 (USD Million)
- 7.8.5. Kuwait
- 7.8.5.1. Key Country Dynamics
- 7.8.5.2. Regulatory Framework
- 7.8.5.3. Competitive Insights
- 7.8.5.4. Kuwait Microneedle Drug Delivery Systems Market Estimates And Forecasts, 2018 - 2030 (USD Million)
Chapter 8. Competitive Landscape
- 8.1. Participant Overview
- 8.2. Company Market Position Analysis
- 8.3. Company Categorization
- 8.4. Strategy Mapping
- 8.5. Company Profiles/Listing
- 8.5.1. Raphas Co., Ltd.
- 8.5.1.1. Overview
- 8.5.1.2. Financial Performance
- 8.5.1.3. Product Benchmarking
- 8.5.1.4. Strategic Initiatives
- 8.5.2. Novartis AG
- 8.5.2.1. Overview
- 8.5.2.2. Financial Performance
- 8.5.2.3. Product Benchmarking
- 8.5.2.4. Strategic Initiatives
- 8.5.3. BD
- 8.5.3.1. Overview
- 8.5.3.2. Financial Performance
- 8.5.3.3. Product Benchmarking
- 8.5.3.4. Strategic Initiatives
- 8.5.4. B. Braun SE
- 8.5.4.1. Overview
- 8.5.4.2. Financial Performance
- 8.5.4.3. Product Benchmarking
- 8.5.4.4. Strategic Initiatives
- 8.5.5. NanoPass
- 8.5.5.1. Overview
- 8.5.5.2. Financial Performance
- 8.5.5.3. Product Benchmarking
- 8.5.5.4. Strategic Initiatives
- 8.5.6. Terumo Corporation
- 8.5.6.1. Overview
- 8.5.6.2. Financial Performance
- 8.5.6.3. Product Benchmarking
- 8.5.6.4. Strategic Initiatives
- 8.5.7. Smiths Group plc
- 8.5.7.1. Overview
- 8.5.7.2. Financial Performance
- 8.5.7.3. Product Benchmarking
- 8.5.7.4. Strategic Initiatives
- 8.5.8. Cardinal Health
- 8.5.8.1. Overview
- 8.5.8.2. Financial Performance
- 8.5.8.3. Product Benchmarking
- 8.5.8.4. Strategic Initiatives
- 8.5.9. 3M
- 8.5.9.1. Overview
- 8.5.9.2. Financial Performance
- 8.5.9.3. Product Benchmarking
- 8.5.9.4. Strategic Initiatives
- 8.5.1. Raphas Co., Ltd.

