|
|
市場調査レポート
商品コード
1321421
獣医サービスの市場規模、シェア、動向分析レポート:サービスタイプ別、動物タイプ別、地域別、セグメント別予測、2023年~2030年Veterinary Services Market Size, Share & Trends Analysis Report By Service Type (Non-medical, Medical), By Animal Type (Companion, Production), By Region, And Segment Forecasts, 2023 - 2030q |
||||||
|
|
|||||||
カスタマイズ可能
|
|||||||


| 獣医サービスの市場規模、シェア、動向分析レポート:サービスタイプ別、動物タイプ別、地域別、セグメント別予測、2023年~2030年 |
|
出版日: 2023年07月21日
発行: Grand View Research
ページ情報: 英文 150 Pages
納期: 2~10営業日
|

- 全表示
- 概要
- 図表
- 目次
獣医サービス市場の成長と動向
Grand View Research, Inc.の新しいレポートによると、世界の獣医サービス市場規模は2023年から2023年の間に7.45%のCAGRで推移し、2030年までに2,127億3,000万米ドルに達すると予測されています。
市場成長を促進する主な要因には、動物福祉活動の増加、食糧安全保障を強化するニーズの高まり、ペット数の増加、動物の健康とタイムリーな診断・治療に関する意識の高まり、動物ヘルスケアサービスへの支出増加などがあります。例えば、米国ペット用品協会(APPA)によると、米国のペット産業全体の支出は2022年に1,368億米ドルと推定されました。
これは、2021年に推定された1,236億米ドルを著しく上回っています。COVID-19の発生は、世界市場にさまざまな影響を与えました。2020年には、移動制限、全国的な封鎖、動物病院やその他の非医療動物ケアセンターにおける入院率の低下により、市場は成長率の低下を目の当たりにしました。しかし、COVID-19のロックダウンは、人々の社会的孤立と心理的な利点のために、世界的に大幅にペットの養子縁組率を増加させたため、市場はすぐに翌年回復しました。
例えば、2021年5月にFrontiers Media S.A.に掲載された記事によると、英国ではペットの養子縁組率がピークに達し、パンデミックの間にシェルターが空になっています。さらに、コロナウイルスの大流行により、動物から動物へ、動物から人への疾病感染リスクに対する懸念が高まり、その結果、家畜動物の予防ケアと診断に関する政府の対策が強化されました。WHOは、人と動物・生態系の接点における健康上の脅威に対処するため、さまざまな分野横断的活動に取り組んでいます。
米国獣医師会(AVMA)は2021年11月、2016年から2020年にかけてコンパニオンアニマルの人口が顕著に増加したと報告しました。また、米国ペット用品協会(American Pet Products Association)が発表した2023年~2024年の調査報告書によると、米国では犬を飼っている世帯は6,510万世帯、猫を飼っている世帯は4,650万世帯と推定されています。FEDIAFの2022年報告書では、2021年時点でこの地域の猫の飼育数は1億1,360万匹、犬の飼育数は9,290万匹と示唆されています。したがって、ペット数の増加と犬猫の飼育が市場成長を促進する主要因の一つとなっています。
獣医サービス市場レポートハイライト
- 2022年には、生産動物セグメントが最大の収益シェアを占め、市場を独占しました。このセグメントは、動物性タンパク質の需要増加や持続可能な農業への注目の高まりなどの要因によって、今後数年間も成長を続けると予測されます。
- サービスタイプによって、市場は医療サービスと非医療サービスに二分されます。人畜共通感染症の蔓延が拡大し、発生を抑制するために重要な対策が講じられていることに加え、発展途上国における獣医医療サービスへのアクセスが増加していることから、2022年には医療サービス分野が最大の収益シェアを占めて市場を独占しました。
- 北米は、2022年に35%以上の最高収益シェアを占めました。米国とカナダにおける獣医学的サービスの全体的な改善に向けて傾斜している様々な政府の動物福祉団体によって実施された明確な措置は、この大幅な成長の主な要因です。
- 市場は競合が激しく、大小多数の獣医サービスプロバイダーが存在するため、大きく断片化されています。
目次
第1章 調査手法と範囲
- 市場セグメンテーションと範囲
- 調査手法
- 情報またはデータ分析
- 一般的な調査手法
- 調査範囲と前提条件
- 市場の形成と検証
- モデル詳細
- 二次情報のリスト
第2章 エグゼクティブサマリー
第3章 市場変数、動向、および範囲
- 市場系統の見通し
- 親市場の見通し
- 関連/付随市場の見通し
- 市場力学
- 市場促進要因の分析
- 市場抑制要因分析
- 市場機会分析
- 市場課題の分析
- 業界分析
- ポーター
- PESTLE
- 価格分析
- 顧客視点分析
- 人口統計に基づく米国のペット所有者のプロファイル、2022年
- COVID-19感染症の影響分析
第4章 獣医サービス市場:動物タイプの推定・動向分析
- セグメントダッシュボード
- 獣医サービス市場:動物タイプの変動分析、2022年および2030年
- コンパニオン動物
- コンパニオン動物市場収益推計と予測、2018~2030年
- 犬
- 猫
- 馬
- その他
- 生産動物
- 生産動物市場収益推計と予測、2018~2030年
- 牛
- 家禽
- 豚
- その他
第5章 獣医サービス市場:サービスタイプの推定・動向分析
- セグメントダッシュボード
- 獣医サービス市場:サービスタイプの変動分析、2022年および2030年
- 医療サービス
- 医療サービス市場収益推計と予測、2018~2030年
- 診断
- 予防ケア
- 治療
- 非医療サービス
- 非医療サービス市場収益推計と予測、2018~2030年
- ペットサービス
- 畜産サービス
第6章 獣医サービス市場:地域推定・動向分析
- 獣医サービス市場:地域変動分析、2022年および2030年
- 北米
- SWOT分析
- 北米獣医サービス市場推計・予測、2018年から2030年
- 米国
- カナダ
- 欧州
- SWOT分析
- 欧州の獣医サービス市場推計・予測、2018年から2030年
- ドイツ
- 英国
- フランス
- イタリア
- スペイン
- デンマーク
- スウェーデン
- ノルウェー
- アジア太平洋地域
- SWOT分析
- アジア太平洋地域の獣医サービス市場推計・予測、2018年から2030年
- 日本
- 中国
- インド
- オーストラリア
- 韓国
- タイ
- ラテンアメリカ
- SWOT分析
- ラテンアメリカの獣医サービス市場推計・予測、2018年から2030年
- ブラジル
- メキシコ
- アルゼンチン
- 中東とアフリカ
- SWOT分析
- 中東およびアフリカの獣医サービス市場推計・予測、2018年から2030年
- 南アフリカ
- サウジアラビア
- アラブ首長国連邦
- クウェート
第7章 競合情勢
- 市場参加の分類
- 主要な企業プロファイル
- CVS Group Plc
- Mars Incorporated
- National Veterinary Associates
- Pets at Home Group PLC
- Greencross Vets
- Fetch!Pet Care
- IVC Evidensia
- A Place for Rover, Inc.
- PetSmart LLC
- Airpets International
- 参入企業の概要
- サービスのベンチマーク
- 財務実績
- 戦略マッピング
- 市場リーダー
- その他の企業リスト
List of Table
Table 1. List of secondary sources
Table 2. North America Veterinary services market, by country, 2018 - 2030 (USD Billion)
Table 3. North America Veterinary services market, by animal type, 2018 - 2030 (USD Billion)
Table 4. North America Veterinary services market, by companion animal, 2018 - 2030 (USD Billion)
Table 5. North America Veterinary services market, by production animal, 2018 - 2030 (USD Billion)
Table 6. North America Veterinary services market, by service type, 2018 - 2030 (USD Billion)
Table 7. North America Veterinary services market, by medical services, 2018 - 2030 (USD Billion)
Table 8. North America Veterinary medical services market, by diagnosis, 2018 - 2030 (USD Billion)
Table 9. North America Veterinary medical services market, by treatment, 2018 - 2030 (USD Billion)
Table 10. North America Veterinary services market, by non-medical services, 2018 - 2030 (USD Billion)
Table 11. U.S. Veterinary services market, by animal type, 2018 - 2030 (USD Billion)
Table 12. U.S. Veterinary services market, by companion animal, 2018 - 2030 (USD Billion)
Table 13. U.S. Veterinary services market, by production animal, 2018 - 2030 (USD Billion)
Table 14. U.S. Veterinary services market, by service type, 2018 - 2030 (USD Billion)
Table 15. U.S. Veterinary services market, by medical services, 2018 - 2030 (USD Billion)
Table 16. U.S. Veterinary medical services market, by diagnosis, 2018 - 2030 (USD Billion)
Table 17. U.S. Veterinary medical services market, by treatment, 2018 - 2030 (USD Billion)
Table 18. U.S. Veterinary services market, by non-medical services, 2018 - 2030 (USD Billion)
Table 19. Canada Veterinary services market, by animal type, 2018 - 2030 (USD Billion)
Table 20. Canada Veterinary services market, by companion animal, 2018 - 2030 (USD Billion)
Table 21. Canada Veterinary services market, by production animal, 2018 - 2030 (USD Billion)
Table 22. Canada Veterinary services market, by service type, 2018 - 2030 (USD Billion)
Table 23. Canada Veterinary services market, by medical services, 2018 - 2030 (USD Billion)
Table 24. Canada Veterinary medical services market, by diagnosis, 2018 - 2030 (USD Billion)
Table 25. Canada Veterinary medical services market, by treatment, 2018 - 2030 (USD Billion)
Table 26. Canada Veterinary services market, by non-medical services, 2018 - 2030 (USD Billion)
Table 27. Europe Veterinary services market, by country, 2018 - 2030 (USD Billion)
Table 28. Europe Veterinary services market, by animal type, 2018 - 2030 (USD Billion)
Table 29. Europe Veterinary services market, by companion animal, 2018 - 2030 (USD Billion)
Table 30. Europe Veterinary services market, by production animal, 2018 - 2030 (USD Billion)
Table 31. Europe Veterinary services market, by service type, 2018 - 2030 (USD Billion)
Table 32. Europe Veterinary services market, by medical services, 2018 - 2030 (USD Billion)
Table 33. Europe Veterinary medical services market, by diagnosis, 2018 - 2030 (USD Billion)
Table 34. Europe Veterinary medical services market, by treatment, 2018 - 2030 (USD Billion)
Table 35. Europe Veterinary services market, by non-medical services, 2018 - 2030 (USD Billion)
Table 36. Germany Veterinary services market, by animal type, 2018 - 2030 (USD Billion)
Table 37. Germany Veterinary services market, by companion animal, 2018 - 2030 (USD Billion)
Table 38. Germany Veterinary services market, by production animal, 2018 - 2030 (USD Billion)
Table 39. Germany Veterinary services market, by service type, 2018 - 2030 (USD Billion)
Table 40. Germany Veterinary services market, by medical services, 2018 - 2030 (USD Billion)
Table 41. Germany Veterinary medical services market, by diagnosis, 2018 - 2030 (USD Billion)
Table 42. Germany Veterinary medical services market, by treatment, 2018 - 2030 (USD Billion)
Table 43. Germany Veterinary services market, by non-medical services, 2018 - 2030 (USD Billion)
Table 44. UK Veterinary services market, by animal type, 2018 - 2030 (USD Billion)
Table 45. UK Veterinary services market, by companion animal, 2018 - 2030 (USD Billion)
Table 46. UK Veterinary services market, by production animal, 2018 - 2030 (USD Billion)
Table 47. UK Veterinary services market, by service type, 2018 - 2030 (USD Billion)
Table 48. UK Veterinary services market, by medical services, 2018 - 2030 (USD Billion)
Table 49. UK Veterinary medical services market, by diagnosis, 2018 - 2030 (USD Billion)
Table 50. UK Veterinary medical services market, by treatment, 2018 - 2030 (USD Billion)
Table 51. UK Veterinary services market, by non-medical services, 2018 - 2030 (USD Billion)
Table 52. France Veterinary services market, by animal type, 2018 - 2030 (USD Billion)
Table 53. France Veterinary services market, by companion animal, 2018 - 2030 (USD Billion)
Table 54. France Veterinary services market, by production animal, 2018 - 2030 (USD Billion)
Table 55. France Veterinary services market, by service type, 2018 - 2030 (USD Billion)
Table 56. France Veterinary services market, by medical services, 2018 - 2030 (USD Billion)
Table 57. France Veterinary medical services market, by diagnosis, 2018 - 2030 (USD Billion)
Table 58. France Veterinary medical services market, by treatment, 2018 - 2030 (USD Billion)
Table 59. France Veterinary services market, by non-medical services, 2018 - 2030 (USD Billion)
Table 60. Italy Veterinary services market, by animal type, 2018 - 2030 (USD Billion)
Table 61. Italy Veterinary services market, by companion animal, 2018 - 2030 (USD Billion)
Table 62. Italy Veterinary services market, by production animal, 2018 - 2030 (USD Billion)
Table 63. Italy Veterinary services market, by service type, 2018 - 2030 (USD Billion)
Table 64. Italy Veterinary services market, by medical services, 2018 - 2030 (USD Billion)
Table 65. Italy Veterinary medical services market, by diagnosis, 2018 - 2030 (USD Billion)
Table 66. Italy Veterinary medical services market, by treatment, 2018 - 2030 (USD Billion)
Table 67. Italy Veterinary services market, by non-medical services, 2018 - 2030 (USD Billion)
Table 68. Spain Veterinary services market, by animal type, 2018 - 2030 (USD Billion)
Table 69. Spain Veterinary services market, by companion animal, 2018 - 2030 (USD Billion)
Table 70. Spain Veterinary services market, by production animal, 2018 - 2030 (USD Billion)
Table 71. Spain Veterinary services market, by service type, 2018 - 2030 (USD Billion)
Table 72. Spain Veterinary services market, by medical services, 2018 - 2030 (USD Billion)
Table 73. Spain Veterinary medical services market, by diagnosis, 2018 - 2030 (USD Billion)
Table 74. Spain Veterinary medical services market, by treatment, 2018 - 2030 (USD Billion)
Table 75. Spain Veterinary services market, by non-medical services, 2018 - 2030 (USD Billion)
Table 76. Denmark Veterinary services market, by animal type, 2018 - 2030 (USD Billion)
Table 77. Denmark Veterinary services market, by companion animal, 2018 - 2030 (USD Billion)
Table 78. Denmark Veterinary services market, by production animal, 2018 - 2030 (USD Billion)
Table 79. Denmark Veterinary services market, by service type, 2018 - 2030 (USD Billion)
Table 80. Denmark Veterinary services market, by medical services, 2018 - 2030 (USD Billion)
Table 81. Denmark Veterinary medical services market, by diagnosis, 2018 - 2030 (USD Billion)
Table 82. Denmark Veterinary medical services market, by treatment, 2018 - 2030 (USD Billion)
Table 83. Denmark Veterinary services market, by non-medical services, 2018 - 2030 (USD Billion)
Table 84. Sweden Veterinary services market, by animal type, 2018 - 2030 (USD Billion)
Table 85. Sweden Veterinary services market, by companion animal, 2018 - 2030 (USD Billion)
Table 86. Sweden Veterinary services market, by production animal, 2018 - 2030 (USD Billion)
Table 87. Sweden Veterinary services market, by service type, 2018 - 2030 (USD Billion)
Table 88. Sweden Veterinary services market, by medical services, 2018 - 2030 (USD Billion)
Table 89. Sweden Veterinary medical services market, by diagnosis, 2018 - 2030 (USD Billion)
Table 90. Sweden Veterinary medical services market, by treatment, 2018 - 2030 (USD Billion)
Table 91. Sweden Veterinary services market, by non-medical services, 2018 - 2030 (USD Billion)
Table 92. Norway Veterinary services market, by animal type, 2018 - 2030 (USD Billion)
Table 93. Norway Veterinary services market, by companion animal, 2018 - 2030 (USD Billion)
Table 94. Norway Veterinary services market, by production animal, 2018 - 2030 (USD Billion)
Table 95. Norway Veterinary services market, by service type, 2018 - 2030 (USD Billion)
Table 96. Norway Veterinary services market, by medical services, 2018 - 2030 (USD Billion)
Table 97. Norway Veterinary medical services market, by diagnosis, 2018 - 2030 (USD Billion)
Table 98. Norway Veterinary medical services market, by treatment, 2018 - 2030 (USD Billion)
Table 99. Norway Veterinary services market, by non-medical services, 2018 - 2030 (USD Billion)
Table 100. Asia Pacific Veterinary services market, by country, 2018 - 2030 (USD Billion)
Table 101. Asia Pacific Veterinary services market, by animal type, 2018 - 2030 (USD Billion)
Table 102. Asia Pacific Veterinary services market, by companion animal, 2018 - 2030 (USD Billion)
Table 103. Asia Pacific Veterinary services market, by production animal, 2018 - 2030 (USD Billion)
Table 104. Asia Pacific Veterinary services market, by service type, 2018 - 2030 (USD Billion)
Table 105. Asia Pacific Veterinary services market, by medical services, 2018 - 2030 (USD Billion)
Table 106. Asia Pacific Veterinary medical services market, by diagnosis, 2018 - 2030 (USD Billion)
Table 107. Asia Pacific Veterinary medical services market, by treatment, 2018 - 2030 (USD Billion)
Table 108. Asia Pacific Veterinary services market, by non-medical services, 2018 - 2030 (USD Billion)
Table 109. China Veterinary services market, by animal type, 2018 - 2030 (USD Billion)
Table 110. China Veterinary services market, by companion animal, 2018 - 2030 (USD Billion)
Table 111. China Veterinary services market, by production animal, 2018 - 2030 (USD Billion)
Table 112. China Veterinary services market, by service type, 2018 - 2030 (USD Billion)
Table 113. China Veterinary services market, by medical services, 2018 - 2030 (USD Billion)
Table 114. China Veterinary medical services market, by diagnosis, 2018 - 2030 (USD Billion)
Table 115. China Veterinary medical services market, by treatment, 2018 - 2030 (USD Billion)
Table 116. China Veterinary services market, by non-medical services, 2018 - 2030 (USD Billion)
Table 117. Japan Veterinary services market, by animal type, 2018 - 2030 (USD Billion)
Table 118. Japan Veterinary services market, by companion animal, 2018 - 2030 (USD Billion)
Table 119. Japan Veterinary services market, by production animal, 2018 - 2030 (USD Billion)
Table 120. Japan Veterinary services market, by service type, 2018 - 2030 (USD Billion)
Table 121. Japan Veterinary services market, by medical services, 2018 - 2030 (USD Billion)
Table 122. Japan Veterinary medical services market, by diagnosis, 2018 - 2030 (USD Billion)
Table 123. Japan Veterinary medical services market, by treatment, 2018 - 2030 (USD Billion)
Table 124. Japan Veterinary services market, by non-medical services, 2018 - 2030 (USD Billion)
Table 125. India Veterinary services market, by animal type, 2018 - 2030 (USD Billion)
Table 126. India Veterinary services market, by companion animal, 2018 - 2030 (USD Billion)
Table 127. India Veterinary services market, by production animal, 2018 - 2030 (USD Billion)
Table 128. India Veterinary services market, by service type, 2018 - 2030 (USD Billion)
Table 129. India Veterinary services market, by medical services, 2018 - 2030 (USD Billion)
Table 130. India Veterinary medical services market, by diagnosis, 2018 - 2030 (USD Billion)
Table 131. India Veterinary medical services market, by treatment, 2018 - 2030 (USD Billion)
Table 132. India Veterinary services market, by non-medical services, 2018 - 2030 (USD Billion)
Table 133. Australia Veterinary services market, by animal type, 2018 - 2030 (USD Billion)
Table 134. Australia Veterinary services market, by companion animal, 2018 - 2030 (USD Billion)
Table 135. Australia Veterinary services market, by production animal, 2018 - 2030 (USD Billion)
Table 136. Australia Veterinary services market, by service type, 2018 - 2030 (USD Billion)
Table 137. Australia Veterinary services market, by medical services, 2018 - 2030 (USD Billion)
Table 138. Australia Veterinary medical services market, by diagnosis, 2018 - 2030 (USD Billion)
Table 139. Australia Veterinary medical services market, by treatment, 2018 - 2030 (USD Billion)
Table 140. Australia Veterinary services market, by non-medical services, 2018 - 2030 (USD Billion)
Table 141. South Korea Veterinary services market, by animal type, 2018 - 2030 (USD Billion)
Table 142. South Korea Veterinary services market, by companion animal, 2018 - 2030 (USD Billion)
Table 143. South Korea Veterinary services market, by production animal, 2018 - 2030 (USD Billion)
Table 144. South Korea Veterinary services market, by service type, 2018 - 2030 (USD Billion)
Table 145. South Korea Veterinary services market, by medical services, 2018 - 2030 (USD Billion)
Table 146. South Korea Veterinary medical services market, by diagnosis, 2018 - 2030 (USD Billion)
Table 147. South Korea Veterinary medical services market, by treatment, 2018 - 2030 (USD Billion)
Table 148. South Korea Veterinary services market, by non-medical services, 2018 - 2030 (USD Billion)
Table 149. LATAM Veterinary services market, by country, 2018 - 2030 (USD Billion)
Table 150. LATAM Veterinary services market, by animal type, 2018 - 2030 (USD Billion)
Table 151. LATAM Veterinary services market, by companion animal, 2018 - 2030 (USD Billion)
Table 152. LATAM Veterinary services market, by production animal, 2018 - 2030 (USD Billion)
Table 153. LATAM Veterinary services market, by service type, 2018 - 2030 (USD Billion)
Table 154. LATAM Veterinary services market, by medical services, 2018 - 2030 (USD Billion)
Table 155. LATAM Veterinary medical services market, by diagnosis, 2018 - 2030 (USD Billion)
Table 156. LATAM Veterinary medical services market, by treatment, 2018 - 2030 (USD Billion)
Table 157. LATAM Veterinary services market, by non-medical services, 2018 - 2030 (USD Billion)
Table 158. Brazil Veterinary services market, by animal type, 2018 - 2030 (USD Billion)
Table 159. Brazil Veterinary services market, by companion animal, 2018 - 2030 (USD Billion)
Table 160. Brazil Veterinary services market, by production animal, 2018 - 2030 (USD Billion)
Table 161. Brazil Veterinary services market, by service type, 2018 - 2030 (USD Billion)
Table 162. Brazil Veterinary services market, by medical services, 2018 - 2030 (USD Billion)
Table 163. Brazil Veterinary medical services market, by diagnosis, 2018 - 2030 (USD Billion)
Table 164. Brazil Veterinary medical services market, by treatment, 2018 - 2030 (USD Billion)
Table 165. Brazil Veterinary services market, by non-medical services, 2018 - 2030 (USD Billion)
Table 166. Mexico Veterinary services market, by animal type, 2018 - 2030 (USD Billion)
Table 167. Mexico Veterinary services market, by companion animal, 2018 - 2030 (USD Billion)
Table 168. Mexico Veterinary services market, by production animal, 2018 - 2030 (USD Billion)
Table 169. Mexico Veterinary services market, by service type, 2018 - 2030 (USD Billion)
Table 170. Mexico Veterinary services market, by medical services, 2018 - 2030 (USD Billion)
Table 171. Mexico Veterinary medical services market, by diagnosis, 2018 - 2030 (USD Billion)
Table 172. Mexico Veterinary medical services market, by treatment, 2018 - 2030 (USD Billion)
Table 173. Mexico Veterinary services market, by non-medical services, 2018 - 2030 (USD Billion)
Table 174. Argentina Veterinary services market, by animal type, 2018 - 2030 (USD Billion)
Table 175. Argentina Veterinary services market, by companion animal, 2018 - 2030 (USD Billion)
Table 176. Argentina Veterinary services market, by production animal, 2018 - 2030 (USD Billion)
Table 177. Argentina Veterinary services market, by service type, 2018 - 2030 (USD Billion)
Table 178. Argentina Veterinary services market, by medical services, 2018 - 2030 (USD Billion)
Table 179. Argentina Veterinary medical services market, by diagnosis, 2018 - 2030 (USD Billion)
Table 180. Argentina Veterinary medical services market, by treatment, 2018 - 2030 (USD Billion)
Table 181. Argentina Veterinary services market, by non-medical services, 2018 - 2030 (USD Billion)
Table 182. MEA Veterinary services market, by country, 2018 - 2030 (USD Billion)
Table 183. MEA Veterinary services market, by animal type, 2018 - 2030 (USD Billion)
Table 184. MEA Veterinary services market, by companion animal, 2018 - 2030 (USD Billion)
Table 185. MEA Veterinary services market, by production animal, 2018 - 2030 (USD Billion)
Table 186. MEA Veterinary services market, by service type, 2018 - 2030 (USD Billion)
Table 187. MEA Veterinary services market, by medical services, 2018 - 2030 (USD Billion)
Table 188. MEA Veterinary medical services market, by diagnosis, 2018 - 2030 (USD Billion)
Table 189. MEA Veterinary medical services market, by treatment, 2018 - 2030 (USD Billion)
Table 190. MEA Veterinary services market, by non-medical services, 2018 - 2030 (USD Billion)
Table 191. South Africa Veterinary services market, by animal type, 2018 - 2030 (USD Billion)
Table 192. South Africa Veterinary services market, by companion animal, 2018 - 2030 (USD Billion)
Table 193. South Africa Veterinary services market, by production animal, 2018 - 2030 (USD Billion)
Table 194. South Africa Veterinary services market, by service type, 2018 - 2030 (USD Billion)
Table 195. South Africa Veterinary services market, by medical services, 2018 - 2030 (USD Billion)
Table 196. South Africa Veterinary medical services market, by diagnosis, 2018 - 2030 (USD Billion)
Table 197. South Africa Veterinary medical services market, by treatment, 2018 - 2030 (USD Billion)
Table 198. South Africa Veterinary services market, by non-medical services, 2018 - 2030 (USD Billion)
Table 199. Saudi Arabia Veterinary services market, by animal type, 2018 - 2030 (USD Billion)
Table 200. Saudi Arabia Veterinary services market, by companion animal, 2018 - 2030 (USD Billion)
Table 201. Saudi Arabia Veterinary services market, by production animal, 2018 - 2030 (USD Billion)
Table 202. Saudi Arabia Veterinary services market, by service type, 2018 - 2030 (USD Billion)
Table 203. Saudi Arabia Veterinary services market, by medical services, 2018 - 2030 (USD Billion)
Table 204. Saudi Arabia Veterinary medical services market, by diagnosis, 2018 - 2030 (USD Billion)
Table 205. Saudi Arabia Veterinary medical services market, by treatment, 2018 - 2030 (USD Billion)
Table 206. Saudi Arabia Veterinary services market, by non-medical services, 2018 - 2030 (USD Billion)
Table 207. UAE Veterinary services market, by animal type, 2018 - 2030 (USD Billion)
Table 208. UAE Veterinary services market, by companion animal, 2018 - 2030 (USD Billion)
Table 209. UAE Veterinary services market, by production animal, 2018 - 2030 (USD Billion)
Table 210. UAE Veterinary services market, by service type, 2018 - 2030 (USD Billion)
Table 211. UAE Veterinary services market, by medical services, 2018 - 2030 (USD Billion)
Table 212. UAE Veterinary medical services market, by diagnosis, 2018 - 2030 (USD Billion)
Table 213. UAE Veterinary medical services market, by treatment, 2018 - 2030 (USD Billion)
Table 214. UAE Veterinary services market, by non-medical services, 2018 - 2030 (USD Billion)
Table 215. Kuwait Veterinary services market, by animal type, 2018 - 2030 (USD Billion)
Table 216. Kuwait Veterinary services market, by companion animal, 2018 - 2030 (USD Billion)
Table 217. Kuwait Veterinary services market, by production animal, 2018 - 2030 (USD Billion)
Table 218. Kuwait Veterinary services market, by service type, 2018 - 2030 (USD Billion)
Table 219. Kuwait Veterinary services market, by medical services, 2018 - 2030 (USD Billion)
Table 220. Kuwait Veterinary medical services market, by diagnosis, 2018 - 2030 (USD Billion)
Table 221. Kuwait Veterinary medical services market, by treatment, 2018 - 2030 (USD Billion)
Table 222. Kuwait Veterinary services market, by non-medical services, 2018 - 2030 (USD Billion)
Table 223. Participants Overview
Table 224. Financial Performance
Table 225. Service Benchmarking
Table 226. Strategy Mapping
Table 227. List of Other Players
List of Figures
- Fig. 1 Market segmentation
- Fig. 2 Market research process
- Fig. 3 Data triangulation techniques
- Fig. 4 Primary research pattern
- Fig. 5 Market research approaches
- Fig. 6 Value - chain - based sizing & forecasting
- Fig. 7 QFD modeling for market share assessment
- Fig. 8 Market formulation & validation
- Fig. 9 Commodity flow analysis
- Fig. 10 Market lineage charts
- Fig. 11 Market dynamics
- Fig. 12 Market driver analysis
- Fig. 13 Market restraint analysis
- Fig. 14 Market porter's analysis
- Fig. 15 Market PESTEL analysis
- Fig. 16 Veterinary services market animal type outlook: Key takeaways, 2022 & 2030
- Fig. 17 Veterinary services market: Animal type movement analysis
- Fig. 18 Global companion animal market, 2018 - 2030 (USD Billion)
- Fig. 19 Global dogs market, by companion animals, 2018 - 2030 (USD Billion)
- Fig. 20 Global cats market, by companion animals, 2018 - 2030 (USD Billion)
- Fig. 21 Global horses market, by companion animals, 2018 - 2030 (USD Billion)
- Fig. 22 Global others market, by companion animals, 2018 - 2030 (USD Billion)
- Fig. 23 Global production animal market, 2018 - 2030 (USD Billion)
- Fig. 24 Global cattle market, by production animals, 2018 - 2030 (USD Billion)
- Fig. 25 Global poultry market, by production animals, 2018 - 2030 (USD Billion)
- Fig. 26 Global swine market, by production animals, 2018 - 2030 (USD Billion)
- Fig. 27 Global others market, by production animals, 2018 - 2030 (USD Billion)
- Fig. 28 Veterinary services market service type outlook: Key takeaways, 2022 & 2030
- Fig. 29 Veterinary services market: Service type movement analysis
- Fig. 30 Global medical services market 2018 - 2030 (USD Billion)
- Fig. 31 Global diagnosis market, by medical services, 2018 - 2030 (USD Billion)
- Fig. 32 Global in - vitro diagnosis market, by diagnosis, 2018 - 2030 (USD Billion)
- Fig. 33 Global in - vivo diagnosis market, by diagnosis, 2018 - 2030 (USD Billion)
- Fig. 34 Global preventative care market, by medical services, 2018 - 2030 (USD Billion)
- Fig. 35 Global treatment market, by medical services, 2018 - 2030 (USD Billion)
- Fig. 36 Global consultation market, by treatment, 2018 - 2030 (USD Billion)
- Fig. 37 Global surgery market, by treatment, 2018 - 2030 (USD Billion)
- Fig. 38 Global others market, by treatment, 2018 - 2030 (USD Billion)
- Fig. 39 Global non-medical services market 2018 - 2030 (USD Billion)
- Fig. 40 Global pet services market, by non-medical services, 2018 - 2030 (USD Billion)
- Fig. 41 Global livestock services market, by non-medical services, 2018 - 2030 (USD Billion)
- Fig. 42 Regional outlook, 2022 & 2030
- Fig. 43 Regional marketplace: Key takeaways
- Fig. 44 North America Veterinary services market by countries, 2018 - 2030 (USD Billion)
- Fig. 45 U.S. veterinary services market, 2018 - 2030 (USD Billion)
- Fig. 46 Canada veterinary services market, 2018 - 2030 (USD Billion)
- Fig. 47 Europe veterinary services market by countries, 2018 - 2030 (USD Billion)
- Fig. 48 Germany veterinary services market, 2018 - 2030 (USD Billion)
- Fig. 49 UK veterinary services market, 2018 - 2030 (USD Billion)
- Fig. 50 France veterinary services market, 2018 - 2030 (USD Billion)
- Fig. 51 Italy veterinary services market, 2018 - 2030 (USD Billion)
- Fig. 52 Spain veterinary services market, 2018 - 2030 (USD Billion)
- Fig. 53 Denmark veterinary services market, 2018 - 2030 (USD Billion)
- Fig. 54 Sweden veterinary services market, 2018 - 2030 (USD Billion)
- Fig. 55 Norway veterinary services market, 2018 - 2030 (USD Billion)
- Fig. 56 Asia Pacific veterinary services market by countries, 2018 - 2030 (USD Billion)
- Fig. 57 Japan veterinary services market, 2018 - 2030 (USD Billion)
- Fig. 58 China veterinary services market, 2018 - 2030 (USD Billion)
- Fig. 59 India veterinary services market, 2018 - 2030 (USD Billion)
- Fig. 60 Australia veterinary services market, 2018 - 2030 (USD Billion)
- Fig. 61 South Korea veterinary services market, 2018 - 2030 (USD Billion)
- Fig. 62 Thailand veterinary services market, 2018 - 2030 (USD Billion)
- Fig. 63 Latin America veterinary services market by countries, 2018 - 2030 (USD Billion)
- Fig. 64 Brazil veterinary services market, 2018 - 2030 (USD Billion)
- Fig. 65 Mexico veterinary services market, 2018 - 2030 (USD Billion)
- Fig. 66 Argentina veterinary services market, 2018 - 2030 (USD Billion)
- Fig. 67 MEA veterinary services market by countries, 2018 - 2030 (USD Billion)
- Fig. 68 South Africa veterinary services market, 2018 - 2030 (USD Billion)
- Fig. 69 Saudi Arabia veterinary services market, 2018 - 2030 (USD Billion)
- Fig. 70 UAE veterinary services market, 2018 - 2030 (USD Billion)
- Fig. 71 Kuwait veterinary services market, 2018 - 2030 (USD Billion)
- Fig. 72 Market participant categorization
Veterinary Services Market Growth & Trends
The global veterinary services market size is projected to reach USD 212.73 billion by 2030, according to a new report by Grand View Research, Inc. The market is expected to grow at a CAGR of 7.45% from 2023 to 2030.Some of the key factors propelling the market growth include increasing animal welfare activities, the rising need to enhance food security, increasing pet population, growing awareness about animal health & timely diagnosis & treatments, and increasing expenditure on animal healthcare services. For instance, according to the American Pet Products Association (APPA), overall spending in the U.S. pet industry was estimated at USD 136.8 billion in 2022.
This was notably greater than the USD 123.6 billion estimated in 2021. Hence, the growing expenditure is expected to boost the adoption of veterinary services in the coming years.The COVID-19 outbreak had a mixed effect on the global market. During the year 2020, the market witnessed a decline in growth rate owing to movement restrictions, nationwide lockdowns, and lesser admission rates in veterinary hospitals and other non-medical animal care centers. However, the market quickly recovered the following year, as the COVID-19 lockdowns significantly increased pet adoption rates globally, owing to people's social isolation & psychological benefits.
For instance, as per an article published in May 2021 in Frontiers Media S.A., the UK witnessed a peek in pet adoption rates, which led to the shelters emptying during the pandemic. In addition, the coronavirus pandemic has increased the concerns over animal-to-animal and animal-to-human disease transmission risks, which, in turn, has increased the government measures on preventative care and diagnosis in livestock animals. The WHO is involved in various cross-sectoral activities to address health threats at the human-animal-ecosystem interface.The overall population of pet animals across the globe has also increased, which supports market growth.
The American Veterinary Medical Association (AVMA) reported in November 2021 that from 2016 to 2020, the companion animal population increased notably. In addition, the 2023 - 2024 survey report published by American Pet Products Association estimated that 65.1 million households in the U.S. own dogs and 46.5 million households own cats. The FEDIAF 2022 report suggested that the region had 113.6 million cats and 92.9 million dogs as of 2021. Therefore, the rising pet population and adoption of cats & dogs are among the key factors drivingthe market growth.
Veterinary Services Market Report Highlights
- The production animal segment dominated the market with the largest revenue share in 2022. The segment is expected to continue to grow in the coming years, driven by factors, such as the increasing demand for animal protein and the rising focus on sustainable agriculture practices
- Based on the type of services, the market is bifurcated into medical and non-medical services. The medical services segment dominated the market with the largest revenue share in 2022, owing to the growing prevalence of zoonotic diseases and significant measures undertaken to control the outbreaks, coupled with increasing access to veterinary medical services in developing nations
- North America accounted for the highest revenue share of more than 35% in 2022. Definitive measures undertaken by various government animal welfare organizations inclined toward the overall improvement of veterinary services in the U.S. and Canada are the key factor responsible for this substantial growth
- The market is competitive and largely fragmented with the presence of a significant number of small- and large-scale veterinary service providers
Table of Contents
Chapter 1. Methodology and Scope
- 1.1. Market Segmentation and Scope
- 1.2. Research Methodology
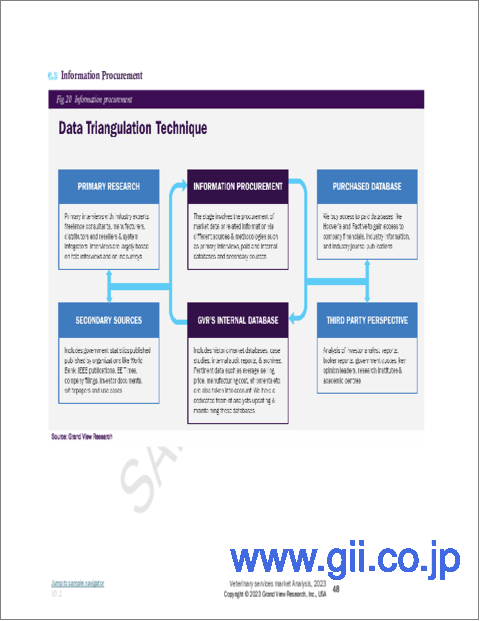
- 1.2.1. Information Procurement
- 1.3. Information or Data Analysis
- 1.4. General Methodology
- 1.5. Research Scope & Assumptions
- 1.6. Market Formulation & Validation
- 1.7. Model Details
- 1.7.1. Commodity Flow Analysis
- 1.7.2. Bottom - Up & Hybrid Model
- 1.7.3. CAGR Calculation
- 1.8. List of Secondary Sources
Chapter 2. Executive Summary
- 2.1. Market Snapshot
- 2.2. Segment Snapshot
- 2.3. Competitive Landscape Snapshot
Chapter 3. Market Variables, Trends, & Scope
- 3.1. Market Lineage Outlook
- 3.1.1. Parent Market Outlook
- 3.1.2. Related/Ancillary Market Outlook
- 3.2. Market Dynamics
- 3.2.1. Market Driver Analysis
- 3.2.2. Market Restraint Analysis
- 3.2.3. Market Opportunity Analysis
- 3.2.4. Market Challenge Analysis
- 3.3. Industry Analysis
- 3.3.1. Porter's
- 3.3.2. PESTLE
- 3.4. Estimated Animal Population by Region & Key Countries, 2018 - 2022
- 3.5. Pricing Analysis
- 3.6. Customer Perspective Analysis
- 3.6.1. U.S. Pet Owner Profile Based on Demographics, 2022
- 3.7. COVID-19 Impact Analysis
Chapter 4. Veterinary Services Market: Animal Type Estimates & Trend Analysis
- 4.1. Segment Dashboard
- 4.2. Veterinary Services Market: Animal type Movement Analysis, USD Billion, 2022 & 2030
- 4.3. Companion Animals
- 4.3.1. Companion Animals Market Revenue Estimates and Forecasts, 2018 - 2030 (USD Billion)
- 4.3.2. Dogs
- 4.3.2.1. Dogs Market Revenue Estimates and Forecasts, 2018 - 2030 (USD Billion)
- 4.3.3. Cats
- 4.3.3.1. Cats Market Revenue Estimates and Forecasts, 2018 - 2030 (USD Billion)
- 4.3.4. Horses
- 4.3.4.1. Horses Market Revenue Estimates and Forecasts, 2018 - 2030 (USD Billion)
- 4.3.5. Others
- 4.3.5.1. Others Market Revenue Estimates and Forecasts, 2018 - 2030 (USD Billion)
- 4.4. Production Animals
- 4.4.1. Production Animals Market Revenue Estimates and Forecasts, 2018 - 2030 (USD Billion)
- 4.4.2. Cattle
- 4.4.2.1. Cattle Market Revenue Estimates and Forecasts, 2018 - 2030 (USD Billion)
- 4.4.3. Poultry
- 4.4.3.1. Poultry Market Revenue Estimates and Forecasts, 2018 - 2030 (USD Billion)
- 4.4.4. Swine
- 4.4.4.1. Swine Market Revenue Estimates and Forecasts, 2018 - 2030 (USD Billion)
- 4.4.5. Others
- 4.4.5.1. Others Market Revenue Estimates and Forecasts, 2018 - 2030 (USD Billion)
Chapter 5. Veterinary Services Market: Service Type Estimates & Trend Analysis
- 5.1. Segment Dashboard
- 5.2. Veterinary Services Market: Service Type Movement Analysis, USD Billion, 2022 & 2030
- 5.3. Medical Services
- 5.3.1. Medical Services Market Revenue Estimates and Forecasts, 2018 - 2030 (USD Billion)
- 5.3.2. Diagnosis
- 5.3.2.1. Diagnosis Market Revenue Estimates and Forecasts, 2018 - 2030 (USD Billion)
- 5.3.2.2. In-Vitro Diagnosis
- 5.3.2.2.1. In-Vitro Diagnosis Market Revenue Estimates and Forecasts, 2018 - 2030 (USD Billion)
- 5.3.2.3. In-Vivo Diagnosis
- 5.3.2.3.1. In-Vivo Diagnosis Market Revenue Estimates and Forecasts, 2018 - 2030 (USD Billion)
- 5.3.3. Preventative Care
- 5.3.3.1. Preventative Care Market Revenue Estimates and Forecasts, 2018 - 2030 (USD Billion)
- 5.3.4. Treatment
- 5.3.4.1. Treatment Market Revenue Estimates and Forecasts, 2018 - 2030 (USD Billion)
- 5.3.4.2. Consultation
- 5.3.4.2.1. Consultation Market Revenue Estimates and Forecasts, 2018 - 2030 (USD Billion)
- 5.3.4.3. Surgery
- 5.3.4.3.1. Surgery Market Revenue Estimates and Forecasts, 2018 - 2030 (USD Billion)
- 5.3.4.4. Others
- 5.3.4.4.1. Others Market Revenue Estimates and Forecasts, 2018 - 2030 (USD Billion)
- 5.4. Non-Medical Services
- 5.4.1. Non-Medical Services Market Revenue Estimates and Forecasts, 2018 - 2030 (USD Billion)
- 5.4.2. Pet Services
- 5.4.2.1. Pet Services Market Revenue Estimates and Forecasts, 2018 - 2030 (USD Billion)
- 5.4.3. Livestock Services
- 5.4.3.1. Livestock Services Market Revenue Estimates and Forecasts, 2018 - 2030 (USD Billion)
Chapter 6. Veterinary Services Market: Regional Estimates & Trend Analysis
- 6.1. Veterinary Services Market: Regional Movement Analysis, 2022 & 2030
- 6.2. North America
- 6.2.1. SWOT Analysis
- 6.2.2. North America Veterinary Services Market Estimates And Forecasts, 2018 - 2030 (USD Billion)
- 6.2.3. U.S.
- 6.2.3.1. Key Country Dynamics
- 6.2.3.2. U.S. Veterinary Services Market Estimates And Forecasts, 2018 - 2030 (USD Billion)
- 6.2.4. Canada
- 6.2.4.1. Key Country Dynamics
- 6.2.4.2. Canada Veterinary Services Market Estimates And Forecasts, 2018 - 2030 (USD Billion)
- 6.3. Europe
- 6.3.1. SWOT Analysis
- 6.3.2. Europe Veterinary Services Market Estimates And Forecasts, 2018 - 2030 (USD Billion)
- 6.3.3. Germany
- 6.3.3.1. Key Country Dynamics
- 6.3.3.2. Germany Veterinary Services Market Estimates And Forecasts, 2018 - 2030 (USD Billion)
- 6.3.4. UK
- 6.3.4.1. Key Country Dynamics
- 6.3.4.2. UK Veterinary Services Market Estimates And Forecasts, 2018 - 2030 (USD Billion)
- 6.3.5. France
- 6.3.5.1. Key Country Dynamics
- 6.3.5.2. France Veterinary Services Market Estimates And Forecasts, 2018 - 2030 (USD Billion)
- 6.3.6. Italy
- 6.3.6.1. Key Country Dynamics
- 6.3.6.2. Italy Veterinary Services Market Estimates And Forecasts, 2018 - 2030 (USD Billion)
- 6.3.7. Spain
- 6.3.7.1. Key Country Dynamics
- 6.3.7.2. Spain Veterinary Services Market Estimates And Forecasts, 2018 - 2030 (USD Billion)
- 6.3.8. Denmark
- 6.3.8.1. Key Country Dynamics
- 6.3.8.2. Denmark Veterinary Services Market Estimates And Forecasts, 2018 - 2030 (USD Billion)
- 6.3.9. Sweden
- 6.3.9.1. Key Country Dynamics
- 6.3.9.2. Sweden Veterinary Services Market Estimates And Forecasts, 2018 - 2030 (USD Billion)
- 6.3.10. Norway
- 6.3.10.1. Key Country Dynamics
- 6.3.10.2. Norway Veterinary Services Market Estimates And Forecasts, 2018 - 2030 (USD Billion)
- 6.4. Asia Pacific
- 6.4.1. SWOT Analysis
- 6.4.2. Asia Pacific Veterinary Services Market Estimates And Forecasts, 2018 - 2030 (USD Billion)
- 6.4.3. Japan
- 6.4.3.1. Key Country Dynamics
- 6.4.3.2. Japan Veterinary Services Market Estimates And Forecasts, 2018 - 2030 (USD Billion)
- 6.4.4. China
- 6.4.4.1. Key Country Dynamics
- 6.4.4.2. China Veterinary Services Market Estimates And Forecasts, 2018 - 2030 (USD Billion)
- 6.4.5. India
- 6.4.5.1. Key Country Dynamics
- 6.4.5.2. India Veterinary Services Market Estimates And Forecasts, 2018 - 2030 (USD Billion)
- 6.4.6. Australia
- 6.4.6.1. Key Country Dynamics
- 6.4.6.2. Australia Veterinary Services Market Estimates And Forecasts, 2018 - 2030 (USD Billion)
- 6.4.7. South Korea
- 6.4.7.1. Key Country Dynamics
- 6.4.7.2. South Korea Veterinary Services Market Estimates And Forecasts, 2018 - 2030 (USD Billion)
- 6.4.8. Thailand
- 6.4.8.1. Key Country Dynamics
- 6.4.8.2. Thailand Veterinary Services Market Estimates And Forecasts, 2018 - 2030 (USD Billion)
- 6.5. Latin America
- 6.5.1. SWOT Analysis
- 6.5.2. Latin America Veterinary Services Market Estimates And Forecasts, 2018 - 2030 (USD Billion)
- 6.5.3. Brazil
- 6.5.3.1. Key Country Dynamics
- 6.5.3.2. Brazil Veterinary Services Market Estimates And Forecasts, 2018 - 2030 (USD Billion)
- 6.5.4. Mexico
- 6.5.4.1. Key Country Dynamics
- 6.5.4.2. Mexico Veterinary Services Market Estimates And Forecasts, 2018 - 2030 (USD Billion)
- 6.5.5. Argentina
- 6.5.5.1. Key Country Dynamics
- 6.5.5.2. Argentina Veterinary Services Market Estimates And Forecasts, 2018 - 2030 (USD Billion)
- 6.6. Middle East & Africa
- 6.6.1. SWOT Analysis
- 6.6.2. Middle East & Africa Veterinary Services Market Estimates And Forecasts, 2018 - 2030 (USD Billion)
- 6.6.3. South Africa
- 6.6.3.1. Key Country Dynamics
- 6.6.3.2. South Africa Veterinary Services Market Estimates And Forecasts, 2018 - 2030 (USD Billion)
- 6.6.4. Saudi Arabia
- 6.6.4.1. Key Country Dynamics
- 6.6.4.2. Saudi Arabia Veterinary Services Market Estimates And Forecasts, 2018 - 2030 (USD Billion)
- 6.6.5. UAE
- 6.6.5.1. Key Country Dynamics
- 6.6.5.2. UAE Veterinary Services Market Estimates And Forecasts, 2018 - 2030 (USD Billion)
- 6.6.6. Kuwait
- 6.6.6.1. Key Country Dynamics
- 6.6.6.2. Kuwait Veterinary Services Market Estimates And Forecasts, 2018 - 2030 (USD Billion)
Chapter 7. Competitive Landscape
- 7.1. Market Participation Categorization
- 7.2. Key Company Profiles
- 7.2.1. CVS Group Plc
- 7.2.2. Mars Incorporated
- 7.2.3. National Veterinary Associates
- 7.2.4. Pets at Home Group PLC
- 7.2.5. Greencross Vets
- 7.2.6. Fetch! Pet Care
- 7.2.7. IVC Evidensia
- 7.2.8. A Place for Rover, Inc.
- 7.2.9. PetSmart LLC
- 7.2.10. Airpets International
- 7.3. Participant's Overview
- 7.4. Service Benchmarking
- 7.5. Financial Performance
- 7.6. Strategy Mapping
- 7.7. Market Leaders
- 7.7.1. Estimated Market Position Analysis, 2022 (Heat Map Analysis)
- 7.8. List of Other Players
