|
|
市場調査レポート
商品コード
1526351
電動自転車の世界市場Electric Bikes |
||||||
|
|||||||
適宜更新あり
|
|||||||

| 電動自転車の世界市場 |
|
出版日: 2024年08月05日
発行: Market Glass, Inc. (Formerly Global Industry Analysts, Inc.)
ページ情報: 英文 362 Pages
納期: 即日から翌営業日
|

全表示
- 概要
- 目次
電動自転車の世界市場は2030年までに539億米ドルに達する見込み
2023年に323億米ドルと推定される電動自転車の世界市場は、2023年から2030年にかけてCAGR 7.6%で成長し、2030年には539億米ドルに達すると予測されます。本レポートで分析したセグメントの1つであるハブモータードライブ電動自転車は、CAGR 8.1%を記録し、分析期間終了までに394億米ドルに達すると予測されます。ミッドドライブ電動自転車セグメントの成長率は、分析期間でCAGR 6.5%と推定されます。
米国市場は14億米ドル、中国はCAGR 8.7%で成長予測
米国の電動自転車市場は2023年に14億米ドルと推定されます。世界第2位の経済大国である中国は、2030年までに210億米ドルの市場規模に達すると予測され、分析期間2023-2030年のCAGRは8.7%です。その他の注目すべき地域別市場としては、日本とカナダがあり、分析期間中のCAGRはそれぞれ5.2%と5.9%と予測されています。欧州では、ドイツがCAGR 5.9%で成長すると予測されています。
世界の電動自転車市場動向と促進要因まとめ
電動自転車(e-bike)は、伝統的な自転車のシンプルさと効率性を現代の電動推進技術と融合させた、個人移動における変革的イノベーションとして登場しました。E-bikeは、ライダーのペダリングをアシストする電気モーターを搭載しており、長距離の移動や急な坂道も楽にこぐことができます。この技術により、高齢者や身体の不自由な人を含む幅広い層がサイクリングを楽しめるようになり、E-BIKEは短距離から中距離の通勤において、自動車に代わる有効な選択肢として位置づけられています。市場には、都市部の通勤モデルから頑丈なマウンテンバイクやカーゴバイクまで、さまざまな使用事例や嗜好に対応した幅広い種類のe-bikeがあります。e-bikeの魅力は、その利便性と多用途性だけでなく、都市の混雑や公害を緩和し、より持続可能な都市モビリティを促進する可能性にもあります。
技術の進歩により、E-BIKEの性能と魅力は大幅に向上しています。バッテリー技術の向上、特にリチウムイオンバッテリーの開発により、e-bikeの航続距離は伸び、重量も軽減され、日常的な使用により実用的なものとなった。最近のe-bikeは、内蔵GPS、Bluetooth接続、アプリベースのコントロールなどのスマートテクノロジーを搭載していることが多く、ライダーはライドの追跡、ルートナビゲーション、バッテリー残量のモニターができます。さらに、モーター設計の進歩により、より静かで、より効率的で、よりパワフルなモーターが開発され、全体的なライディング体験が向上しています。メーカー各社はまた、電動自転車の美観と人間工学の改善にも注力しており、バッテリーとモーターをフレームにシームレスに統合することで、より多くの人々にアピールするスマートでスタイリッシュなデザインを生み出しています。
電動自転車市場の成長は、いくつかの要因によってもたらされます。第一に、環境問題に対する意識の高まりと二酸化炭素排出量削減の必要性から、多くの消費者がより環境に優しい交通手段を求めるようになり、その選択肢の一つとして電動自転車が浮上しています。第二に、燃料費の高騰と都市部の混雑が従来の自動車通勤の魅力を低下させている一方で、e-bikeは都市部での移動に費用対効果が高く効率的なソリューションを提供しています。第三に、e-bike購入に対する補助金や税金の払い戻しなど、政府の支援政策やインセンティブが普及を後押ししています。さらに、COVID-19の大流行は、人々が公共交通機関に代わるより安全な交通手段を求めているため、個人的な移動手段へのシフトを加速させています。バッテリー技術の進歩や、自転車専用レーンや充電ステーションを含むサイクリング用インフラの拡大も、市場を牽引する上で重要な役割を果たしています。先進的なバッテリー、小型・軽量のミッドドライブ・モーター、耐久性を向上させたチェーンなどが、e-bike市場の動向となっています。バイクに搭載されるパーソナライズされたペダル・アシスト・システム(PAS)は、バイク・ライダーに賠償責任保険をかける必要がないため、成長が見込まれます。これらの要因が相まって、電動自転車市場はダイナミックかつ急成長しており、イノベーションと普及の大きなチャンスとなっています。
調査対象企業の例(全 196件)
- Bajaj Auto Ltd.
- Accell Group N.V.
- Aima Technology Co., Ltd.
- Avanti Bikes
- Batavus BV
- BH Bikes
- Blaupunkt GmbH
- Blue Factory Team SLU(Mondraker)
- BMC Switzerland AG
- Brompton Bicycle Ltd.
- Cannondale Bicycle Corporation
- Canyon Bicycles GmbH
- Bike Friday
- Bird Rides, Inc.
- Ather Energy
目次
第1章 調査手法
第2章 エグゼクティブサマリー
- 市場概要
- 主要企業
- 市場動向と促進要因
- 世界市場の見通し
第3章 市場分析
- 米国
- カナダ
- 日本
- 中国
- 欧州
- フランス
- ドイツ
- イタリア
- 英国
- ベルギー
- オランダ
- その他欧州
- アジア太平洋
- ラテンアメリカ
- 世界のその他の地域
第4章 競合
Global Electric Bikes Market to Reach US$53.9 Billion by 2030
The global market for Electric Bikes estimated at US$32.3 Billion in the year 2023, is expected to reach US$53.9 Billion by 2030, growing at a CAGR of 7.6% over the analysis period 2023-2030. Hub Motor Drive Electric Bikes, one of the segments analyzed in the report, is expected to record a 8.1% CAGR and reach US$39.4 Billion by the end of the analysis period. Growth in the Mid Drive Electric Bikes segment is estimated at 6.5% CAGR over the analysis period.
The U.S. Market is Estimated at US$1.4 Billion While China is Forecast to Grow at 8.7% CAGR
The Electric Bikes market in the U.S. is estimated at US$1.4 Billion in the year 2023. China, the world's second largest economy, is forecast to reach a projected market size of US$21.0 Billion by the year 2030 trailing a CAGR of 8.7% over the analysis period 2023-2030. Among the other noteworthy geographic markets are Japan and Canada, each forecast to grow at a CAGR of 5.2% and 5.9% respectively over the analysis period. Within Europe, Germany is forecast to grow at approximately 5.9% CAGR.
Global Electric Bikes Market - Key Trends & Drivers Summarized
Electric bikes, or e-bikes, have emerged as a transformative innovation in personal transportation, blending the traditional bicycle's simplicity and efficiency with modern electric propulsion technology. E-bikes are equipped with an electric motor that assists the rider's pedaling, making it easier to travel longer distances and tackle steep inclines without excessive effort. This technology has made cycling accessible to a broader demographic, including older adults and those with physical limitations, and has positioned e-bikes as a viable alternative to cars for short to medium commutes. The market offers a wide range of e-bikes, from urban commuter models to rugged mountain bikes and cargo bikes, catering to various use cases and preferences. The appeal of e-bikes lies not only in their convenience and versatility but also in their potential to reduce urban congestion and pollution, promoting more sustainable urban mobility.
Technological advancements have significantly enhanced the performance and appeal of electric bikes. Improvements in battery technology, particularly the development of lithium-ion batteries, have increased the range and reduced the weight of e-bikes, making them more practical for everyday use. Modern e-bikes often feature smart technologies, such as integrated GPS, Bluetooth connectivity, and app-based controls, allowing riders to track their rides, navigate routes, and monitor battery life. Additionally, advancements in motor design have led to quieter, more efficient, and more powerful motors, improving the overall riding experience. Manufacturers are also focusing on improving the aesthetics and ergonomics of e-bikes, integrating the battery and motor seamlessly into the frame to create sleek and stylish designs that appeal to a wider audience.
The growth in the electric bike market is driven by several factors. Firstly, the increasing awareness of environmental issues and the need to reduce carbon footprints have prompted many consumers to seek greener transportation alternatives, with e-bikes emerging as a popular choice. Secondly, the rising costs of fuel and urban congestion are making traditional car commuting less attractive, while e-bikes offer a cost-effective and efficient solution for city travel. Thirdly, supportive government policies and incentives, such as subsidies and tax rebates for e-bike purchases, are encouraging adoption. Additionally, the COVID-19 pandemic has accelerated the shift towards personal modes of transportation, as people look for safer alternatives to public transport. The advancements in battery technology and the expanding infrastructure for cycling, including dedicated bike lanes and charging stations, are also playing a crucial role in driving the market. Advanced batteries, compact, and lightweight mid-drive motors, and chains with improved durability are trending in the e-bikes market. Personalized Pedal-assist-system (PAS) in bikes is expected to witness growth as there is no need for liability insurance for bike riders. Together, these factors create a dynamic and rapidly growing market for electric bikes, presenting significant opportunities for innovation and widespread adoption.
Select Competitors (Total 196 Featured) -
- Bajaj Auto Ltd.
- Accell Group N.V.
- Aima Technology Co., Ltd.
- Avanti Bikes
- Batavus BV
- BH Bikes
- Blaupunkt GmbH
- Blue Factory Team SLU (Mondraker)
- BMC Switzerland AG
- Brompton Bicycle Ltd.
- Cannondale Bicycle Corporation
- Canyon Bicycles GmbH
- Bike Friday
- Bird Rides, Inc.
- Ather Energy
TABLE OF CONTENTS
I. METHODOLOGY
II. EXECUTIVE SUMMARY
- 1. MARKET OVERVIEW
- Influencer Market Insights
- An Introduction to Electric Bikes
- Electric Bikes: An Emerging Segment
- Select Innovative and Creative Bikes
- Overview and Outlook
- Key Growth Drivers of the E-bike Market
- Pedal-assist: The Most Sought After Mode
- World Electric Bikes Market by Mode (2024 & 2030): Percentage Breakdown of Sales for Pedal Assist, and Throttle
- Analysis by Drive Mechanism
- World Electric Bikes Market by Drive Mechanism (2024 & 2030): Percentage Breakdown of Sales for Hub Motor, and Mid Drive
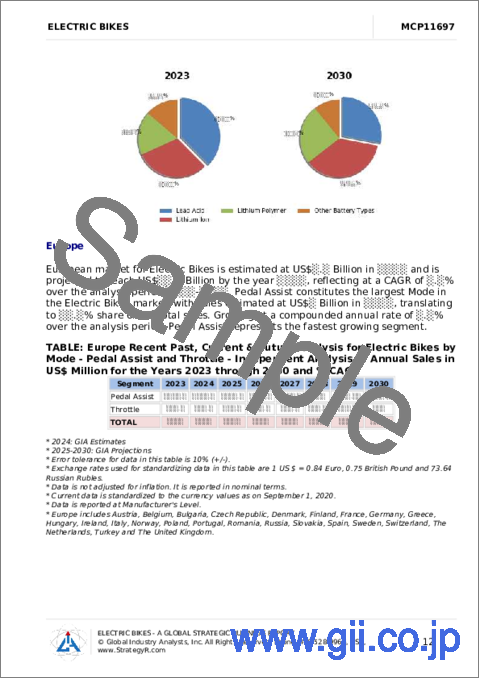
- Analysis by Battery Type: Lithium Challenges Dominance of Lead Acid
- World Electric Bikes Market by Battery Type (2024 & 2030): Percentage Breakdown of Sales for Lead Acid, Lithium Ion, Lithium Polymer, and Other Battery Types
- Regional Analysis: Asia-Pacific and Europe Lead the Market
- World Electric Bikes Market by Region (2024 & 2030): Percentage Breakdown of Sales for Developed and Developing Regions
- World Electric Bikes Market - Geographic Regions Ranked by CAGR (Sales) for 2023-2030: China, Asia-Pacific, USA, Latin America, Europe, Rest of World, Canada, and Japan
- Competitive Scenario
- Companies Benefit from Bike Sales During COVID-19 Pandemic
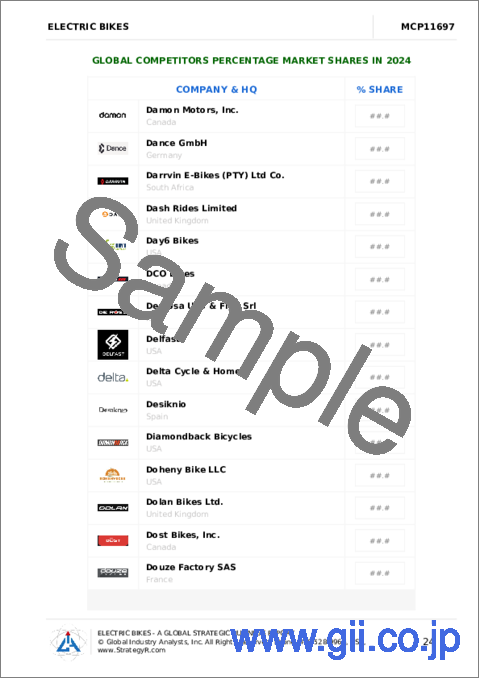
- Electric Bikes - Global Key Competitors Percentage Market Share in 2024 (E)
- Competitive Market Presence - Strong/Active/Niche/Trivial for Players Worldwide in 2024 (E)
- Recent Market Activity
- Select Global Brands
- 2. FOCUS ON SELECT PLAYERS
- 3. MARKET TRENDS & DRIVERS
- Key Trends in E-bike Market
- Demand for Electric Bicycles Gains Momentum
- Definition of E-Bicycles in Select Regions
- Demand for Sustainability to Drives Sales
- Electric Mountain Bikes Improve on Aesthetics and Functionality
- A Growing Trend of Electric Assist Bike
- E-bikes Benefiting with Increase in Urban Sprawl
- World Population (in Thousands) by Geographic Region for the Years 2019, 2030, 2050, 2100
- World Urban Population in Thousands: 1950-2050P
- Electric Bike Sales to Skyrocket with Transformation of Cities
- Smart Cities Adopt Technologies to Improve Health of Citizens
- Biker Friendly Transformation Plans Announced by Cities to Propel Market Growth
- Bike-Sharing Model: An Opportunity Knocking on the Door
- Bringing Bikes Closer to Riders
- New Technology Trends in Bicycles to Help E-Bike Industry
- Technological Transformation in the Biking Industry
- Tech Revolutions That Shaped the Modern E-biking Industry
- Innovations in Smart Bicycling
- Select Innovations and Advancements
- Challenges Confronting the Electric Biking Industry
- Challenges in E-bike Manufacturing
- E-bike Design Challenges
- Fewer Distribution Channels
- Technology Challenges
- 4. GLOBAL MARKET PERSPECTIVE
- TABLE 1: World Recent Past, Current & Future Analysis for Pedal Assist by Geographic Region - USA, Canada, Japan, China, Europe, Asia-Pacific, Latin America and Rest of World Markets - Independent Analysis of Annual Sales in US$ Million for Years 2023 through 2030 and % CAGR
- TABLE 2: World 7-Year Perspective for Pedal Assist by Geographic Region - Percentage Breakdown of Value Sales for USA, Canada, Japan, China, Europe, Asia-Pacific, Latin America and Rest of World for Years 2024 & 2030
- TABLE 3: World Recent Past, Current & Future Analysis for Throttle by Geographic Region - USA, Canada, Japan, China, Europe, Asia-Pacific, Latin America and Rest of World Markets - Independent Analysis of Annual Sales in US$ Million for Years 2023 through 2030 and % CAGR
- TABLE 4: World 7-Year Perspective for Throttle by Geographic Region - Percentage Breakdown of Value Sales for USA, Canada, Japan, China, Europe, Asia-Pacific, Latin America and Rest of World for Years 2024 & 2030
- TABLE 5: World Recent Past, Current & Future Analysis for Hub Motor by Geographic Region - USA, Canada, Japan, China, Europe, Asia-Pacific, Latin America and Rest of World Markets - Independent Analysis of Annual Sales in US$ Million for Years 2023 through 2030 and % CAGR
- TABLE 6: World 7-Year Perspective for Hub Motor by Geographic Region - Percentage Breakdown of Value Sales for USA, Canada, Japan, China, Europe, Asia-Pacific, Latin America and Rest of World for Years 2024 & 2030
- TABLE 7: World Recent Past, Current & Future Analysis for Mid Drive by Geographic Region - USA, Canada, Japan, China, Europe, Asia-Pacific, Latin America and Rest of World Markets - Independent Analysis of Annual Sales in US$ Million for Years 2023 through 2030 and % CAGR
- TABLE 8: World 7-Year Perspective for Mid Drive by Geographic Region - Percentage Breakdown of Value Sales for USA, Canada, Japan, China, Europe, Asia-Pacific, Latin America and Rest of World for Years 2024 & 2030
- TABLE 9: World Recent Past, Current & Future Analysis for Lead Acid by Geographic Region - USA, Canada, Japan, China, Europe, Asia-Pacific, Latin America and Rest of World Markets - Independent Analysis of Annual Sales in US$ Million for Years 2023 through 2030 and % CAGR
- TABLE 10: World 7-Year Perspective for Lead Acid by Geographic Region - Percentage Breakdown of Value Sales for USA, Canada, Japan, China, Europe, Asia-Pacific, Latin America and Rest of World for Years 2024 & 2030
- TABLE 11: World Recent Past, Current & Future Analysis for Lithium Ion by Geographic Region - USA, Canada, Japan, China, Europe, Asia-Pacific, Latin America and Rest of World Markets - Independent Analysis of Annual Sales in US$ Million for Years 2023 through 2030 and % CAGR
- TABLE 12: World 7-Year Perspective for Lithium Ion by Geographic Region - Percentage Breakdown of Value Sales for USA, Canada, Japan, China, Europe, Asia-Pacific, Latin America and Rest of World for Years 2024 & 2030
- TABLE 13: World Recent Past, Current & Future Analysis for Lithium Polymer by Geographic Region - USA, Canada, Japan, China, Europe, Asia-Pacific, Latin America and Rest of World Markets - Independent Analysis of Annual Sales in US$ Million for Years 2023 through 2030 and % CAGR
- TABLE 14: World 7-Year Perspective for Lithium Polymer by Geographic Region - Percentage Breakdown of Value Sales for USA, Canada, Japan, China, Europe, Asia-Pacific, Latin America and Rest of World for Years 2024 & 2030
- TABLE 15: World Recent Past, Current & Future Analysis for Other Battery Types by Geographic Region - USA, Canada, Japan, China, Europe, Asia-Pacific, Latin America and Rest of World Markets - Independent Analysis of Annual Sales in US$ Million for Years 2023 through 2030 and % CAGR
- TABLE 16: World 7-Year Perspective for Other Battery Types by Geographic Region - Percentage Breakdown of Value Sales for USA, Canada, Japan, China, Europe, Asia-Pacific, Latin America and Rest of World for Years 2024 & 2030
- TABLE 17: World Electric Bikes Market Analysis of Annual Sales in US$ Million for Years 2020 through 2030
- TABLE 18: World Recent Past, Current & Future Analysis for Electric Bikes by Geographic Region - USA, Canada, Japan, China, Europe, Asia-Pacific, Latin America and Rest of World Markets - Independent Analysis of Annual Sales in US$ Million for Years 2023 through 2030 and % CAGR
- TABLE 19: World 7-Year Perspective for Electric Bikes by Geographic Region - Percentage Breakdown of Value Sales for USA, Canada, Japan, China, Europe, Asia-Pacific, Latin America and Rest of World Markets for Years 2024 & 2030
III. MARKET ANALYSIS
- UNITED STATES
- Electric Bikes Market Presence - Strong/Active/Niche/Trivial - Key Competitors in the United States for 2024 (E)
- TABLE 20: USA Recent Past, Current & Future Analysis for Electric Bikes by Mode - Pedal Assist and Throttle - Independent Analysis of Annual Sales in US$ Million for the Years 2023 through 2030 and % CAGR
- TABLE 21: USA 7-Year Perspective for Electric Bikes by Mode - Percentage Breakdown of Value Sales for Pedal Assist and Throttle for the Years 2024 & 2030
- TABLE 22: USA Recent Past, Current & Future Analysis for Electric Bikes by Drive Mechanism - Hub Motor and Mid Drive - Independent Analysis of Annual Sales in US$ Million for the Years 2023 through 2030 and % CAGR
- TABLE 23: USA 7-Year Perspective for Electric Bikes by Drive Mechanism - Percentage Breakdown of Value Sales for Hub Motor and Mid Drive for the Years 2024 & 2030
- TABLE 24: USA Recent Past, Current & Future Analysis for Electric Bikes by Battery Type - Lead Acid, Lithium Ion, Lithium Polymer and Other Battery Types - Independent Analysis of Annual Sales in US$ Million for the Years 2023 through 2030 and % CAGR
- TABLE 25: USA 7-Year Perspective for Electric Bikes by Battery Type - Percentage Breakdown of Value Sales for Lead Acid, Lithium Ion, Lithium Polymer and Other Battery Types for the Years 2024 & 2030
- CANADA
- TABLE 26: Canada Recent Past, Current & Future Analysis for Electric Bikes by Mode - Pedal Assist and Throttle - Independent Analysis of Annual Sales in US$ Million for the Years 2023 through 2030 and % CAGR
- TABLE 27: Canada 7-Year Perspective for Electric Bikes by Mode - Percentage Breakdown of Value Sales for Pedal Assist and Throttle for the Years 2024 & 2030
- TABLE 28: Canada Recent Past, Current & Future Analysis for Electric Bikes by Drive Mechanism - Hub Motor and Mid Drive - Independent Analysis of Annual Sales in US$ Million for the Years 2023 through 2030 and % CAGR
- TABLE 29: Canada 7-Year Perspective for Electric Bikes by Drive Mechanism - Percentage Breakdown of Value Sales for Hub Motor and Mid Drive for the Years 2024 & 2030
- TABLE 30: Canada Recent Past, Current & Future Analysis for Electric Bikes by Battery Type - Lead Acid, Lithium Ion, Lithium Polymer and Other Battery Types - Independent Analysis of Annual Sales in US$ Million for the Years 2023 through 2030 and % CAGR
- TABLE 31: Canada 7-Year Perspective for Electric Bikes by Battery Type - Percentage Breakdown of Value Sales for Lead Acid, Lithium Ion, Lithium Polymer and Other Battery Types for the Years 2024 & 2030
- JAPAN
- Electric Bikes Market Presence - Strong/Active/Niche/Trivial - Key Competitors in Japan for 2024 (E)
- TABLE 32: Japan Recent Past, Current & Future Analysis for Electric Bikes by Mode - Pedal Assist and Throttle - Independent Analysis of Annual Sales in US$ Million for the Years 2023 through 2030 and % CAGR
- TABLE 33: Japan 7-Year Perspective for Electric Bikes by Mode - Percentage Breakdown of Value Sales for Pedal Assist and Throttle for the Years 2024 & 2030
- TABLE 34: Japan Recent Past, Current & Future Analysis for Electric Bikes by Drive Mechanism - Hub Motor and Mid Drive - Independent Analysis of Annual Sales in US$ Million for the Years 2023 through 2030 and % CAGR
- TABLE 35: Japan 7-Year Perspective for Electric Bikes by Drive Mechanism - Percentage Breakdown of Value Sales for Hub Motor and Mid Drive for the Years 2024 & 2030
- TABLE 36: Japan Recent Past, Current & Future Analysis for Electric Bikes by Battery Type - Lead Acid, Lithium Ion, Lithium Polymer and Other Battery Types - Independent Analysis of Annual Sales in US$ Million for the Years 2023 through 2030 and % CAGR
- TABLE 37: Japan 7-Year Perspective for Electric Bikes by Battery Type - Percentage Breakdown of Value Sales for Lead Acid, Lithium Ion, Lithium Polymer and Other Battery Types for the Years 2024 & 2030
- CHINA
- Electric Bikes Market Presence - Strong/Active/Niche/Trivial - Key Competitors in China for 2024 (E)
- TABLE 38: China Recent Past, Current & Future Analysis for Electric Bikes by Mode - Pedal Assist and Throttle - Independent Analysis of Annual Sales in US$ Million for the Years 2023 through 2030 and % CAGR
- TABLE 39: China 7-Year Perspective for Electric Bikes by Mode - Percentage Breakdown of Value Sales for Pedal Assist and Throttle for the Years 2024 & 2030
- TABLE 40: China Recent Past, Current & Future Analysis for Electric Bikes by Drive Mechanism - Hub Motor and Mid Drive - Independent Analysis of Annual Sales in US$ Million for the Years 2023 through 2030 and % CAGR
- TABLE 41: China 7-Year Perspective for Electric Bikes by Drive Mechanism - Percentage Breakdown of Value Sales for Hub Motor and Mid Drive for the Years 2024 & 2030
- TABLE 42: China Recent Past, Current & Future Analysis for Electric Bikes by Battery Type - Lead Acid, Lithium Ion, Lithium Polymer and Other Battery Types - Independent Analysis of Annual Sales in US$ Million for the Years 2023 through 2030 and % CAGR
- TABLE 43: China 7-Year Perspective for Electric Bikes by Battery Type - Percentage Breakdown of Value Sales for Lead Acid, Lithium Ion, Lithium Polymer and Other Battery Types for the Years 2024 & 2030
- EUROPE
- Electric Bikes Market Presence - Strong/Active/Niche/Trivial - Key Competitors in Europe for 2024 (E)
- TABLE 44: Europe Recent Past, Current & Future Analysis for Electric Bikes by Mode - Pedal Assist and Throttle - Independent Analysis of Annual Sales in US$ Million for the Years 2023 through 2030 and % CAGR
- TABLE 45: Europe 7-Year Perspective for Electric Bikes by Mode - Percentage Breakdown of Value Sales for Pedal Assist and Throttle for the Years 2024 & 2030
- TABLE 46: Europe Recent Past, Current & Future Analysis for Electric Bikes by Drive Mechanism - Hub Motor and Mid Drive - Independent Analysis of Annual Sales in US$ Million for the Years 2023 through 2030 and % CAGR
- TABLE 47: Europe 7-Year Perspective for Electric Bikes by Drive Mechanism - Percentage Breakdown of Value Sales for Hub Motor and Mid Drive for the Years 2024 & 2030
- TABLE 48: Europe Recent Past, Current & Future Analysis for Electric Bikes by Battery Type - Lead Acid, Lithium Ion, Lithium Polymer and Other Battery Types - Independent Analysis of Annual Sales in US$ Million for the Years 2023 through 2030 and % CAGR
- TABLE 49: Europe 7-Year Perspective for Electric Bikes by Battery Type - Percentage Breakdown of Value Sales for Lead Acid, Lithium Ion, Lithium Polymer and Other Battery Types for the Years 2024 & 2030
- TABLE 50: Europe Recent Past, Current & Future Analysis for Electric Bikes by Geographic Region - France, Germany, Italy, UK, Belgium, Netherlands and Rest of Europe Markets - Independent Analysis of Annual Sales in US$ Million for Years 2023 through 2030 and % CAGR
- TABLE 51: Europe 7-Year Perspective for Electric Bikes by Geographic Region - Percentage Breakdown of Value Sales for France, Germany, Italy, UK, Belgium, Netherlands and Rest of Europe Markets for Years 2024 & 2030
- FRANCE
- Electric Bikes Market Presence - Strong/Active/Niche/Trivial - Key Competitors in France for 2024 (E)
- TABLE 52: France Recent Past, Current & Future Analysis for Electric Bikes by Mode - Pedal Assist and Throttle - Independent Analysis of Annual Sales in US$ Million for the Years 2023 through 2030 and % CAGR
- TABLE 53: France 7-Year Perspective for Electric Bikes by Mode - Percentage Breakdown of Value Sales for Pedal Assist and Throttle for the Years 2024 & 2030
- TABLE 54: France Recent Past, Current & Future Analysis for Electric Bikes by Drive Mechanism - Hub Motor and Mid Drive - Independent Analysis of Annual Sales in US$ Million for the Years 2023 through 2030 and % CAGR
- TABLE 55: France 7-Year Perspective for Electric Bikes by Drive Mechanism - Percentage Breakdown of Value Sales for Hub Motor and Mid Drive for the Years 2024 & 2030
- TABLE 56: France Recent Past, Current & Future Analysis for Electric Bikes by Battery Type - Lead Acid, Lithium Ion, Lithium Polymer and Other Battery Types - Independent Analysis of Annual Sales in US$ Million for the Years 2023 through 2030 and % CAGR
- TABLE 57: France 7-Year Perspective for Electric Bikes by Battery Type - Percentage Breakdown of Value Sales for Lead Acid, Lithium Ion, Lithium Polymer and Other Battery Types for the Years 2024 & 2030
- GERMANY
- Electric Bikes Market Presence - Strong/Active/Niche/Trivial - Key Competitors in Germany for 2024 (E)
- TABLE 58: Germany Recent Past, Current & Future Analysis for Electric Bikes by Mode - Pedal Assist and Throttle - Independent Analysis of Annual Sales in US$ Million for the Years 2023 through 2030 and % CAGR
- TABLE 59: Germany 7-Year Perspective for Electric Bikes by Mode - Percentage Breakdown of Value Sales for Pedal Assist and Throttle for the Years 2024 & 2030
- TABLE 60: Germany Recent Past, Current & Future Analysis for Electric Bikes by Drive Mechanism - Hub Motor and Mid Drive - Independent Analysis of Annual Sales in US$ Million for the Years 2023 through 2030 and % CAGR
- TABLE 61: Germany 7-Year Perspective for Electric Bikes by Drive Mechanism - Percentage Breakdown of Value Sales for Hub Motor and Mid Drive for the Years 2024 & 2030
- TABLE 62: Germany Recent Past, Current & Future Analysis for Electric Bikes by Battery Type - Lead Acid, Lithium Ion, Lithium Polymer and Other Battery Types - Independent Analysis of Annual Sales in US$ Million for the Years 2023 through 2030 and % CAGR
- TABLE 63: Germany 7-Year Perspective for Electric Bikes by Battery Type - Percentage Breakdown of Value Sales for Lead Acid, Lithium Ion, Lithium Polymer and Other Battery Types for the Years 2024 & 2030
- ITALY
- TABLE 64: Italy Recent Past, Current & Future Analysis for Electric Bikes by Mode - Pedal Assist and Throttle - Independent Analysis of Annual Sales in US$ Million for the Years 2023 through 2030 and % CAGR
- TABLE 65: Italy 7-Year Perspective for Electric Bikes by Mode - Percentage Breakdown of Value Sales for Pedal Assist and Throttle for the Years 2024 & 2030
- TABLE 66: Italy Recent Past, Current & Future Analysis for Electric Bikes by Drive Mechanism - Hub Motor and Mid Drive - Independent Analysis of Annual Sales in US$ Million for the Years 2023 through 2030 and % CAGR
- TABLE 67: Italy 7-Year Perspective for Electric Bikes by Drive Mechanism - Percentage Breakdown of Value Sales for Hub Motor and Mid Drive for the Years 2024 & 2030
- TABLE 68: Italy Recent Past, Current & Future Analysis for Electric Bikes by Battery Type - Lead Acid, Lithium Ion, Lithium Polymer and Other Battery Types - Independent Analysis of Annual Sales in US$ Million for the Years 2023 through 2030 and % CAGR
- TABLE 69: Italy 7-Year Perspective for Electric Bikes by Battery Type - Percentage Breakdown of Value Sales for Lead Acid, Lithium Ion, Lithium Polymer and Other Battery Types for the Years 2024 & 2030
- UNITED KINGDOM
- Electric Bikes Market Presence - Strong/Active/Niche/Trivial - Key Competitors in the United Kingdom for 2024 (E)
- TABLE 70: UK Recent Past, Current & Future Analysis for Electric Bikes by Mode - Pedal Assist and Throttle - Independent Analysis of Annual Sales in US$ Million for the Years 2023 through 2030 and % CAGR
- TABLE 71: UK 7-Year Perspective for Electric Bikes by Mode - Percentage Breakdown of Value Sales for Pedal Assist and Throttle for the Years 2024 & 2030
- TABLE 72: UK Recent Past, Current & Future Analysis for Electric Bikes by Drive Mechanism - Hub Motor and Mid Drive - Independent Analysis of Annual Sales in US$ Million for the Years 2023 through 2030 and % CAGR
- TABLE 73: UK 7-Year Perspective for Electric Bikes by Drive Mechanism - Percentage Breakdown of Value Sales for Hub Motor and Mid Drive for the Years 2024 & 2030
- TABLE 74: UK Recent Past, Current & Future Analysis for Electric Bikes by Battery Type - Lead Acid, Lithium Ion, Lithium Polymer and Other Battery Types - Independent Analysis of Annual Sales in US$ Million for the Years 2023 through 2030 and % CAGR
- TABLE 75: UK 7-Year Perspective for Electric Bikes by Battery Type - Percentage Breakdown of Value Sales for Lead Acid, Lithium Ion, Lithium Polymer and Other Battery Types for the Years 2024 & 2030
- BELGIUM
- TABLE 76: Belgium Recent Past, Current & Future Analysis for Electric Bikes by Mode - Pedal Assist and Throttle - Independent Analysis of Annual Sales in US$ Million for the Years 2023 through 2030 and % CAGR
- TABLE 77: Belgium 7-Year Perspective for Electric Bikes by Mode - Percentage Breakdown of Value Sales for Pedal Assist and Throttle for the Years 2024 & 2030
- TABLE 78: Belgium Recent Past, Current & Future Analysis for Electric Bikes by Drive Mechanism - Hub Motor and Mid Drive - Independent Analysis of Annual Sales in US$ Million for the Years 2023 through 2030 and % CAGR
- TABLE 79: Belgium 7-Year Perspective for Electric Bikes by Drive Mechanism - Percentage Breakdown of Value Sales for Hub Motor and Mid Drive for the Years 2024 & 2030
- TABLE 80: Belgium Recent Past, Current & Future Analysis for Electric Bikes by Battery Type - Lead Acid, Lithium Ion, Lithium Polymer and Other Battery Types - Independent Analysis of Annual Sales in US$ Million for the Years 2023 through 2030 and % CAGR
- TABLE 81: Belgium 7-Year Perspective for Electric Bikes by Battery Type - Percentage Breakdown of Value Sales for Lead Acid, Lithium Ion, Lithium Polymer and Other Battery Types for the Years 2024 & 2030
- NETHERLANDS
- TABLE 82: Netherlands Recent Past, Current & Future Analysis for Electric Bikes by Mode - Pedal Assist and Throttle - Independent Analysis of Annual Sales in US$ Million for the Years 2023 through 2030 and % CAGR
- TABLE 83: Netherlands 7-Year Perspective for Electric Bikes by Mode - Percentage Breakdown of Value Sales for Pedal Assist and Throttle for the Years 2024 & 2030
- TABLE 84: Netherlands Recent Past, Current & Future Analysis for Electric Bikes by Drive Mechanism - Hub Motor and Mid Drive - Independent Analysis of Annual Sales in US$ Million for the Years 2023 through 2030 and % CAGR
- TABLE 85: Netherlands 7-Year Perspective for Electric Bikes by Drive Mechanism - Percentage Breakdown of Value Sales for Hub Motor and Mid Drive for the Years 2024 & 2030
- TABLE 86: Netherlands Recent Past, Current & Future Analysis for Electric Bikes by Battery Type - Lead Acid, Lithium Ion, Lithium Polymer and Other Battery Types - Independent Analysis of Annual Sales in US$ Million for the Years 2023 through 2030 and % CAGR
- TABLE 87: Netherlands 7-Year Perspective for Electric Bikes by Battery Type - Percentage Breakdown of Value Sales for Lead Acid, Lithium Ion, Lithium Polymer and Other Battery Types for the Years 2024 & 2030
- REST OF EUROPE
- TABLE 88: Rest of Europe Recent Past, Current & Future Analysis for Electric Bikes by Mode - Pedal Assist and Throttle - Independent Analysis of Annual Sales in US$ Million for the Years 2023 through 2030 and % CAGR
- TABLE 89: Rest of Europe 7-Year Perspective for Electric Bikes by Mode - Percentage Breakdown of Value Sales for Pedal Assist and Throttle for the Years 2024 & 2030
- TABLE 90: Rest of Europe Recent Past, Current & Future Analysis for Electric Bikes by Drive Mechanism - Hub Motor and Mid Drive - Independent Analysis of Annual Sales in US$ Million for the Years 2023 through 2030 and % CAGR
- TABLE 91: Rest of Europe 7-Year Perspective for Electric Bikes by Drive Mechanism - Percentage Breakdown of Value Sales for Hub Motor and Mid Drive for the Years 2024 & 2030
- TABLE 92: Rest of Europe Recent Past, Current & Future Analysis for Electric Bikes by Battery Type - Lead Acid, Lithium Ion, Lithium Polymer and Other Battery Types - Independent Analysis of Annual Sales in US$ Million for the Years 2023 through 2030 and % CAGR
- TABLE 93: Rest of Europe 7-Year Perspective for Electric Bikes by Battery Type - Percentage Breakdown of Value Sales for Lead Acid, Lithium Ion, Lithium Polymer and Other Battery Types for the Years 2024 & 2030
- ASIA-PACIFIC
- Electric Bikes Market Presence - Strong/Active/Niche/Trivial - Key Competitors in Asia-Pacific for 2024 (E)
- TABLE 94: Asia-Pacific Recent Past, Current & Future Analysis for Electric Bikes by Mode - Pedal Assist and Throttle - Independent Analysis of Annual Sales in US$ Million for the Years 2023 through 2030 and % CAGR
- TABLE 95: Asia-Pacific 7-Year Perspective for Electric Bikes by Mode - Percentage Breakdown of Value Sales for Pedal Assist and Throttle for the Years 2024 & 2030
- TABLE 96: Asia-Pacific Recent Past, Current & Future Analysis for Electric Bikes by Drive Mechanism - Hub Motor and Mid Drive - Independent Analysis of Annual Sales in US$ Million for the Years 2023 through 2030 and % CAGR
- TABLE 97: Asia-Pacific 7-Year Perspective for Electric Bikes by Drive Mechanism - Percentage Breakdown of Value Sales for Hub Motor and Mid Drive for the Years 2024 & 2030
- TABLE 98: Asia-Pacific Recent Past, Current & Future Analysis for Electric Bikes by Battery Type - Lead Acid, Lithium Ion, Lithium Polymer and Other Battery Types - Independent Analysis of Annual Sales in US$ Million for the Years 2023 through 2030 and % CAGR
- TABLE 99: Asia-Pacific 7-Year Perspective for Electric Bikes by Battery Type - Percentage Breakdown of Value Sales for Lead Acid, Lithium Ion, Lithium Polymer and Other Battery Types for the Years 2024 & 2030
- LATIN AMERICA
- Electric Bikes Market Presence - Strong/Active/Niche/Trivial - Key Competitors in Latin America for 2024 (E)
- TABLE 100: Latin America Recent Past, Current & Future Analysis for Electric Bikes by Mode - Pedal Assist and Throttle - Independent Analysis of Annual Sales in US$ Million for the Years 2023 through 2030 and % CAGR
- TABLE 101: Latin America 7-Year Perspective for Electric Bikes by Mode - Percentage Breakdown of Value Sales for Pedal Assist and Throttle for the Years 2024 & 2030
- TABLE 102: Latin America Recent Past, Current & Future Analysis for Electric Bikes by Drive Mechanism - Hub Motor and Mid Drive - Independent Analysis of Annual Sales in US$ Million for the Years 2023 through 2030 and % CAGR
- TABLE 103: Latin America 7-Year Perspective for Electric Bikes by Drive Mechanism - Percentage Breakdown of Value Sales for Hub Motor and Mid Drive for the Years 2024 & 2030
- TABLE 104: Latin America Recent Past, Current & Future Analysis for Electric Bikes by Battery Type - Lead Acid, Lithium Ion, Lithium Polymer and Other Battery Types - Independent Analysis of Annual Sales in US$ Million for the Years 2023 through 2030 and % CAGR
- TABLE 105: Latin America 7-Year Perspective for Electric Bikes by Battery Type - Percentage Breakdown of Value Sales for Lead Acid, Lithium Ion, Lithium Polymer and Other Battery Types for the Years 2024 & 2030
- REST OF WORLD
- TABLE 106: Rest of World Recent Past, Current & Future Analysis for Electric Bikes by Mode - Pedal Assist and Throttle - Independent Analysis of Annual Sales in US$ Million for the Years 2023 through 2030 and % CAGR
- TABLE 107: Rest of World 7-Year Perspective for Electric Bikes by Mode - Percentage Breakdown of Value Sales for Pedal Assist and Throttle for the Years 2024 & 2030
- TABLE 108: Rest of World Recent Past, Current & Future Analysis for Electric Bikes by Drive Mechanism - Hub Motor and Mid Drive - Independent Analysis of Annual Sales in US$ Million for the Years 2023 through 2030 and % CAGR
- TABLE 109: Rest of World 7-Year Perspective for Electric Bikes by Drive Mechanism - Percentage Breakdown of Value Sales for Hub Motor and Mid Drive for the Years 2024 & 2030
- TABLE 110: Rest of World Recent Past, Current & Future Analysis for Electric Bikes by Battery Type - Lead Acid, Lithium Ion, Lithium Polymer and Other Battery Types - Independent Analysis of Annual Sales in US$ Million for the Years 2023 through 2030 and % CAGR
- TABLE 111: Rest of World 7-Year Perspective for Electric Bikes by Battery Type - Percentage Breakdown of Value Sales for Lead Acid, Lithium Ion, Lithium Polymer and Other Battery Types for the Years 2024 & 2030
