|
|
市場調査レポート
商品コード
1655337
物流オートメーションの世界市場Logistics Automation |
||||||
|
|||||||
適宜更新あり
|
|||||||

| 物流オートメーションの世界市場 |
|
出版日: 2025年02月14日
発行: Market Glass, Inc. (Formerly Global Industry Analysts, Inc.)
ページ情報: 英文 273 Pages
納期: 即日から翌営業日
|

全表示
- 概要
- 目次
物流オートメーションの世界市場は2030年までに1,577億米ドルに到達
2024年に929億米ドルと推定される物流オートメーションの世界市場は、2024年から2030年にかけてCAGR 9.2%で成長し、2030年には1,577億米ドルに達すると予測されます。本レポートで分析したセグメントの1つであるハードウェア統合システムは、CAGR 8.4%を記録し、分析期間終了時には801億米ドルに達すると予測されます。物流オートメーションソフトウェア分野の成長率は、分析期間中CAGR 9.6%と推定されます。
米国市場は261億米ドル、中国はCAGR 8.6%で成長すると予測
米国の物流オートメーション市場は、2024年に261億米ドルと推定されます。世界第2位の経済大国である中国は、2030年までに241億米ドルの市場規模に達すると予測され、分析期間2024-2030年のCAGRは8.6%です。その他の注目すべき地域別市場としては、日本とカナダがあり、分析期間中のCAGRはそれぞれ8.4%と7.4%と予測されています。欧州では、ドイツがCAGR 7.7%で成長すると予測されています。
世界の物流オートメーション市場- 主要動向と促進要因のまとめ
物流オートメーションを変革するイノベーションとは?
物流オートメーションは、オペレーションを合理化し、効率を高める最先端テクノロジーによって変革を経験しています。この変革の中心となっているのが、倉庫や配送センターで導入が進んでいるロボットや自動保管・検索システム(AS/RS)です。これらのロボットシステムは、人件費を削減するだけでなく、ピッキングや梱包などの作業の精度とスピードを向上させています。さらに、モノのインターネット(IoT)技術の統合により、サプライチェーン内の機器が通信できるようになり、リアルタイムの追跡や在庫管理が可能になった。この接続性により、情報や資材のスムーズな流れが確保され、ダウンタイムが大幅に削減され、市場の需要への対応力が強化されます。
eコマースの急増は物流オートメーションにどう影響するか?
eコマースのかつてない成長により、ロジスティクス・システムには、より迅速かつ効率的に商品を届けるという大きなプレッシャーがかかっています。この急成長は、迅速な配送に対する消費者の期待に応えようとする企業の努力により、物流分野における自動化技術の採用を促進しています。例えば、自動仕分けシステムやドローンは、配送プロセスを迅速化し、稼働時間を延長する能力を持っているため、ますます人気が高まっています。eコマースが成長を続ける中、物流オートメーションは注文の量と頻度の増加に対応し、オペレーションのスケーラビリティをサポートするために不可欠なものとなっています。
データ分析が物流オートメーションの最適化に果たす役割とは?
データ解析は物流オートメーションにとってますます不可欠なものとなっており、よりスマートな意思決定と業務効率を促進するインサイトを提供します。大規模なデータセットの分析を通じて、ロジスティクス企業はルートの最適化、メンテナンスの予測、リソースの効率的な管理を行うことができます。特に予測分析は、需要パターンの予測において極めて重要な役割を果たし、在庫管理とプランニングに役立ちます。企業がより多くのデータを生成し活用し続けるにつれて、物流オートメーションにおけるアナリティクスの役割は拡大する一方であり、ロジスティクス部門の進化において重要な要素となっています。
物流オートメーション市場の成長は複数の要因によってもたらされる
物流オートメーション市場の成長は、eコマースの台頭、より迅速で効率的なロジスティクス業務の必要性、ロボット工学やデータ解析の技術進歩など、いくつかの要因によって牽引されています。さらに、環境問題への関心も、エネルギー効率を改善し、廃棄物を削減するグリーンオートメーション技術の採用を企業に促しています。世界の企業がデジタルトランスフォーメーションを採用し続ける中、複雑化する業務と消費者の需要をサポートできる自動化物流ソリューションへの需要が急増し、このダイナミックな市場の堅調な成長が見込まれます。
セグメント
提供(ハードウェア統合システム、ソフトウェア、サービス);機能(倉庫・保管管理、輸送管理);組織規模(大企業、中小企業);業種(製造業、ヘルスケア・医薬品、FMCG、小売・eコマース、石油・ガス・エネルギー、化学、その他業種)
調査対象企業の例(全41件)
- A.Technics Engineering
- AppLiaison Inc.
- Applied Data Consultants, Inc.(ADC)
- ARSinform S.r.l.
- Beauparc Utilities Limited
- BLG Logistics Group AG & Co. AG
- Challenger Motor Freight, Inc.
- Cogistics, Inc.
- Digital Applications International(DAI)Limited
- DP World Group
目次
第1章 調査手法
第2章 エグゼクティブサマリー
- 市場概要
- 主要企業
- 市場動向と促進要因
- 世界市場の見通し
第3章 市場分析
- 米国
- カナダ
- 日本
- 中国
- 欧州
- フランス
- ドイツ
- イタリア
- 英国
- その他欧州
- アジア太平洋
- その他の地域
第4章 競合
Global Logistics Automation Market to Reach US$157.7 Billion by 2030
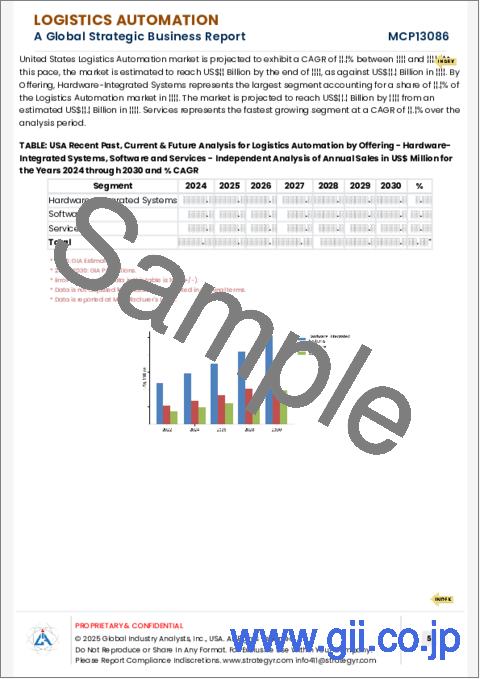
The global market for Logistics Automation estimated at US$92.9 Billion in the year 2024, is expected to reach US$157.7 Billion by 2030, growing at a CAGR of 9.2% over the analysis period 2024-2030. Hardware-Integrated Systems, one of the segments analyzed in the report, is expected to record a 8.4% CAGR and reach US$80.1 Billion by the end of the analysis period. Growth in the Logistics Automation Software segment is estimated at 9.6% CAGR over the analysis period.
The U.S. Market is Estimated at US$26.1 Billion While China is Forecast to Grow at 8.6% CAGR
The Logistics Automation market in the U.S. is estimated at US$26.1 Billion in the year 2024. China, the world's second largest economy, is forecast to reach a projected market size of US$24.1 Billion by the year 2030 trailing a CAGR of 8.6% over the analysis period 2024-2030. Among the other noteworthy geographic markets are Japan and Canada, each forecast to grow at a CAGR of 8.4% and 7.4% respectively over the analysis period. Within Europe, Germany is forecast to grow at approximately 7.7% CAGR.
Global Logistics Automation Market - Key Trends & Drivers Summarized
What Innovations Are Transforming Logistics Automation?
Logistics automation is experiencing a transformation driven by cutting-edge technologies that streamline operations and enhance efficiency. Central to this transformation are robotics and automated storage and retrieval systems (AS/RS) which are increasingly being implemented in warehouses and distribution centers. These robotic systems are not only reducing labor costs but are also improving the precision and speed of tasks such as picking and packing. Moreover, the integration of Internet of Things (IoT) technology enables devices within the supply chain to communicate, providing real-time tracking and inventory management. This connectivity ensures a smoother flow of information and materials, significantly reducing downtime and enhancing responsiveness to market demands.
How Does the Surge in E-Commerce Influence Logistics Automation?
The unprecedented growth of e-commerce has placed immense pressure on logistics systems to deliver goods more quickly and efficiently. This surge is driving the adoption of automation technologies in the logistics sector as companies strive to meet consumer expectations for rapid delivery. Automated sorting systems and drones, for instance, are becoming increasingly popular for their ability to expedite the delivery process and extend operational hours. As e-commerce continues to grow, logistics automation becomes essential in handling the increased volume and frequency of orders, thus supporting the scalability of operations.
What Role Does Data Analytics Play in Optimizing Logistics Automation?
Data analytics is becoming increasingly integral to logistics automation, providing insights that drive smarter decision-making and operational efficiency. Through the analysis of large datasets, logistics companies can optimize routes, predict maintenance, and manage resources more effectively. Predictive analytics, in particular, plays a pivotal role in forecasting demand patterns, which helps in inventory management and planning. As companies continue to generate and harness more data, the role of analytics in logistics automation will only expand, making it a critical component in the evolution of the logistics sector.
Growth in the Logistics Automation Market Is Driven by Several Factors
The growth in the logistics automation market is driven by several factors, including the rise of e-commerce, the need for faster and more efficient logistics operations, and the technological advancements in robotics and data analytics. Moreover, environmental concerns are also propelling companies to adopt green automation technologies that improve energy efficiency and reduce waste. As businesses globally continue to embrace digital transformation, the demand for automated logistics solutions that can support increased operational complexity and consumer demands is expected to surge, ensuring robust growth in this dynamic market.
SCOPE OF STUDY:
The report analyzes the Logistics Automation market in terms of units by the following Segments, and Geographic Regions/Countries:
Segments:
Offering (Hardware-Integrated Systems, Software, Services); Function (Warehouse & Storage Management, Transportation Management); Organization Size (Large Enterprises, SMEs); Vertical (Manufacturing, Healthcare & Pharmaceutical, FMCG, Retail & eCommerce, Oil, Gas & Energy, Chemicals, Other Verticals)
Geographic Regions/Countries:
World; United States; Canada; Japan; China; Europe (France; Germany; Italy; United Kingdom; and Rest of Europe); Asia-Pacific; Rest of World.
Select Competitors (Total 41 Featured) -
- A.Technics Engineering
- AppLiaison Inc.
- Applied Data Consultants, Inc. (ADC)
- ARSinform S.r.l.
- Beauparc Utilities Limited
- BLG Logistics Group AG & Co. AG
- Challenger Motor Freight, Inc.
- Cogistics, Inc.
- Digital Applications International (DAI) Limited
- DP World Group
TABLE OF CONTENTS
I. METHODOLOGY
II. EXECUTIVE SUMMARY
- 1. MARKET OVERVIEW
- Influencer Market Insights
- World Market Trajectories
- Global Economic Update
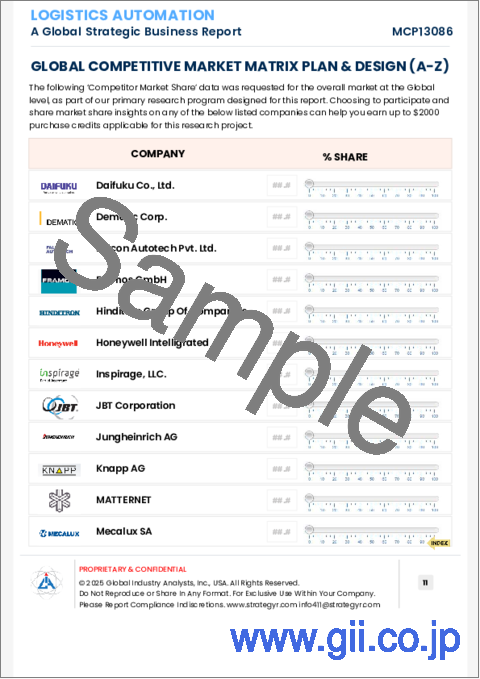
- Logistics Automation - Global Key Competitors Percentage Market Share in 2025 (E)
- Competitive Market Presence - Strong/Active/Niche/Trivial for Players Worldwide in 2025 (E)
- 2. FOCUS ON SELECT PLAYERS
- 3. MARKET TRENDS & DRIVERS
- Sustainable Production Methods Drive Demand for Bio-based Long Chain Dicarboxylic Acids
- Growing Use in Nylon & Other Polyamides Spurs Market Growth
- Expansion of Electric Vehicle Market Accelerates Use in Battery Technologies
- Bio-lubricants Market Growth Propels Demand for Synthetic Esters
- Advancements in Powder Coatings Technology Boost Dicarboxylic Acid Adoption
- Pharmaceutical Applications Strengthen Market Opportunities for Purified Acids
- Rising Demand for Biodegradable Plastics Influences Market Dynamics
- Increased Research in Corrosion Inhibitors Opens New Market Avenues
- Enhanced Oil Recovery Techniques Sustain Demand for Specialty Acids
- Global Shifts in Cosmetic Ingredient Sourcing Expands Use in Personal Care Products
- Innovations in High-Performance Lubricants Create New Opportunities
- 4. GLOBAL MARKET PERSPECTIVE
- TABLE 1: World Recent Past, Current & Future Analysis for Large Enterprises by Geographic Region - USA, Canada, Japan, China, Europe, Asia-Pacific and Rest of World Markets - Independent Analysis of Annual Sales in US$ Million for Years 2024 through 2030 and % CAGR
- TABLE 2: World 6-Year Perspective for Large Enterprises by Geographic Region - Percentage Breakdown of Value Sales for USA, Canada, Japan, China, Europe, Asia-Pacific and Rest of World for Years 2025 & 2030
- TABLE 3: World Recent Past, Current & Future Analysis for SMEs by Geographic Region - USA, Canada, Japan, China, Europe, Asia-Pacific and Rest of World Markets - Independent Analysis of Annual Sales in US$ Million for Years 2024 through 2030 and % CAGR
- TABLE 4: World 6-Year Perspective for SMEs by Geographic Region - Percentage Breakdown of Value Sales for USA, Canada, Japan, China, Europe, Asia-Pacific and Rest of World for Years 2025 & 2030
- TABLE 5: World Logistics Automation Market Analysis of Annual Sales in US$ Million for Years 2015 through 2030
- TABLE 6: World Recent Past, Current & Future Analysis for Logistics Automation by Geographic Region - USA, Canada, Japan, China, Europe, Asia-Pacific and Rest of World Markets - Independent Analysis of Annual Sales in US$ Million for Years 2024 through 2030 and % CAGR
- TABLE 7: World 6-Year Perspective for Logistics Automation by Geographic Region - Percentage Breakdown of Value Sales for USA, Canada, Japan, China, Europe, Asia-Pacific and Rest of World Markets for Years 2025 & 2030
- TABLE 8: World Recent Past, Current & Future Analysis for Hardware-Integrated Systems by Geographic Region - USA, Canada, Japan, China, Europe, Asia-Pacific and Rest of World Markets - Independent Analysis of Annual Sales in US$ Million for Years 2024 through 2030 and % CAGR
- TABLE 9: World 6-Year Perspective for Hardware-Integrated Systems by Geographic Region - Percentage Breakdown of Value Sales for USA, Canada, Japan, China, Europe, Asia-Pacific and Rest of World for Years 2025 & 2030
- TABLE 10: World Recent Past, Current & Future Analysis for Software by Geographic Region - USA, Canada, Japan, China, Europe, Asia-Pacific and Rest of World Markets - Independent Analysis of Annual Sales in US$ Million for Years 2024 through 2030 and % CAGR
- TABLE 11: World 6-Year Perspective for Software by Geographic Region - Percentage Breakdown of Value Sales for USA, Canada, Japan, China, Europe, Asia-Pacific and Rest of World for Years 2025 & 2030
- TABLE 12: World Recent Past, Current & Future Analysis for Services by Geographic Region - USA, Canada, Japan, China, Europe, Asia-Pacific and Rest of World Markets - Independent Analysis of Annual Sales in US$ Million for Years 2024 through 2030 and % CAGR
- TABLE 13: World 6-Year Perspective for Services by Geographic Region - Percentage Breakdown of Value Sales for USA, Canada, Japan, China, Europe, Asia-Pacific and Rest of World for Years 2025 & 2030
- TABLE 14: World Recent Past, Current & Future Analysis for Warehouse & Storage Management by Geographic Region - USA, Canada, Japan, China, Europe, Asia-Pacific and Rest of World Markets - Independent Analysis of Annual Sales in US$ Million for Years 2024 through 2030 and % CAGR
- TABLE 15: World 6-Year Perspective for Warehouse & Storage Management by Geographic Region - Percentage Breakdown of Value Sales for USA, Canada, Japan, China, Europe, Asia-Pacific and Rest of World for Years 2025 & 2030
- TABLE 16: World Recent Past, Current & Future Analysis for Transportation Management by Geographic Region - USA, Canada, Japan, China, Europe, Asia-Pacific and Rest of World Markets - Independent Analysis of Annual Sales in US$ Million for Years 2024 through 2030 and % CAGR
- TABLE 17: World 6-Year Perspective for Transportation Management by Geographic Region - Percentage Breakdown of Value Sales for USA, Canada, Japan, China, Europe, Asia-Pacific and Rest of World for Years 2025 & 2030
- TABLE 18: World Recent Past, Current & Future Analysis for Manufacturing by Geographic Region - USA, Canada, Japan, China, Europe, Asia-Pacific and Rest of World Markets - Independent Analysis of Annual Sales in US$ Million for Years 2024 through 2030 and % CAGR
- TABLE 19: World 6-Year Perspective for Manufacturing by Geographic Region - Percentage Breakdown of Value Sales for USA, Canada, Japan, China, Europe, Asia-Pacific and Rest of World for Years 2025 & 2030
- TABLE 20: World Recent Past, Current & Future Analysis for Healthcare & Pharmaceutical by Geographic Region - USA, Canada, Japan, China, Europe, Asia-Pacific and Rest of World Markets - Independent Analysis of Annual Sales in US$ Million for Years 2024 through 2030 and % CAGR
- TABLE 21: World 6-Year Perspective for Healthcare & Pharmaceutical by Geographic Region - Percentage Breakdown of Value Sales for USA, Canada, Japan, China, Europe, Asia-Pacific and Rest of World for Years 2025 & 2030
- TABLE 22: World Recent Past, Current & Future Analysis for FMCG by Geographic Region - USA, Canada, Japan, China, Europe, Asia-Pacific and Rest of World Markets - Independent Analysis of Annual Sales in US$ Million for Years 2024 through 2030 and % CAGR
- TABLE 23: World 6-Year Perspective for FMCG by Geographic Region - Percentage Breakdown of Value Sales for USA, Canada, Japan, China, Europe, Asia-Pacific and Rest of World for Years 2025 & 2030
- TABLE 24: World Recent Past, Current & Future Analysis for Retail & eCommerce by Geographic Region - USA, Canada, Japan, China, Europe, Asia-Pacific and Rest of World Markets - Independent Analysis of Annual Sales in US$ Million for Years 2024 through 2030 and % CAGR
- TABLE 25: World 6-Year Perspective for Retail & eCommerce by Geographic Region - Percentage Breakdown of Value Sales for USA, Canada, Japan, China, Europe, Asia-Pacific and Rest of World for Years 2025 & 2030
- TABLE 26: World Recent Past, Current & Future Analysis for Oil, Gas & Energy by Geographic Region - USA, Canada, Japan, China, Europe, Asia-Pacific and Rest of World Markets - Independent Analysis of Annual Sales in US$ Million for Years 2024 through 2030 and % CAGR
- TABLE 27: World 6-Year Perspective for Oil, Gas & Energy by Geographic Region - Percentage Breakdown of Value Sales for USA, Canada, Japan, China, Europe, Asia-Pacific and Rest of World for Years 2025 & 2030
- TABLE 28: World Recent Past, Current & Future Analysis for Chemicals by Geographic Region - USA, Canada, Japan, China, Europe, Asia-Pacific and Rest of World Markets - Independent Analysis of Annual Sales in US$ Million for Years 2024 through 2030 and % CAGR
- TABLE 29: World 6-Year Perspective for Chemicals by Geographic Region - Percentage Breakdown of Value Sales for USA, Canada, Japan, China, Europe, Asia-Pacific and Rest of World for Years 2025 & 2030
- TABLE 30: World Recent Past, Current & Future Analysis for Other Verticals by Geographic Region - USA, Canada, Japan, China, Europe, Asia-Pacific and Rest of World Markets - Independent Analysis of Annual Sales in US$ Million for Years 2024 through 2030 and % CAGR
- TABLE 31: World 6-Year Perspective for Other Verticals by Geographic Region - Percentage Breakdown of Value Sales for USA, Canada, Japan, China, Europe, Asia-Pacific and Rest of World for Years 2025 & 2030
III. MARKET ANALYSIS
- UNITED STATES
- Logistics Automation Market Presence - Strong/Active/Niche/Trivial - Key Competitors in the United States for 2025 (E)
- TABLE 32: USA Recent Past, Current & Future Analysis for Logistics Automation by Organization Size - Large Enterprises and SMEs - Independent Analysis of Annual Sales in US$ Million for the Years 2024 through 2030 and % CAGR
- TABLE 33: USA 6-Year Perspective for Logistics Automation by Organization Size - Percentage Breakdown of Value Sales for Large Enterprises and SMEs for the Years 2025 & 2030
- TABLE 34: USA Recent Past, Current & Future Analysis for Logistics Automation by Offering - Hardware-Integrated Systems, Software and Services - Independent Analysis of Annual Sales in US$ Million for the Years 2024 through 2030 and % CAGR
- TABLE 35: USA 6-Year Perspective for Logistics Automation by Offering - Percentage Breakdown of Value Sales for Hardware-Integrated Systems, Software and Services for the Years 2025 & 2030
- TABLE 36: USA Recent Past, Current & Future Analysis for Logistics Automation by Function - Warehouse & Storage Management and Transportation Management - Independent Analysis of Annual Sales in US$ Million for the Years 2024 through 2030 and % CAGR
- TABLE 37: USA 6-Year Perspective for Logistics Automation by Function - Percentage Breakdown of Value Sales for Warehouse & Storage Management and Transportation Management for the Years 2025 & 2030
- TABLE 38: USA Recent Past, Current & Future Analysis for Logistics Automation by Vertical - Manufacturing, Healthcare & Pharmaceutical, FMCG, Retail & eCommerce, Oil, Gas & Energy, Chemicals and Other Verticals - Independent Analysis of Annual Sales in US$ Million for the Years 2024 through 2030 and % CAGR
- TABLE 39: USA 6-Year Perspective for Logistics Automation by Vertical - Percentage Breakdown of Value Sales for Manufacturing, Healthcare & Pharmaceutical, FMCG, Retail & eCommerce, Oil, Gas & Energy, Chemicals and Other Verticals for the Years 2025 & 2030
- CANADA
- TABLE 40: Canada Recent Past, Current & Future Analysis for Logistics Automation by Organization Size - Large Enterprises and SMEs - Independent Analysis of Annual Sales in US$ Million for the Years 2024 through 2030 and % CAGR
- TABLE 41: Canada 6-Year Perspective for Logistics Automation by Organization Size - Percentage Breakdown of Value Sales for Large Enterprises and SMEs for the Years 2025 & 2030
- TABLE 42: Canada Recent Past, Current & Future Analysis for Logistics Automation by Offering - Hardware-Integrated Systems, Software and Services - Independent Analysis of Annual Sales in US$ Million for the Years 2024 through 2030 and % CAGR
- TABLE 43: Canada 6-Year Perspective for Logistics Automation by Offering - Percentage Breakdown of Value Sales for Hardware-Integrated Systems, Software and Services for the Years 2025 & 2030
- TABLE 44: Canada Recent Past, Current & Future Analysis for Logistics Automation by Function - Warehouse & Storage Management and Transportation Management - Independent Analysis of Annual Sales in US$ Million for the Years 2024 through 2030 and % CAGR
- TABLE 45: Canada 6-Year Perspective for Logistics Automation by Function - Percentage Breakdown of Value Sales for Warehouse & Storage Management and Transportation Management for the Years 2025 & 2030
- TABLE 46: Canada Recent Past, Current & Future Analysis for Logistics Automation by Vertical - Manufacturing, Healthcare & Pharmaceutical, FMCG, Retail & eCommerce, Oil, Gas & Energy, Chemicals and Other Verticals - Independent Analysis of Annual Sales in US$ Million for the Years 2024 through 2030 and % CAGR
- TABLE 47: Canada 6-Year Perspective for Logistics Automation by Vertical - Percentage Breakdown of Value Sales for Manufacturing, Healthcare & Pharmaceutical, FMCG, Retail & eCommerce, Oil, Gas & Energy, Chemicals and Other Verticals for the Years 2025 & 2030
- JAPAN
- Logistics Automation Market Presence - Strong/Active/Niche/Trivial - Key Competitors in Japan for 2025 (E)
- TABLE 48: Japan Recent Past, Current & Future Analysis for Logistics Automation by Organization Size - Large Enterprises and SMEs - Independent Analysis of Annual Sales in US$ Million for the Years 2024 through 2030 and % CAGR
- TABLE 49: Japan 6-Year Perspective for Logistics Automation by Organization Size - Percentage Breakdown of Value Sales for Large Enterprises and SMEs for the Years 2025 & 2030
- TABLE 50: Japan Recent Past, Current & Future Analysis for Logistics Automation by Offering - Hardware-Integrated Systems, Software and Services - Independent Analysis of Annual Sales in US$ Million for the Years 2024 through 2030 and % CAGR
- TABLE 51: Japan 6-Year Perspective for Logistics Automation by Offering - Percentage Breakdown of Value Sales for Hardware-Integrated Systems, Software and Services for the Years 2025 & 2030
- TABLE 52: Japan Recent Past, Current & Future Analysis for Logistics Automation by Function - Warehouse & Storage Management and Transportation Management - Independent Analysis of Annual Sales in US$ Million for the Years 2024 through 2030 and % CAGR
- TABLE 53: Japan 6-Year Perspective for Logistics Automation by Function - Percentage Breakdown of Value Sales for Warehouse & Storage Management and Transportation Management for the Years 2025 & 2030
- TABLE 54: Japan Recent Past, Current & Future Analysis for Logistics Automation by Vertical - Manufacturing, Healthcare & Pharmaceutical, FMCG, Retail & eCommerce, Oil, Gas & Energy, Chemicals and Other Verticals - Independent Analysis of Annual Sales in US$ Million for the Years 2024 through 2030 and % CAGR
- TABLE 55: Japan 6-Year Perspective for Logistics Automation by Vertical - Percentage Breakdown of Value Sales for Manufacturing, Healthcare & Pharmaceutical, FMCG, Retail & eCommerce, Oil, Gas & Energy, Chemicals and Other Verticals for the Years 2025 & 2030
- CHINA
- Logistics Automation Market Presence - Strong/Active/Niche/Trivial - Key Competitors in China for 2025 (E)
- TABLE 56: China Recent Past, Current & Future Analysis for Logistics Automation by Organization Size - Large Enterprises and SMEs - Independent Analysis of Annual Sales in US$ Million for the Years 2024 through 2030 and % CAGR
- TABLE 57: China 6-Year Perspective for Logistics Automation by Organization Size - Percentage Breakdown of Value Sales for Large Enterprises and SMEs for the Years 2025 & 2030
- TABLE 58: China Recent Past, Current & Future Analysis for Logistics Automation by Offering - Hardware-Integrated Systems, Software and Services - Independent Analysis of Annual Sales in US$ Million for the Years 2024 through 2030 and % CAGR
- TABLE 59: China 6-Year Perspective for Logistics Automation by Offering - Percentage Breakdown of Value Sales for Hardware-Integrated Systems, Software and Services for the Years 2025 & 2030
- TABLE 60: China Recent Past, Current & Future Analysis for Logistics Automation by Function - Warehouse & Storage Management and Transportation Management - Independent Analysis of Annual Sales in US$ Million for the Years 2024 through 2030 and % CAGR
- TABLE 61: China 6-Year Perspective for Logistics Automation by Function - Percentage Breakdown of Value Sales for Warehouse & Storage Management and Transportation Management for the Years 2025 & 2030
- TABLE 62: China Recent Past, Current & Future Analysis for Logistics Automation by Vertical - Manufacturing, Healthcare & Pharmaceutical, FMCG, Retail & eCommerce, Oil, Gas & Energy, Chemicals and Other Verticals - Independent Analysis of Annual Sales in US$ Million for the Years 2024 through 2030 and % CAGR
- TABLE 63: China 6-Year Perspective for Logistics Automation by Vertical - Percentage Breakdown of Value Sales for Manufacturing, Healthcare & Pharmaceutical, FMCG, Retail & eCommerce, Oil, Gas & Energy, Chemicals and Other Verticals for the Years 2025 & 2030
- EUROPE
- Logistics Automation Market Presence - Strong/Active/Niche/Trivial - Key Competitors in Europe for 2025 (E)
- TABLE 64: Europe Recent Past, Current & Future Analysis for Logistics Automation by Organization Size - Large Enterprises and SMEs - Independent Analysis of Annual Sales in US$ Million for the Years 2024 through 2030 and % CAGR
- TABLE 65: Europe 6-Year Perspective for Logistics Automation by Organization Size - Percentage Breakdown of Value Sales for Large Enterprises and SMEs for the Years 2025 & 2030
- TABLE 66: Europe Recent Past, Current & Future Analysis for Logistics Automation by Geographic Region - France, Germany, Italy, UK and Rest of Europe Markets - Independent Analysis of Annual Sales in US$ Million for Years 2024 through 2030 and % CAGR
- TABLE 67: Europe 6-Year Perspective for Logistics Automation by Geographic Region - Percentage Breakdown of Value Sales for France, Germany, Italy, UK and Rest of Europe Markets for Years 2025 & 2030
- TABLE 68: Europe Recent Past, Current & Future Analysis for Logistics Automation by Offering - Hardware-Integrated Systems, Software and Services - Independent Analysis of Annual Sales in US$ Million for the Years 2024 through 2030 and % CAGR
- TABLE 69: Europe 6-Year Perspective for Logistics Automation by Offering - Percentage Breakdown of Value Sales for Hardware-Integrated Systems, Software and Services for the Years 2025 & 2030
- TABLE 70: Europe Recent Past, Current & Future Analysis for Logistics Automation by Function - Warehouse & Storage Management and Transportation Management - Independent Analysis of Annual Sales in US$ Million for the Years 2024 through 2030 and % CAGR
- TABLE 71: Europe 6-Year Perspective for Logistics Automation by Function - Percentage Breakdown of Value Sales for Warehouse & Storage Management and Transportation Management for the Years 2025 & 2030
- TABLE 72: Europe Recent Past, Current & Future Analysis for Logistics Automation by Vertical - Manufacturing, Healthcare & Pharmaceutical, FMCG, Retail & eCommerce, Oil, Gas & Energy, Chemicals and Other Verticals - Independent Analysis of Annual Sales in US$ Million for the Years 2024 through 2030 and % CAGR
- TABLE 73: Europe 6-Year Perspective for Logistics Automation by Vertical - Percentage Breakdown of Value Sales for Manufacturing, Healthcare & Pharmaceutical, FMCG, Retail & eCommerce, Oil, Gas & Energy, Chemicals and Other Verticals for the Years 2025 & 2030
- FRANCE
- Logistics Automation Market Presence - Strong/Active/Niche/Trivial - Key Competitors in France for 2025 (E)
- TABLE 74: France Recent Past, Current & Future Analysis for Logistics Automation by Organization Size - Large Enterprises and SMEs - Independent Analysis of Annual Sales in US$ Million for the Years 2024 through 2030 and % CAGR
- TABLE 75: France 6-Year Perspective for Logistics Automation by Organization Size - Percentage Breakdown of Value Sales for Large Enterprises and SMEs for the Years 2025 & 2030
- TABLE 76: France Recent Past, Current & Future Analysis for Logistics Automation by Offering - Hardware-Integrated Systems, Software and Services - Independent Analysis of Annual Sales in US$ Million for the Years 2024 through 2030 and % CAGR
- TABLE 77: France 6-Year Perspective for Logistics Automation by Offering - Percentage Breakdown of Value Sales for Hardware-Integrated Systems, Software and Services for the Years 2025 & 2030
- TABLE 78: France Recent Past, Current & Future Analysis for Logistics Automation by Function - Warehouse & Storage Management and Transportation Management - Independent Analysis of Annual Sales in US$ Million for the Years 2024 through 2030 and % CAGR
- TABLE 79: France 6-Year Perspective for Logistics Automation by Function - Percentage Breakdown of Value Sales for Warehouse & Storage Management and Transportation Management for the Years 2025 & 2030
- TABLE 80: France Recent Past, Current & Future Analysis for Logistics Automation by Vertical - Manufacturing, Healthcare & Pharmaceutical, FMCG, Retail & eCommerce, Oil, Gas & Energy, Chemicals and Other Verticals - Independent Analysis of Annual Sales in US$ Million for the Years 2024 through 2030 and % CAGR
- TABLE 81: France 6-Year Perspective for Logistics Automation by Vertical - Percentage Breakdown of Value Sales for Manufacturing, Healthcare & Pharmaceutical, FMCG, Retail & eCommerce, Oil, Gas & Energy, Chemicals and Other Verticals for the Years 2025 & 2030
- GERMANY
- Logistics Automation Market Presence - Strong/Active/Niche/Trivial - Key Competitors in Germany for 2025 (E)
- TABLE 82: Germany Recent Past, Current & Future Analysis for Logistics Automation by Organization Size - Large Enterprises and SMEs - Independent Analysis of Annual Sales in US$ Million for the Years 2024 through 2030 and % CAGR
- TABLE 83: Germany 6-Year Perspective for Logistics Automation by Organization Size - Percentage Breakdown of Value Sales for Large Enterprises and SMEs for the Years 2025 & 2030
- TABLE 84: Germany Recent Past, Current & Future Analysis for Logistics Automation by Offering - Hardware-Integrated Systems, Software and Services - Independent Analysis of Annual Sales in US$ Million for the Years 2024 through 2030 and % CAGR
- TABLE 85: Germany 6-Year Perspective for Logistics Automation by Offering - Percentage Breakdown of Value Sales for Hardware-Integrated Systems, Software and Services for the Years 2025 & 2030
- TABLE 86: Germany Recent Past, Current & Future Analysis for Logistics Automation by Function - Warehouse & Storage Management and Transportation Management - Independent Analysis of Annual Sales in US$ Million for the Years 2024 through 2030 and % CAGR
- TABLE 87: Germany 6-Year Perspective for Logistics Automation by Function - Percentage Breakdown of Value Sales for Warehouse & Storage Management and Transportation Management for the Years 2025 & 2030
- TABLE 88: Germany Recent Past, Current & Future Analysis for Logistics Automation by Vertical - Manufacturing, Healthcare & Pharmaceutical, FMCG, Retail & eCommerce, Oil, Gas & Energy, Chemicals and Other Verticals - Independent Analysis of Annual Sales in US$ Million for the Years 2024 through 2030 and % CAGR
- TABLE 89: Germany 6-Year Perspective for Logistics Automation by Vertical - Percentage Breakdown of Value Sales for Manufacturing, Healthcare & Pharmaceutical, FMCG, Retail & eCommerce, Oil, Gas & Energy, Chemicals and Other Verticals for the Years 2025 & 2030
- ITALY
- TABLE 90: Italy Recent Past, Current & Future Analysis for Logistics Automation by Organization Size - Large Enterprises and SMEs - Independent Analysis of Annual Sales in US$ Million for the Years 2024 through 2030 and % CAGR
- TABLE 91: Italy 6-Year Perspective for Logistics Automation by Organization Size - Percentage Breakdown of Value Sales for Large Enterprises and SMEs for the Years 2025 & 2030
- TABLE 92: Italy Recent Past, Current & Future Analysis for Logistics Automation by Offering - Hardware-Integrated Systems, Software and Services - Independent Analysis of Annual Sales in US$ Million for the Years 2024 through 2030 and % CAGR
- TABLE 93: Italy 6-Year Perspective for Logistics Automation by Offering - Percentage Breakdown of Value Sales for Hardware-Integrated Systems, Software and Services for the Years 2025 & 2030
- TABLE 94: Italy Recent Past, Current & Future Analysis for Logistics Automation by Function - Warehouse & Storage Management and Transportation Management - Independent Analysis of Annual Sales in US$ Million for the Years 2024 through 2030 and % CAGR
- TABLE 95: Italy 6-Year Perspective for Logistics Automation by Function - Percentage Breakdown of Value Sales for Warehouse & Storage Management and Transportation Management for the Years 2025 & 2030
- TABLE 96: Italy Recent Past, Current & Future Analysis for Logistics Automation by Vertical - Manufacturing, Healthcare & Pharmaceutical, FMCG, Retail & eCommerce, Oil, Gas & Energy, Chemicals and Other Verticals - Independent Analysis of Annual Sales in US$ Million for the Years 2024 through 2030 and % CAGR
- TABLE 97: Italy 6-Year Perspective for Logistics Automation by Vertical - Percentage Breakdown of Value Sales for Manufacturing, Healthcare & Pharmaceutical, FMCG, Retail & eCommerce, Oil, Gas & Energy, Chemicals and Other Verticals for the Years 2025 & 2030
- UNITED KINGDOM
- Logistics Automation Market Presence - Strong/Active/Niche/Trivial - Key Competitors in the United Kingdom for 2025 (E)
- TABLE 98: UK Recent Past, Current & Future Analysis for Logistics Automation by Organization Size - Large Enterprises and SMEs - Independent Analysis of Annual Sales in US$ Million for the Years 2024 through 2030 and % CAGR
- TABLE 99: UK 6-Year Perspective for Logistics Automation by Organization Size - Percentage Breakdown of Value Sales for Large Enterprises and SMEs for the Years 2025 & 2030
- TABLE 100: UK Recent Past, Current & Future Analysis for Logistics Automation by Offering - Hardware-Integrated Systems, Software and Services - Independent Analysis of Annual Sales in US$ Million for the Years 2024 through 2030 and % CAGR
- TABLE 101: UK 6-Year Perspective for Logistics Automation by Offering - Percentage Breakdown of Value Sales for Hardware-Integrated Systems, Software and Services for the Years 2025 & 2030
- TABLE 102: UK Recent Past, Current & Future Analysis for Logistics Automation by Function - Warehouse & Storage Management and Transportation Management - Independent Analysis of Annual Sales in US$ Million for the Years 2024 through 2030 and % CAGR
- TABLE 103: UK 6-Year Perspective for Logistics Automation by Function - Percentage Breakdown of Value Sales for Warehouse & Storage Management and Transportation Management for the Years 2025 & 2030
- TABLE 104: UK Recent Past, Current & Future Analysis for Logistics Automation by Vertical - Manufacturing, Healthcare & Pharmaceutical, FMCG, Retail & eCommerce, Oil, Gas & Energy, Chemicals and Other Verticals - Independent Analysis of Annual Sales in US$ Million for the Years 2024 through 2030 and % CAGR
- TABLE 105: UK 6-Year Perspective for Logistics Automation by Vertical - Percentage Breakdown of Value Sales for Manufacturing, Healthcare & Pharmaceutical, FMCG, Retail & eCommerce, Oil, Gas & Energy, Chemicals and Other Verticals for the Years 2025 & 2030
- REST OF EUROPE
- TABLE 106: Rest of Europe Recent Past, Current & Future Analysis for Logistics Automation by Organization Size - Large Enterprises and SMEs - Independent Analysis of Annual Sales in US$ Million for the Years 2024 through 2030 and % CAGR
- TABLE 107: Rest of Europe 6-Year Perspective for Logistics Automation by Organization Size - Percentage Breakdown of Value Sales for Large Enterprises and SMEs for the Years 2025 & 2030
- TABLE 108: Rest of Europe Recent Past, Current & Future Analysis for Logistics Automation by Offering - Hardware-Integrated Systems, Software and Services - Independent Analysis of Annual Sales in US$ Million for the Years 2024 through 2030 and % CAGR
- TABLE 109: Rest of Europe 6-Year Perspective for Logistics Automation by Offering - Percentage Breakdown of Value Sales for Hardware-Integrated Systems, Software and Services for the Years 2025 & 2030
- TABLE 110: Rest of Europe Recent Past, Current & Future Analysis for Logistics Automation by Function - Warehouse & Storage Management and Transportation Management - Independent Analysis of Annual Sales in US$ Million for the Years 2024 through 2030 and % CAGR
- TABLE 111: Rest of Europe 6-Year Perspective for Logistics Automation by Function - Percentage Breakdown of Value Sales for Warehouse & Storage Management and Transportation Management for the Years 2025 & 2030
- TABLE 112: Rest of Europe Recent Past, Current & Future Analysis for Logistics Automation by Vertical - Manufacturing, Healthcare & Pharmaceutical, FMCG, Retail & eCommerce, Oil, Gas & Energy, Chemicals and Other Verticals - Independent Analysis of Annual Sales in US$ Million for the Years 2024 through 2030 and % CAGR
- TABLE 113: Rest of Europe 6-Year Perspective for Logistics Automation by Vertical - Percentage Breakdown of Value Sales for Manufacturing, Healthcare & Pharmaceutical, FMCG, Retail & eCommerce, Oil, Gas & Energy, Chemicals and Other Verticals for the Years 2025 & 2030
- ASIA-PACIFIC
- Logistics Automation Market Presence - Strong/Active/Niche/Trivial - Key Competitors in Asia-Pacific for 2025 (E)
- TABLE 114: Asia-Pacific Recent Past, Current & Future Analysis for Logistics Automation by Organization Size - Large Enterprises and SMEs - Independent Analysis of Annual Sales in US$ Million for the Years 2024 through 2030 and % CAGR
- TABLE 115: Asia-Pacific 6-Year Perspective for Logistics Automation by Organization Size - Percentage Breakdown of Value Sales for Large Enterprises and SMEs for the Years 2025 & 2030
- TABLE 116: Asia-Pacific Recent Past, Current & Future Analysis for Logistics Automation by Offering - Hardware-Integrated Systems, Software and Services - Independent Analysis of Annual Sales in US$ Million for the Years 2024 through 2030 and % CAGR
- TABLE 117: Asia-Pacific 6-Year Perspective for Logistics Automation by Offering - Percentage Breakdown of Value Sales for Hardware-Integrated Systems, Software and Services for the Years 2025 & 2030
- TABLE 118: Asia-Pacific Recent Past, Current & Future Analysis for Logistics Automation by Function - Warehouse & Storage Management and Transportation Management - Independent Analysis of Annual Sales in US$ Million for the Years 2024 through 2030 and % CAGR
- TABLE 119: Asia-Pacific 6-Year Perspective for Logistics Automation by Function - Percentage Breakdown of Value Sales for Warehouse & Storage Management and Transportation Management for the Years 2025 & 2030
- TABLE 120: Asia-Pacific Recent Past, Current & Future Analysis for Logistics Automation by Vertical - Manufacturing, Healthcare & Pharmaceutical, FMCG, Retail & eCommerce, Oil, Gas & Energy, Chemicals and Other Verticals - Independent Analysis of Annual Sales in US$ Million for the Years 2024 through 2030 and % CAGR
- TABLE 121: Asia-Pacific 6-Year Perspective for Logistics Automation by Vertical - Percentage Breakdown of Value Sales for Manufacturing, Healthcare & Pharmaceutical, FMCG, Retail & eCommerce, Oil, Gas & Energy, Chemicals and Other Verticals for the Years 2025 & 2030
- REST OF WORLD
- TABLE 122: Rest of World Recent Past, Current & Future Analysis for Logistics Automation by Organization Size - Large Enterprises and SMEs - Independent Analysis of Annual Sales in US$ Million for the Years 2024 through 2030 and % CAGR
- TABLE 123: Rest of World 6-Year Perspective for Logistics Automation by Organization Size - Percentage Breakdown of Value Sales for Large Enterprises and SMEs for the Years 2025 & 2030
- TABLE 124: Rest of World Recent Past, Current & Future Analysis for Logistics Automation by Offering - Hardware-Integrated Systems, Software and Services - Independent Analysis of Annual Sales in US$ Million for the Years 2024 through 2030 and % CAGR
- TABLE 125: Rest of World 6-Year Perspective for Logistics Automation by Offering - Percentage Breakdown of Value Sales for Hardware-Integrated Systems, Software and Services for the Years 2025 & 2030
- TABLE 126: Rest of World Recent Past, Current & Future Analysis for Logistics Automation by Function - Warehouse & Storage Management and Transportation Management - Independent Analysis of Annual Sales in US$ Million for the Years 2024 through 2030 and % CAGR
- TABLE 127: Rest of World 6-Year Perspective for Logistics Automation by Function - Percentage Breakdown of Value Sales for Warehouse & Storage Management and Transportation Management for the Years 2025 & 2030
- TABLE 128: Rest of World Recent Past, Current & Future Analysis for Logistics Automation by Vertical - Manufacturing, Healthcare & Pharmaceutical, FMCG, Retail & eCommerce, Oil, Gas & Energy, Chemicals and Other Verticals - Independent Analysis of Annual Sales in US$ Million for the Years 2024 through 2030 and % CAGR
- TABLE 129: Rest of World 6-Year Perspective for Logistics Automation by Vertical - Percentage Breakdown of Value Sales for Manufacturing, Healthcare & Pharmaceutical, FMCG, Retail & eCommerce, Oil, Gas & Energy, Chemicals and Other Verticals for the Years 2025 & 2030

