|
|
市場調査レポート
商品コード
1588955
重症筋無力症治療の世界市場Myasthenia Gravis Treatment |
||||||
|
|||||||
適宜更新あり
|
|||||||

| 重症筋無力症治療の世界市場 |
|
出版日: 2024年11月13日
発行: Market Glass, Inc. (Formerly Global Industry Analysts, Inc.)
ページ情報: 英文 89 Pages
納期: 即日から翌営業日
|

全表示
- 概要
- 目次
重症筋無力症治療の世界市場は2030年までに27億米ドルに達する見込み
2023年に17億米ドルと推定される重症筋無力症治療の世界市場は、分析期間2023-2030年にCAGR 6.2%で成長し、2030年には27億米ドルに達すると予測されます。本レポートで分析したセグメントの1つである投薬治療は、CAGR 5.7%を記録し、分析期間終了までに22億米ドルに達すると予測されます。外科治療分野の成長率は、分析期間中CAGR 4.5%と推定されます。
米国市場は4億6,130万米ドルと推定、中国はCAGR9.4%で成長予測
米国の重症筋無力症治療市場は、2023年に4億6,130万米ドルと推定されます。世界第2位の経済大国である中国は、2023-2030年のCAGRを9.4%として、2030年までに6億1,540万米ドルの市場規模に達すると予測されています。その他の注目すべき地域別市場としては、日本とカナダがあり、分析期間中のCAGRはそれぞれ3.2%と5.6%と予測されています。欧州では、ドイツがCAGR 3.4%で成長すると予測されています。
世界の重症筋無力症治療市場- 主要動向と促進要因のまとめ
重症筋無力症治療市場はどのように進化しているか?
重症筋無力症(MG)治療市場は、認知度の向上、患者数の増加、医学的治療の進歩に牽引され、ダイナミックな成長局面を迎えています。MGは、免疫系が神経筋接合部のアセチルコリン受容体を攻撃することによる筋力低下と疲労を特徴とする、まれな自己免疫性神経筋疾患です。MGの治療は、主に症状の管理と患者のQOLの改善に重点を置いています。現在の治療法には、コリンエステラーゼ阻害剤、コルチコステロイド、免疫抑制剤、モノクローナル抗体、プラスマフェレシスなどがある。MGの治療法は確立されていませんが、寛解期間を延長し、日常生活への影響を軽減することを目的とした新しい治療法の開発が進められています。
重症筋無力症治療の最新動向は?
MGの新たな治療動向は、より特異的で効率的な疾患管理を提供する生物学的製剤や標的治療薬などの新規治療薬が中心となっています。エクリズマブのようなモノクローナル抗体は、症状を軽減し、他の免疫抑制剤の必要性を最小化する効果があるため、米国FDAによりMGの治療薬として承認され、人気を集めています。さらに、B細胞枯渇や補体阻害経路を標的とした治療法の研究も進行中で、これらはMGの根底にある自己免疫反応に重要な役割を果たしていると考えられているからです。また、個別化医療の台頭も治療戦略に影響を及ぼしており、個々の患者プロファイルに基づいた治療法のカスタマイズが注目されています。
市場拡大を牽引するセグメントとは?
薬剤クラス別では、コリンエステラーゼ阻害剤とコルチコステロイドが現在市場を独占しているが、免疫抑制剤とモノクローナル抗体は、進行中の臨床試験と重症例管理における使用の増加により、急成長が予測されています。流通チャネルには、病院薬局、小売薬局、オンライン薬局が含まれるが、MG治療が専門的であることから、病院薬局が最大の市場シェアを占めています。地理的には、北米がMG有病率の高さ、強固なヘルスケアインフラ、有利な償還政策により市場をリードしています。しかし、アジア太平洋地域は、認知度と診断率の向上に伴い、大きな成長が見込まれています。
重症筋無力症治療市場の成長を促進する要因は?
重症筋無力症治療市場の成長は、有病率の増加、医薬品開発の進歩、疾患に対する意識の高まりなど、いくつかの要因によってもたらされます。モノクローナル抗体やその他の生物学的製剤など、革新的な治療法の臨床試験や規制状況の承認が増加し、治療の情勢が拡大しています。早期診断と早期介入を強化する取り組みが患者の予後を改善し、様々な治療選択肢に対する需要を促進しています。さらに、有効性が向上し副作用の少ない新しい製剤のイントロダクションが、先進的治療の採用を後押ししています。研究開発への投資と製薬企業間の戦略的提携も市場拡大に寄与しています。
調査対象企業の例(注目の34社)
- AbbVie Inc.
- Alexion Pharmaceutical Inc.
- Avadel Pharmaceuticals plc
- Bausch Health Companies Inc.
- Baxter International, Inc.
- CSL Behring
- F. Hoffmann-La Roche Ltd.
- GlaxoSmithKline plc
- Grifols SA
- Novartis AG
- Pfizer, Inc.
- Shire plc
- Takeda Pharmaceutical Company Limited
- Valeant Pharmaceuticals International, Inc.
目次
第1章 調査手法
第2章 エグゼクティブサマリー
- 市場概要
- 主要企業
- 市場動向と促進要因
- 世界市場の見通し
第3章 市場分析
- 米国
- カナダ
- 日本
- 中国
- 欧州
- フランス
- ドイツ
- イタリア
- 英国
- スペイン
- ロシア
- その他欧州
- アジア太平洋
- オーストラリア
- インド
- 韓国
- その他アジア太平洋地域
- ラテンアメリカ
- アルゼンチン
- ブラジル
- メキシコ
- その他ラテンアメリカ
- 中東
- イラン
- イスラエル
- サウジアラビア
- アラブ首長国連邦
- その他中東
- アフリカ
第4章 競合
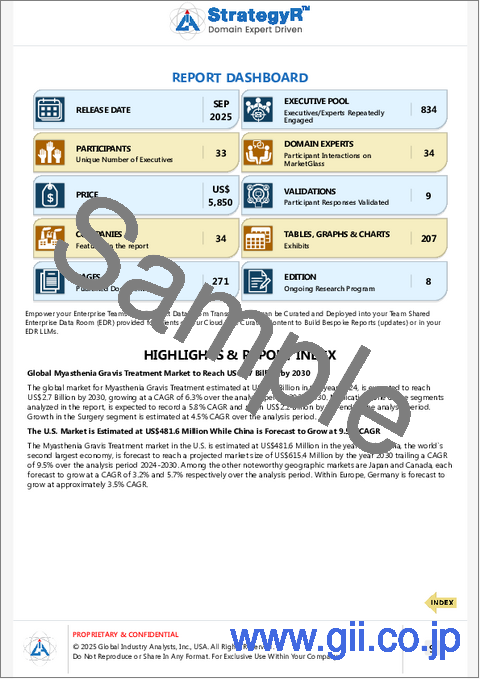
Global Myasthenia Gravis Treatment Market to Reach US$2.7 Billion by 2030
The global market for Myasthenia Gravis Treatment estimated at US$1.7 Billion in the year 2023, is expected to reach US$2.7 Billion by 2030, growing at a CAGR of 6.2% over the analysis period 2023-2030. Medication Treatment, one of the segments analyzed in the report, is expected to record a 5.7% CAGR and reach US$2.2 Billion by the end of the analysis period. Growth in the Surgery Treatment segment is estimated at 4.5% CAGR over the analysis period.
The U.S. Market is Estimated at US$461.3 Million While China is Forecast to Grow at 9.4% CAGR
The Myasthenia Gravis Treatment market in the U.S. is estimated at US$461.3 Million in the year 2023. China, the world's second largest economy, is forecast to reach a projected market size of US$615.4 Million by the year 2030 trailing a CAGR of 9.4% over the analysis period 2023-2030. Among the other noteworthy geographic markets are Japan and Canada, each forecast to grow at a CAGR of 3.2% and 5.6% respectively over the analysis period. Within Europe, Germany is forecast to grow at approximately 3.4% CAGR.
Global Myasthenia Gravis Treatment Market - Key Trends and Drivers Summarized
How Is the Market for Myasthenia Gravis Treatment Evolving?
The market for Myasthenia Gravis (MG) treatment is experiencing a phase of dynamic growth, driven by increasing awareness, a growing patient population, and advancements in medical therapies. MG is a rare autoimmune neuromuscular disorder characterized by muscle weakness and fatigue due to the immune system attacking acetylcholine receptors in the neuromuscular junction. Treatment for MG is primarily focused on managing symptoms and improving patients' quality of life. Current therapeutic options include cholinesterase inhibitors, corticosteroids, immunosuppressants, monoclonal antibodies, and plasmapheresis. While there is no known cure for MG, new developments in treatment options are aimed at extending remission periods and reducing the disease's impact on daily life.
What Are the Latest Trends in Myasthenia Gravis Treatment?
Emerging treatment trends in MG are centered around novel therapeutics, such as biologics and targeted therapies, which offer more specific and efficient disease management. Monoclonal antibodies like eculizumab, approved by the U.S. FDA for MG, are gaining traction due to their efficacy in reducing symptoms and minimizing the need for other immunosuppressive drugs. Additionally, research is ongoing for therapies that target B-cell depletion and complement inhibition pathways, as these are believed to play significant roles in the autoimmune response underlying MG. The rise of personalized medicine is also influencing treatment strategies, with a focus on tailoring therapies based on individual patient profiles.
What Segments Are Driving Market Expansion?
Based on drug class, cholinesterase inhibitors and corticosteroids currently dominate the market; however, immunosuppressants and monoclonal antibodies are projected to witness rapid growth due to ongoing clinical trials and their increasing use in managing severe cases. Distribution channels include hospital pharmacies, retail pharmacies, and online pharmacies, with hospital pharmacies accounting for the largest market share due to the specialized nature of MG treatments. Geographically, North America leads the market owing to the higher prevalence of MG, a robust healthcare infrastructure, and favorable reimbursement policies. The Asia-Pacific region, however, is expected to see significant growth as awareness and diagnosis rates increase.
What Factors Are Driving the Growth in the Myasthenia Gravis Treatment Market?
The growth in the Myasthenia Gravis treatment market is driven by several factors, including increasing prevalence, advancements in drug development, and rising awareness about the disease. The growing number of clinical trials and regulatory approvals for innovative therapies, such as monoclonal antibodies and other biologics, are expanding the treatment landscape. Efforts to enhance early diagnosis and intervention are improving patient outcomes, thereby driving demand for various therapeutic options. Furthermore, the introduction of new formulations that offer improved efficacy and fewer side effects is encouraging the adoption of advanced treatments. Investments in research and development, coupled with strategic collaborations among pharmaceutical companies, are also contributing to market expansion.
Select Competitors (Total 34 Featured) -
- AbbVie Inc.
- Alexion Pharmaceutical Inc.
- Avadel Pharmaceuticals plc
- Bausch Health Companies Inc.
- Baxter International, Inc.
- CSL Behring
- F. Hoffmann-La Roche Ltd.
- GlaxoSmithKline plc
- Grifols SA
- Novartis AG
- Pfizer, Inc.
- Shire plc
- Takeda Pharmaceutical Company Limited
- Valeant Pharmaceuticals International, Inc.
TABLE OF CONTENTS
I. METHODOLOGY
II. EXECUTIVE SUMMARY
- 1. MARKET OVERVIEW
- Global Economic Update
- Myasthenia Gravis Treatment - Global Key Competitors Percentage Market Share in 2024 (E)
- Competitive Market Presence - Strong/Active/Niche/Trivial for Players Worldwide in 2024 (E)
- 2. FOCUS ON SELECT PLAYERS
- 3. MARKET TRENDS & DRIVERS
- Rising Demand for Effective Immunosuppressive Therapies Spurs Growth in Myasthenia Gravis Treatment Market
- Technological Advancements in Monoclonal Antibody Drugs Strengthen Business Case for Adoption
- Growing Focus on Early Diagnosis and Personalized Treatment Expands Addressable Market
- Expansion of Myasthenia Gravis Treatment in Neurology and Specialty Clinics Fuels Market Growth
- Increasing Adoption of Steroid-Sparing Therapies and Plasma Exchange Expands Market Opportunities
- Technological Innovations in Complement Inhibitors and Acetylcholinesterase Inhibitors Propel Market Expansion
- Rising Focus on Improving Patient Outcomes and Reducing Treatment Side Effects Drives Demand for Myasthenia Gravis Treatments
- Growing Use of Myasthenia Gravis Treatment in Pediatric and Geriatric Patient Care Expands Market Potential
- Rising Adoption of Emerging Therapies in Refractory Myasthenia Gravis Expands Addressable Market
- Technological Advancements in Novel Biologics and Gene Therapy Approaches Propel Market Growth
- Increasing Focus on Integrating Telemedicine in Treatment Plans Drives Adoption
- Rising Demand for Clinical Trials and Expanded Access Programs Strengthens Global Market
- Expansion of Myasthenia Gravis Treatment in Rare Disease and Orphan Drug Categories Expands Market Opportunities
- 4. GLOBAL MARKET PERSPECTIVE
- TABLE 1: World Recent Past, Current & Future Analysis for Myasthenia Gravis Treatment by Geographic Region - USA, Canada, Japan, China, Europe, Asia-Pacific, Latin America, Middle East and Africa Markets - Independent Analysis of Annual Sales in US$ Thousand for Years 2023 through 2030 and % CAGR
- TABLE 2: World Historic Review for Myasthenia Gravis Treatment by Geographic Region - USA, Canada, Japan, China, Europe, Asia-Pacific, Latin America, Middle East and Africa Markets - Independent Analysis of Annual Sales in US$ Thousand for Years 2014 through 2022 and % CAGR
- TABLE 3: World 16-Year Perspective for Myasthenia Gravis Treatment by Geographic Region - Percentage Breakdown of Value Sales for USA, Canada, Japan, China, Europe, Asia-Pacific, Latin America, Middle East and Africa Markets for Years 2014, 2024 & 2030
- TABLE 4: World Recent Past, Current & Future Analysis for Medication by Geographic Region - USA, Canada, Japan, China, Europe, Asia-Pacific, Latin America, Middle East and Africa Markets - Independent Analysis of Annual Sales in US$ Thousand for Years 2023 through 2030 and % CAGR
- TABLE 5: World Historic Review for Medication by Geographic Region - USA, Canada, Japan, China, Europe, Asia-Pacific, Latin America, Middle East and Africa Markets - Independent Analysis of Annual Sales in US$ Thousand for Years 2014 through 2022 and % CAGR
- TABLE 6: World 16-Year Perspective for Medication by Geographic Region - Percentage Breakdown of Value Sales for USA, Canada, Japan, China, Europe, Asia-Pacific, Latin America, Middle East and Africa for Years 2014, 2024 & 2030
- TABLE 7: World Recent Past, Current & Future Analysis for Surgery by Geographic Region - USA, Canada, Japan, China, Europe, Asia-Pacific, Latin America, Middle East and Africa Markets - Independent Analysis of Annual Sales in US$ Thousand for Years 2023 through 2030 and % CAGR
- TABLE 8: World Historic Review for Surgery by Geographic Region - USA, Canada, Japan, China, Europe, Asia-Pacific, Latin America, Middle East and Africa Markets - Independent Analysis of Annual Sales in US$ Thousand for Years 2014 through 2022 and % CAGR
- TABLE 9: World 16-Year Perspective for Surgery by Geographic Region - Percentage Breakdown of Value Sales for USA, Canada, Japan, China, Europe, Asia-Pacific, Latin America, Middle East and Africa for Years 2014, 2024 & 2030
- TABLE 10: World Recent Past, Current & Future Analysis for Other Treatment Types by Geographic Region - USA, Canada, Japan, China, Europe, Asia-Pacific, Latin America, Middle East and Africa Markets - Independent Analysis of Annual Sales in US$ Thousand for Years 2023 through 2030 and % CAGR
- TABLE 11: World Historic Review for Other Treatment Types by Geographic Region - USA, Canada, Japan, China, Europe, Asia-Pacific, Latin America, Middle East and Africa Markets - Independent Analysis of Annual Sales in US$ Thousand for Years 2014 through 2022 and % CAGR
- TABLE 12: World 16-Year Perspective for Other Treatment Types by Geographic Region - Percentage Breakdown of Value Sales for USA, Canada, Japan, China, Europe, Asia-Pacific, Latin America, Middle East and Africa for Years 2014, 2024 & 2030
- TABLE 13: World Recent Past, Current & Future Analysis for Hospitals by Geographic Region - USA, Canada, Japan, China, Europe, Asia-Pacific, Latin America, Middle East and Africa Markets - Independent Analysis of Annual Sales in US$ Thousand for Years 2023 through 2030 and % CAGR
- TABLE 14: World Historic Review for Hospitals by Geographic Region - USA, Canada, Japan, China, Europe, Asia-Pacific, Latin America, Middle East and Africa Markets - Independent Analysis of Annual Sales in US$ Thousand for Years 2014 through 2022 and % CAGR
- TABLE 15: World 16-Year Perspective for Hospitals by Geographic Region - Percentage Breakdown of Value Sales for USA, Canada, Japan, China, Europe, Asia-Pacific, Latin America, Middle East and Africa for Years 2014, 2024 & 2030
- TABLE 16: World Recent Past, Current & Future Analysis for Clinics by Geographic Region - USA, Canada, Japan, China, Europe, Asia-Pacific, Latin America, Middle East and Africa Markets - Independent Analysis of Annual Sales in US$ Thousand for Years 2023 through 2030 and % CAGR
- TABLE 17: World Historic Review for Clinics by Geographic Region - USA, Canada, Japan, China, Europe, Asia-Pacific, Latin America, Middle East and Africa Markets - Independent Analysis of Annual Sales in US$ Thousand for Years 2014 through 2022 and % CAGR
- TABLE 18: World 16-Year Perspective for Clinics by Geographic Region - Percentage Breakdown of Value Sales for USA, Canada, Japan, China, Europe, Asia-Pacific, Latin America, Middle East and Africa for Years 2014, 2024 & 2030
- TABLE 19: World Recent Past, Current & Future Analysis for Other End-Uses by Geographic Region - USA, Canada, Japan, China, Europe, Asia-Pacific, Latin America, Middle East and Africa Markets - Independent Analysis of Annual Sales in US$ Thousand for Years 2023 through 2030 and % CAGR
- TABLE 20: World Historic Review for Other End-Uses by Geographic Region - USA, Canada, Japan, China, Europe, Asia-Pacific, Latin America, Middle East and Africa Markets - Independent Analysis of Annual Sales in US$ Thousand for Years 2014 through 2022 and % CAGR
- TABLE 21: World 16-Year Perspective for Other End-Uses by Geographic Region - Percentage Breakdown of Value Sales for USA, Canada, Japan, China, Europe, Asia-Pacific, Latin America, Middle East and Africa for Years 2014, 2024 & 2030
- TABLE 22: World Myasthenia Gravis Treatment Market Analysis of Annual Sales in US$ Thousand for Years 2014 through 2030
III. MARKET ANALYSIS
- UNITED STATES
- Myasthenia Gravis Treatment Market Presence - Strong/Active/Niche/Trivial - Key Competitors in the United States for 2024 (E)
- TABLE 23: USA Recent Past, Current & Future Analysis for Myasthenia Gravis Treatment by Treatment Type - Medication, Surgery and Other Treatment Types - Independent Analysis of Annual Sales in US$ Thousand for the Years 2023 through 2030 and % CAGR
- TABLE 24: USA Historic Review for Myasthenia Gravis Treatment by Treatment Type - Medication, Surgery and Other Treatment Types Markets - Independent Analysis of Annual Sales in US$ Thousand for Years 2014 through 2022 and % CAGR
- TABLE 25: USA 16-Year Perspective for Myasthenia Gravis Treatment by Treatment Type - Percentage Breakdown of Value Sales for Medication, Surgery and Other Treatment Types for the Years 2014, 2024 & 2030
- TABLE 26: USA Recent Past, Current & Future Analysis for Myasthenia Gravis Treatment by End-Use - Hospitals, Clinics and Other End-Uses - Independent Analysis of Annual Sales in US$ Thousand for the Years 2023 through 2030 and % CAGR
- TABLE 27: USA Historic Review for Myasthenia Gravis Treatment by End-Use - Hospitals, Clinics and Other End-Uses Markets - Independent Analysis of Annual Sales in US$ Thousand for Years 2014 through 2022 and % CAGR
- TABLE 28: USA 16-Year Perspective for Myasthenia Gravis Treatment by End-Use - Percentage Breakdown of Value Sales for Hospitals, Clinics and Other End-Uses for the Years 2014, 2024 & 2030
- CANADA
- TABLE 29: Canada Recent Past, Current & Future Analysis for Myasthenia Gravis Treatment by Treatment Type - Medication, Surgery and Other Treatment Types - Independent Analysis of Annual Sales in US$ Thousand for the Years 2023 through 2030 and % CAGR
- TABLE 30: Canada Historic Review for Myasthenia Gravis Treatment by Treatment Type - Medication, Surgery and Other Treatment Types Markets - Independent Analysis of Annual Sales in US$ Thousand for Years 2014 through 2022 and % CAGR
- TABLE 31: Canada 16-Year Perspective for Myasthenia Gravis Treatment by Treatment Type - Percentage Breakdown of Value Sales for Medication, Surgery and Other Treatment Types for the Years 2014, 2024 & 2030
- TABLE 32: Canada Recent Past, Current & Future Analysis for Myasthenia Gravis Treatment by End-Use - Hospitals, Clinics and Other End-Uses - Independent Analysis of Annual Sales in US$ Thousand for the Years 2023 through 2030 and % CAGR
- TABLE 33: Canada Historic Review for Myasthenia Gravis Treatment by End-Use - Hospitals, Clinics and Other End-Uses Markets - Independent Analysis of Annual Sales in US$ Thousand for Years 2014 through 2022 and % CAGR
- TABLE 34: Canada 16-Year Perspective for Myasthenia Gravis Treatment by End-Use - Percentage Breakdown of Value Sales for Hospitals, Clinics and Other End-Uses for the Years 2014, 2024 & 2030
- JAPAN
- Myasthenia Gravis Treatment Market Presence - Strong/Active/Niche/Trivial - Key Competitors in Japan for 2024 (E)
- TABLE 35: Japan Recent Past, Current & Future Analysis for Myasthenia Gravis Treatment by Treatment Type - Medication, Surgery and Other Treatment Types - Independent Analysis of Annual Sales in US$ Thousand for the Years 2023 through 2030 and % CAGR
- TABLE 36: Japan Historic Review for Myasthenia Gravis Treatment by Treatment Type - Medication, Surgery and Other Treatment Types Markets - Independent Analysis of Annual Sales in US$ Thousand for Years 2014 through 2022 and % CAGR
- TABLE 37: Japan 16-Year Perspective for Myasthenia Gravis Treatment by Treatment Type - Percentage Breakdown of Value Sales for Medication, Surgery and Other Treatment Types for the Years 2014, 2024 & 2030
- TABLE 38: Japan Recent Past, Current & Future Analysis for Myasthenia Gravis Treatment by End-Use - Hospitals, Clinics and Other End-Uses - Independent Analysis of Annual Sales in US$ Thousand for the Years 2023 through 2030 and % CAGR
- TABLE 39: Japan Historic Review for Myasthenia Gravis Treatment by End-Use - Hospitals, Clinics and Other End-Uses Markets - Independent Analysis of Annual Sales in US$ Thousand for Years 2014 through 2022 and % CAGR
- TABLE 40: Japan 16-Year Perspective for Myasthenia Gravis Treatment by End-Use - Percentage Breakdown of Value Sales for Hospitals, Clinics and Other End-Uses for the Years 2014, 2024 & 2030
- CHINA
- Myasthenia Gravis Treatment Market Presence - Strong/Active/Niche/Trivial - Key Competitors in China for 2024 (E)
- TABLE 41: China Recent Past, Current & Future Analysis for Myasthenia Gravis Treatment by Treatment Type - Medication, Surgery and Other Treatment Types - Independent Analysis of Annual Sales in US$ Thousand for the Years 2023 through 2030 and % CAGR
- TABLE 42: China Historic Review for Myasthenia Gravis Treatment by Treatment Type - Medication, Surgery and Other Treatment Types Markets - Independent Analysis of Annual Sales in US$ Thousand for Years 2014 through 2022 and % CAGR
- TABLE 43: China 16-Year Perspective for Myasthenia Gravis Treatment by Treatment Type - Percentage Breakdown of Value Sales for Medication, Surgery and Other Treatment Types for the Years 2014, 2024 & 2030
- TABLE 44: China Recent Past, Current & Future Analysis for Myasthenia Gravis Treatment by End-Use - Hospitals, Clinics and Other End-Uses - Independent Analysis of Annual Sales in US$ Thousand for the Years 2023 through 2030 and % CAGR
- TABLE 45: China Historic Review for Myasthenia Gravis Treatment by End-Use - Hospitals, Clinics and Other End-Uses Markets - Independent Analysis of Annual Sales in US$ Thousand for Years 2014 through 2022 and % CAGR
- TABLE 46: China 16-Year Perspective for Myasthenia Gravis Treatment by End-Use - Percentage Breakdown of Value Sales for Hospitals, Clinics and Other End-Uses for the Years 2014, 2024 & 2030
- EUROPE
- Myasthenia Gravis Treatment Market Presence - Strong/Active/Niche/Trivial - Key Competitors in Europe for 2024 (E)
- TABLE 47: Europe Recent Past, Current & Future Analysis for Myasthenia Gravis Treatment by Geographic Region - France, Germany, Italy, UK, Spain, Russia and Rest of Europe Markets - Independent Analysis of Annual Sales in US$ Thousand for Years 2023 through 2030 and % CAGR
- TABLE 48: Europe Historic Review for Myasthenia Gravis Treatment by Geographic Region - France, Germany, Italy, UK, Spain, Russia and Rest of Europe Markets - Independent Analysis of Annual Sales in US$ Thousand for Years 2014 through 2022 and % CAGR
- TABLE 49: Europe 16-Year Perspective for Myasthenia Gravis Treatment by Geographic Region - Percentage Breakdown of Value Sales for France, Germany, Italy, UK, Spain, Russia and Rest of Europe Markets for Years 2014, 2024 & 2030
- TABLE 50: Europe Recent Past, Current & Future Analysis for Myasthenia Gravis Treatment by Treatment Type - Medication, Surgery and Other Treatment Types - Independent Analysis of Annual Sales in US$ Thousand for the Years 2023 through 2030 and % CAGR
- TABLE 51: Europe Historic Review for Myasthenia Gravis Treatment by Treatment Type - Medication, Surgery and Other Treatment Types Markets - Independent Analysis of Annual Sales in US$ Thousand for Years 2014 through 2022 and % CAGR
- TABLE 52: Europe 16-Year Perspective for Myasthenia Gravis Treatment by Treatment Type - Percentage Breakdown of Value Sales for Medication, Surgery and Other Treatment Types for the Years 2014, 2024 & 2030
- TABLE 53: Europe Recent Past, Current & Future Analysis for Myasthenia Gravis Treatment by End-Use - Hospitals, Clinics and Other End-Uses - Independent Analysis of Annual Sales in US$ Thousand for the Years 2023 through 2030 and % CAGR
- TABLE 54: Europe Historic Review for Myasthenia Gravis Treatment by End-Use - Hospitals, Clinics and Other End-Uses Markets - Independent Analysis of Annual Sales in US$ Thousand for Years 2014 through 2022 and % CAGR
- TABLE 55: Europe 16-Year Perspective for Myasthenia Gravis Treatment by End-Use - Percentage Breakdown of Value Sales for Hospitals, Clinics and Other End-Uses for the Years 2014, 2024 & 2030
- FRANCE
- Myasthenia Gravis Treatment Market Presence - Strong/Active/Niche/Trivial - Key Competitors in France for 2024 (E)
- TABLE 56: France Recent Past, Current & Future Analysis for Myasthenia Gravis Treatment by Treatment Type - Medication, Surgery and Other Treatment Types - Independent Analysis of Annual Sales in US$ Thousand for the Years 2023 through 2030 and % CAGR
- TABLE 57: France Historic Review for Myasthenia Gravis Treatment by Treatment Type - Medication, Surgery and Other Treatment Types Markets - Independent Analysis of Annual Sales in US$ Thousand for Years 2014 through 2022 and % CAGR
- TABLE 58: France 16-Year Perspective for Myasthenia Gravis Treatment by Treatment Type - Percentage Breakdown of Value Sales for Medication, Surgery and Other Treatment Types for the Years 2014, 2024 & 2030
- TABLE 59: France Recent Past, Current & Future Analysis for Myasthenia Gravis Treatment by End-Use - Hospitals, Clinics and Other End-Uses - Independent Analysis of Annual Sales in US$ Thousand for the Years 2023 through 2030 and % CAGR
- TABLE 60: France Historic Review for Myasthenia Gravis Treatment by End-Use - Hospitals, Clinics and Other End-Uses Markets - Independent Analysis of Annual Sales in US$ Thousand for Years 2014 through 2022 and % CAGR
- TABLE 61: France 16-Year Perspective for Myasthenia Gravis Treatment by End-Use - Percentage Breakdown of Value Sales for Hospitals, Clinics and Other End-Uses for the Years 2014, 2024 & 2030
- GERMANY
- Myasthenia Gravis Treatment Market Presence - Strong/Active/Niche/Trivial - Key Competitors in Germany for 2024 (E)
- TABLE 62: Germany Recent Past, Current & Future Analysis for Myasthenia Gravis Treatment by Treatment Type - Medication, Surgery and Other Treatment Types - Independent Analysis of Annual Sales in US$ Thousand for the Years 2023 through 2030 and % CAGR
- TABLE 63: Germany Historic Review for Myasthenia Gravis Treatment by Treatment Type - Medication, Surgery and Other Treatment Types Markets - Independent Analysis of Annual Sales in US$ Thousand for Years 2014 through 2022 and % CAGR
- TABLE 64: Germany 16-Year Perspective for Myasthenia Gravis Treatment by Treatment Type - Percentage Breakdown of Value Sales for Medication, Surgery and Other Treatment Types for the Years 2014, 2024 & 2030
- TABLE 65: Germany Recent Past, Current & Future Analysis for Myasthenia Gravis Treatment by End-Use - Hospitals, Clinics and Other End-Uses - Independent Analysis of Annual Sales in US$ Thousand for the Years 2023 through 2030 and % CAGR
- TABLE 66: Germany Historic Review for Myasthenia Gravis Treatment by End-Use - Hospitals, Clinics and Other End-Uses Markets - Independent Analysis of Annual Sales in US$ Thousand for Years 2014 through 2022 and % CAGR
- TABLE 67: Germany 16-Year Perspective for Myasthenia Gravis Treatment by End-Use - Percentage Breakdown of Value Sales for Hospitals, Clinics and Other End-Uses for the Years 2014, 2024 & 2030
- ITALY
- TABLE 68: Italy Recent Past, Current & Future Analysis for Myasthenia Gravis Treatment by Treatment Type - Medication, Surgery and Other Treatment Types - Independent Analysis of Annual Sales in US$ Thousand for the Years 2023 through 2030 and % CAGR
- TABLE 69: Italy Historic Review for Myasthenia Gravis Treatment by Treatment Type - Medication, Surgery and Other Treatment Types Markets - Independent Analysis of Annual Sales in US$ Thousand for Years 2014 through 2022 and % CAGR
- TABLE 70: Italy 16-Year Perspective for Myasthenia Gravis Treatment by Treatment Type - Percentage Breakdown of Value Sales for Medication, Surgery and Other Treatment Types for the Years 2014, 2024 & 2030
- TABLE 71: Italy Recent Past, Current & Future Analysis for Myasthenia Gravis Treatment by End-Use - Hospitals, Clinics and Other End-Uses - Independent Analysis of Annual Sales in US$ Thousand for the Years 2023 through 2030 and % CAGR
- TABLE 72: Italy Historic Review for Myasthenia Gravis Treatment by End-Use - Hospitals, Clinics and Other End-Uses Markets - Independent Analysis of Annual Sales in US$ Thousand for Years 2014 through 2022 and % CAGR
- TABLE 73: Italy 16-Year Perspective for Myasthenia Gravis Treatment by End-Use - Percentage Breakdown of Value Sales for Hospitals, Clinics and Other End-Uses for the Years 2014, 2024 & 2030
- UNITED KINGDOM
- Myasthenia Gravis Treatment Market Presence - Strong/Active/Niche/Trivial - Key Competitors in the United Kingdom for 2024 (E)
- TABLE 74: UK Recent Past, Current & Future Analysis for Myasthenia Gravis Treatment by Treatment Type - Medication, Surgery and Other Treatment Types - Independent Analysis of Annual Sales in US$ Thousand for the Years 2023 through 2030 and % CAGR
- TABLE 75: UK Historic Review for Myasthenia Gravis Treatment by Treatment Type - Medication, Surgery and Other Treatment Types Markets - Independent Analysis of Annual Sales in US$ Thousand for Years 2014 through 2022 and % CAGR
- TABLE 76: UK 16-Year Perspective for Myasthenia Gravis Treatment by Treatment Type - Percentage Breakdown of Value Sales for Medication, Surgery and Other Treatment Types for the Years 2014, 2024 & 2030
- TABLE 77: UK Recent Past, Current & Future Analysis for Myasthenia Gravis Treatment by End-Use - Hospitals, Clinics and Other End-Uses - Independent Analysis of Annual Sales in US$ Thousand for the Years 2023 through 2030 and % CAGR
- TABLE 78: UK Historic Review for Myasthenia Gravis Treatment by End-Use - Hospitals, Clinics and Other End-Uses Markets - Independent Analysis of Annual Sales in US$ Thousand for Years 2014 through 2022 and % CAGR
- TABLE 79: UK 16-Year Perspective for Myasthenia Gravis Treatment by End-Use - Percentage Breakdown of Value Sales for Hospitals, Clinics and Other End-Uses for the Years 2014, 2024 & 2030
- SPAIN
- TABLE 80: Spain Recent Past, Current & Future Analysis for Myasthenia Gravis Treatment by Treatment Type - Medication, Surgery and Other Treatment Types - Independent Analysis of Annual Sales in US$ Thousand for the Years 2023 through 2030 and % CAGR
- TABLE 81: Spain Historic Review for Myasthenia Gravis Treatment by Treatment Type - Medication, Surgery and Other Treatment Types Markets - Independent Analysis of Annual Sales in US$ Thousand for Years 2014 through 2022 and % CAGR
- TABLE 82: Spain 16-Year Perspective for Myasthenia Gravis Treatment by Treatment Type - Percentage Breakdown of Value Sales for Medication, Surgery and Other Treatment Types for the Years 2014, 2024 & 2030
- TABLE 83: Spain Recent Past, Current & Future Analysis for Myasthenia Gravis Treatment by End-Use - Hospitals, Clinics and Other End-Uses - Independent Analysis of Annual Sales in US$ Thousand for the Years 2023 through 2030 and % CAGR
- TABLE 84: Spain Historic Review for Myasthenia Gravis Treatment by End-Use - Hospitals, Clinics and Other End-Uses Markets - Independent Analysis of Annual Sales in US$ Thousand for Years 2014 through 2022 and % CAGR
- TABLE 85: Spain 16-Year Perspective for Myasthenia Gravis Treatment by End-Use - Percentage Breakdown of Value Sales for Hospitals, Clinics and Other End-Uses for the Years 2014, 2024 & 2030
- RUSSIA
- TABLE 86: Russia Recent Past, Current & Future Analysis for Myasthenia Gravis Treatment by Treatment Type - Medication, Surgery and Other Treatment Types - Independent Analysis of Annual Sales in US$ Thousand for the Years 2023 through 2030 and % CAGR
- TABLE 87: Russia Historic Review for Myasthenia Gravis Treatment by Treatment Type - Medication, Surgery and Other Treatment Types Markets - Independent Analysis of Annual Sales in US$ Thousand for Years 2014 through 2022 and % CAGR
- TABLE 88: Russia 16-Year Perspective for Myasthenia Gravis Treatment by Treatment Type - Percentage Breakdown of Value Sales for Medication, Surgery and Other Treatment Types for the Years 2014, 2024 & 2030
- TABLE 89: Russia Recent Past, Current & Future Analysis for Myasthenia Gravis Treatment by End-Use - Hospitals, Clinics and Other End-Uses - Independent Analysis of Annual Sales in US$ Thousand for the Years 2023 through 2030 and % CAGR
- TABLE 90: Russia Historic Review for Myasthenia Gravis Treatment by End-Use - Hospitals, Clinics and Other End-Uses Markets - Independent Analysis of Annual Sales in US$ Thousand for Years 2014 through 2022 and % CAGR
- TABLE 91: Russia 16-Year Perspective for Myasthenia Gravis Treatment by End-Use - Percentage Breakdown of Value Sales for Hospitals, Clinics and Other End-Uses for the Years 2014, 2024 & 2030
- REST OF EUROPE
- TABLE 92: Rest of Europe Recent Past, Current & Future Analysis for Myasthenia Gravis Treatment by Treatment Type - Medication, Surgery and Other Treatment Types - Independent Analysis of Annual Sales in US$ Thousand for the Years 2023 through 2030 and % CAGR
- TABLE 93: Rest of Europe Historic Review for Myasthenia Gravis Treatment by Treatment Type - Medication, Surgery and Other Treatment Types Markets - Independent Analysis of Annual Sales in US$ Thousand for Years 2014 through 2022 and % CAGR
- TABLE 94: Rest of Europe 16-Year Perspective for Myasthenia Gravis Treatment by Treatment Type - Percentage Breakdown of Value Sales for Medication, Surgery and Other Treatment Types for the Years 2014, 2024 & 2030
- TABLE 95: Rest of Europe Recent Past, Current & Future Analysis for Myasthenia Gravis Treatment by End-Use - Hospitals, Clinics and Other End-Uses - Independent Analysis of Annual Sales in US$ Thousand for the Years 2023 through 2030 and % CAGR
- TABLE 96: Rest of Europe Historic Review for Myasthenia Gravis Treatment by End-Use - Hospitals, Clinics and Other End-Uses Markets - Independent Analysis of Annual Sales in US$ Thousand for Years 2014 through 2022 and % CAGR
- TABLE 97: Rest of Europe 16-Year Perspective for Myasthenia Gravis Treatment by End-Use - Percentage Breakdown of Value Sales for Hospitals, Clinics and Other End-Uses for the Years 2014, 2024 & 2030
- ASIA-PACIFIC
- Myasthenia Gravis Treatment Market Presence - Strong/Active/Niche/Trivial - Key Competitors in Asia-Pacific for 2024 (E)
- TABLE 98: Asia-Pacific Recent Past, Current & Future Analysis for Myasthenia Gravis Treatment by Geographic Region - Australia, India, South Korea and Rest of Asia-Pacific Markets - Independent Analysis of Annual Sales in US$ Thousand for Years 2023 through 2030 and % CAGR
- TABLE 99: Asia-Pacific Historic Review for Myasthenia Gravis Treatment by Geographic Region - Australia, India, South Korea and Rest of Asia-Pacific Markets - Independent Analysis of Annual Sales in US$ Thousand for Years 2014 through 2022 and % CAGR
- TABLE 100: Asia-Pacific 16-Year Perspective for Myasthenia Gravis Treatment by Geographic Region - Percentage Breakdown of Value Sales for Australia, India, South Korea and Rest of Asia-Pacific Markets for Years 2014, 2024 & 2030
- TABLE 101: Asia-Pacific Recent Past, Current & Future Analysis for Myasthenia Gravis Treatment by Treatment Type - Medication, Surgery and Other Treatment Types - Independent Analysis of Annual Sales in US$ Thousand for the Years 2023 through 2030 and % CAGR
- TABLE 102: Asia-Pacific Historic Review for Myasthenia Gravis Treatment by Treatment Type - Medication, Surgery and Other Treatment Types Markets - Independent Analysis of Annual Sales in US$ Thousand for Years 2014 through 2022 and % CAGR
- TABLE 103: Asia-Pacific 16-Year Perspective for Myasthenia Gravis Treatment by Treatment Type - Percentage Breakdown of Value Sales for Medication, Surgery and Other Treatment Types for the Years 2014, 2024 & 2030
- TABLE 104: Asia-Pacific Recent Past, Current & Future Analysis for Myasthenia Gravis Treatment by End-Use - Hospitals, Clinics and Other End-Uses - Independent Analysis of Annual Sales in US$ Thousand for the Years 2023 through 2030 and % CAGR
- TABLE 105: Asia-Pacific Historic Review for Myasthenia Gravis Treatment by End-Use - Hospitals, Clinics and Other End-Uses Markets - Independent Analysis of Annual Sales in US$ Thousand for Years 2014 through 2022 and % CAGR
- TABLE 106: Asia-Pacific 16-Year Perspective for Myasthenia Gravis Treatment by End-Use - Percentage Breakdown of Value Sales for Hospitals, Clinics and Other End-Uses for the Years 2014, 2024 & 2030
- AUSTRALIA
- Myasthenia Gravis Treatment Market Presence - Strong/Active/Niche/Trivial - Key Competitors in Australia for 2024 (E)
- TABLE 107: Australia Recent Past, Current & Future Analysis for Myasthenia Gravis Treatment by Treatment Type - Medication, Surgery and Other Treatment Types - Independent Analysis of Annual Sales in US$ Thousand for the Years 2023 through 2030 and % CAGR
- TABLE 108: Australia Historic Review for Myasthenia Gravis Treatment by Treatment Type - Medication, Surgery and Other Treatment Types Markets - Independent Analysis of Annual Sales in US$ Thousand for Years 2014 through 2022 and % CAGR
- TABLE 109: Australia 16-Year Perspective for Myasthenia Gravis Treatment by Treatment Type - Percentage Breakdown of Value Sales for Medication, Surgery and Other Treatment Types for the Years 2014, 2024 & 2030
- TABLE 110: Australia Recent Past, Current & Future Analysis for Myasthenia Gravis Treatment by End-Use - Hospitals, Clinics and Other End-Uses - Independent Analysis of Annual Sales in US$ Thousand for the Years 2023 through 2030 and % CAGR
- TABLE 111: Australia Historic Review for Myasthenia Gravis Treatment by End-Use - Hospitals, Clinics and Other End-Uses Markets - Independent Analysis of Annual Sales in US$ Thousand for Years 2014 through 2022 and % CAGR
- TABLE 112: Australia 16-Year Perspective for Myasthenia Gravis Treatment by End-Use - Percentage Breakdown of Value Sales for Hospitals, Clinics and Other End-Uses for the Years 2014, 2024 & 2030
- INDIA
- Myasthenia Gravis Treatment Market Presence - Strong/Active/Niche/Trivial - Key Competitors in India for 2024 (E)
- TABLE 113: India Recent Past, Current & Future Analysis for Myasthenia Gravis Treatment by Treatment Type - Medication, Surgery and Other Treatment Types - Independent Analysis of Annual Sales in US$ Thousand for the Years 2023 through 2030 and % CAGR
- TABLE 114: India Historic Review for Myasthenia Gravis Treatment by Treatment Type - Medication, Surgery and Other Treatment Types Markets - Independent Analysis of Annual Sales in US$ Thousand for Years 2014 through 2022 and % CAGR
- TABLE 115: India 16-Year Perspective for Myasthenia Gravis Treatment by Treatment Type - Percentage Breakdown of Value Sales for Medication, Surgery and Other Treatment Types for the Years 2014, 2024 & 2030
- TABLE 116: India Recent Past, Current & Future Analysis for Myasthenia Gravis Treatment by End-Use - Hospitals, Clinics and Other End-Uses - Independent Analysis of Annual Sales in US$ Thousand for the Years 2023 through 2030 and % CAGR
- TABLE 117: India Historic Review for Myasthenia Gravis Treatment by End-Use - Hospitals, Clinics and Other End-Uses Markets - Independent Analysis of Annual Sales in US$ Thousand for Years 2014 through 2022 and % CAGR
- TABLE 118: India 16-Year Perspective for Myasthenia Gravis Treatment by End-Use - Percentage Breakdown of Value Sales for Hospitals, Clinics and Other End-Uses for the Years 2014, 2024 & 2030
- SOUTH KOREA
- TABLE 119: South Korea Recent Past, Current & Future Analysis for Myasthenia Gravis Treatment by Treatment Type - Medication, Surgery and Other Treatment Types - Independent Analysis of Annual Sales in US$ Thousand for the Years 2023 through 2030 and % CAGR
- TABLE 120: South Korea Historic Review for Myasthenia Gravis Treatment by Treatment Type - Medication, Surgery and Other Treatment Types Markets - Independent Analysis of Annual Sales in US$ Thousand for Years 2014 through 2022 and % CAGR
- TABLE 121: South Korea 16-Year Perspective for Myasthenia Gravis Treatment by Treatment Type - Percentage Breakdown of Value Sales for Medication, Surgery and Other Treatment Types for the Years 2014, 2024 & 2030
- TABLE 122: South Korea Recent Past, Current & Future Analysis for Myasthenia Gravis Treatment by End-Use - Hospitals, Clinics and Other End-Uses - Independent Analysis of Annual Sales in US$ Thousand for the Years 2023 through 2030 and % CAGR
- TABLE 123: South Korea Historic Review for Myasthenia Gravis Treatment by End-Use - Hospitals, Clinics and Other End-Uses Markets - Independent Analysis of Annual Sales in US$ Thousand for Years 2014 through 2022 and % CAGR
- TABLE 124: South Korea 16-Year Perspective for Myasthenia Gravis Treatment by End-Use - Percentage Breakdown of Value Sales for Hospitals, Clinics and Other End-Uses for the Years 2014, 2024 & 2030
- REST OF ASIA-PACIFIC
- TABLE 125: Rest of Asia-Pacific Recent Past, Current & Future Analysis for Myasthenia Gravis Treatment by Treatment Type - Medication, Surgery and Other Treatment Types - Independent Analysis of Annual Sales in US$ Thousand for the Years 2023 through 2030 and % CAGR
- TABLE 126: Rest of Asia-Pacific Historic Review for Myasthenia Gravis Treatment by Treatment Type - Medication, Surgery and Other Treatment Types Markets - Independent Analysis of Annual Sales in US$ Thousand for Years 2014 through 2022 and % CAGR
- TABLE 127: Rest of Asia-Pacific 16-Year Perspective for Myasthenia Gravis Treatment by Treatment Type - Percentage Breakdown of Value Sales for Medication, Surgery and Other Treatment Types for the Years 2014, 2024 & 2030
- TABLE 128: Rest of Asia-Pacific Recent Past, Current & Future Analysis for Myasthenia Gravis Treatment by End-Use - Hospitals, Clinics and Other End-Uses - Independent Analysis of Annual Sales in US$ Thousand for the Years 2023 through 2030 and % CAGR
- TABLE 129: Rest of Asia-Pacific Historic Review for Myasthenia Gravis Treatment by End-Use - Hospitals, Clinics and Other End-Uses Markets - Independent Analysis of Annual Sales in US$ Thousand for Years 2014 through 2022 and % CAGR
- TABLE 130: Rest of Asia-Pacific 16-Year Perspective for Myasthenia Gravis Treatment by End-Use - Percentage Breakdown of Value Sales for Hospitals, Clinics and Other End-Uses for the Years 2014, 2024 & 2030
- LATIN AMERICA
- Myasthenia Gravis Treatment Market Presence - Strong/Active/Niche/Trivial - Key Competitors in Latin America for 2024 (E)
- TABLE 131: Latin America Recent Past, Current & Future Analysis for Myasthenia Gravis Treatment by Geographic Region - Argentina, Brazil, Mexico and Rest of Latin America Markets - Independent Analysis of Annual Sales in US$ Thousand for Years 2023 through 2030 and % CAGR
- TABLE 132: Latin America Historic Review for Myasthenia Gravis Treatment by Geographic Region - Argentina, Brazil, Mexico and Rest of Latin America Markets - Independent Analysis of Annual Sales in US$ Thousand for Years 2014 through 2022 and % CAGR
- TABLE 133: Latin America 16-Year Perspective for Myasthenia Gravis Treatment by Geographic Region - Percentage Breakdown of Value Sales for Argentina, Brazil, Mexico and Rest of Latin America Markets for Years 2014, 2024 & 2030
- TABLE 134: Latin America Recent Past, Current & Future Analysis for Myasthenia Gravis Treatment by Treatment Type - Medication, Surgery and Other Treatment Types - Independent Analysis of Annual Sales in US$ Thousand for the Years 2023 through 2030 and % CAGR
- TABLE 135: Latin America Historic Review for Myasthenia Gravis Treatment by Treatment Type - Medication, Surgery and Other Treatment Types Markets - Independent Analysis of Annual Sales in US$ Thousand for Years 2014 through 2022 and % CAGR
- TABLE 136: Latin America 16-Year Perspective for Myasthenia Gravis Treatment by Treatment Type - Percentage Breakdown of Value Sales for Medication, Surgery and Other Treatment Types for the Years 2014, 2024 & 2030
- TABLE 137: Latin America Recent Past, Current & Future Analysis for Myasthenia Gravis Treatment by End-Use - Hospitals, Clinics and Other End-Uses - Independent Analysis of Annual Sales in US$ Thousand for the Years 2023 through 2030 and % CAGR
- TABLE 138: Latin America Historic Review for Myasthenia Gravis Treatment by End-Use - Hospitals, Clinics and Other End-Uses Markets - Independent Analysis of Annual Sales in US$ Thousand for Years 2014 through 2022 and % CAGR
- TABLE 139: Latin America 16-Year Perspective for Myasthenia Gravis Treatment by End-Use - Percentage Breakdown of Value Sales for Hospitals, Clinics and Other End-Uses for the Years 2014, 2024 & 2030
- ARGENTINA
- TABLE 140: Argentina Recent Past, Current & Future Analysis for Myasthenia Gravis Treatment by Treatment Type - Medication, Surgery and Other Treatment Types - Independent Analysis of Annual Sales in US$ Thousand for the Years 2023 through 2030 and % CAGR
- TABLE 141: Argentina Historic Review for Myasthenia Gravis Treatment by Treatment Type - Medication, Surgery and Other Treatment Types Markets - Independent Analysis of Annual Sales in US$ Thousand for Years 2014 through 2022 and % CAGR
- TABLE 142: Argentina 16-Year Perspective for Myasthenia Gravis Treatment by Treatment Type - Percentage Breakdown of Value Sales for Medication, Surgery and Other Treatment Types for the Years 2014, 2024 & 2030
- TABLE 143: Argentina Recent Past, Current & Future Analysis for Myasthenia Gravis Treatment by End-Use - Hospitals, Clinics and Other End-Uses - Independent Analysis of Annual Sales in US$ Thousand for the Years 2023 through 2030 and % CAGR
- TABLE 144: Argentina Historic Review for Myasthenia Gravis Treatment by End-Use - Hospitals, Clinics and Other End-Uses Markets - Independent Analysis of Annual Sales in US$ Thousand for Years 2014 through 2022 and % CAGR
- TABLE 145: Argentina 16-Year Perspective for Myasthenia Gravis Treatment by End-Use - Percentage Breakdown of Value Sales for Hospitals, Clinics and Other End-Uses for the Years 2014, 2024 & 2030
- BRAZIL
- TABLE 146: Brazil Recent Past, Current & Future Analysis for Myasthenia Gravis Treatment by Treatment Type - Medication, Surgery and Other Treatment Types - Independent Analysis of Annual Sales in US$ Thousand for the Years 2023 through 2030 and % CAGR
- TABLE 147: Brazil Historic Review for Myasthenia Gravis Treatment by Treatment Type - Medication, Surgery and Other Treatment Types Markets - Independent Analysis of Annual Sales in US$ Thousand for Years 2014 through 2022 and % CAGR
- TABLE 148: Brazil 16-Year Perspective for Myasthenia Gravis Treatment by Treatment Type - Percentage Breakdown of Value Sales for Medication, Surgery and Other Treatment Types for the Years 2014, 2024 & 2030
- TABLE 149: Brazil Recent Past, Current & Future Analysis for Myasthenia Gravis Treatment by End-Use - Hospitals, Clinics and Other End-Uses - Independent Analysis of Annual Sales in US$ Thousand for the Years 2023 through 2030 and % CAGR
- TABLE 150: Brazil Historic Review for Myasthenia Gravis Treatment by End-Use - Hospitals, Clinics and Other End-Uses Markets - Independent Analysis of Annual Sales in US$ Thousand for Years 2014 through 2022 and % CAGR
- TABLE 151: Brazil 16-Year Perspective for Myasthenia Gravis Treatment by End-Use - Percentage Breakdown of Value Sales for Hospitals, Clinics and Other End-Uses for the Years 2014, 2024 & 2030
- MEXICO
- TABLE 152: Mexico Recent Past, Current & Future Analysis for Myasthenia Gravis Treatment by Treatment Type - Medication, Surgery and Other Treatment Types - Independent Analysis of Annual Sales in US$ Thousand for the Years 2023 through 2030 and % CAGR
- TABLE 153: Mexico Historic Review for Myasthenia Gravis Treatment by Treatment Type - Medication, Surgery and Other Treatment Types Markets - Independent Analysis of Annual Sales in US$ Thousand for Years 2014 through 2022 and % CAGR
- TABLE 154: Mexico 16-Year Perspective for Myasthenia Gravis Treatment by Treatment Type - Percentage Breakdown of Value Sales for Medication, Surgery and Other Treatment Types for the Years 2014, 2024 & 2030
- TABLE 155: Mexico Recent Past, Current & Future Analysis for Myasthenia Gravis Treatment by End-Use - Hospitals, Clinics and Other End-Uses - Independent Analysis of Annual Sales in US$ Thousand for the Years 2023 through 2030 and % CAGR
- TABLE 156: Mexico Historic Review for Myasthenia Gravis Treatment by End-Use - Hospitals, Clinics and Other End-Uses Markets - Independent Analysis of Annual Sales in US$ Thousand for Years 2014 through 2022 and % CAGR
- TABLE 157: Mexico 16-Year Perspective for Myasthenia Gravis Treatment by End-Use - Percentage Breakdown of Value Sales for Hospitals, Clinics and Other End-Uses for the Years 2014, 2024 & 2030
- REST OF LATIN AMERICA
- TABLE 158: Rest of Latin America Recent Past, Current & Future Analysis for Myasthenia Gravis Treatment by Treatment Type - Medication, Surgery and Other Treatment Types - Independent Analysis of Annual Sales in US$ Thousand for the Years 2023 through 2030 and % CAGR
- TABLE 159: Rest of Latin America Historic Review for Myasthenia Gravis Treatment by Treatment Type - Medication, Surgery and Other Treatment Types Markets - Independent Analysis of Annual Sales in US$ Thousand for Years 2014 through 2022 and % CAGR
- TABLE 160: Rest of Latin America 16-Year Perspective for Myasthenia Gravis Treatment by Treatment Type - Percentage Breakdown of Value Sales for Medication, Surgery and Other Treatment Types for the Years 2014, 2024 & 2030
- TABLE 161: Rest of Latin America Recent Past, Current & Future Analysis for Myasthenia Gravis Treatment by End-Use - Hospitals, Clinics and Other End-Uses - Independent Analysis of Annual Sales in US$ Thousand for the Years 2023 through 2030 and % CAGR
- TABLE 162: Rest of Latin America Historic Review for Myasthenia Gravis Treatment by End-Use - Hospitals, Clinics and Other End-Uses Markets - Independent Analysis of Annual Sales in US$ Thousand for Years 2014 through 2022 and % CAGR
- TABLE 163: Rest of Latin America 16-Year Perspective for Myasthenia Gravis Treatment by End-Use - Percentage Breakdown of Value Sales for Hospitals, Clinics and Other End-Uses for the Years 2014, 2024 & 2030
- MIDDLE EAST
- Myasthenia Gravis Treatment Market Presence - Strong/Active/Niche/Trivial - Key Competitors in Middle East for 2024 (E)
- TABLE 164: Middle East Recent Past, Current & Future Analysis for Myasthenia Gravis Treatment by Geographic Region - Iran, Israel, Saudi Arabia, UAE and Rest of Middle East Markets - Independent Analysis of Annual Sales in US$ Thousand for Years 2023 through 2030 and % CAGR
- TABLE 165: Middle East Historic Review for Myasthenia Gravis Treatment by Geographic Region - Iran, Israel, Saudi Arabia, UAE and Rest of Middle East Markets - Independent Analysis of Annual Sales in US$ Thousand for Years 2014 through 2022 and % CAGR
- TABLE 166: Middle East 16-Year Perspective for Myasthenia Gravis Treatment by Geographic Region - Percentage Breakdown of Value Sales for Iran, Israel, Saudi Arabia, UAE and Rest of Middle East Markets for Years 2014, 2024 & 2030
- TABLE 167: Middle East Recent Past, Current & Future Analysis for Myasthenia Gravis Treatment by Treatment Type - Medication, Surgery and Other Treatment Types - Independent Analysis of Annual Sales in US$ Thousand for the Years 2023 through 2030 and % CAGR
- TABLE 168: Middle East Historic Review for Myasthenia Gravis Treatment by Treatment Type - Medication, Surgery and Other Treatment Types Markets - Independent Analysis of Annual Sales in US$ Thousand for Years 2014 through 2022 and % CAGR
- TABLE 169: Middle East 16-Year Perspective for Myasthenia Gravis Treatment by Treatment Type - Percentage Breakdown of Value Sales for Medication, Surgery and Other Treatment Types for the Years 2014, 2024 & 2030
- TABLE 170: Middle East Recent Past, Current & Future Analysis for Myasthenia Gravis Treatment by End-Use - Hospitals, Clinics and Other End-Uses - Independent Analysis of Annual Sales in US$ Thousand for the Years 2023 through 2030 and % CAGR
- TABLE 171: Middle East Historic Review for Myasthenia Gravis Treatment by End-Use - Hospitals, Clinics and Other End-Uses Markets - Independent Analysis of Annual Sales in US$ Thousand for Years 2014 through 2022 and % CAGR
- TABLE 172: Middle East 16-Year Perspective for Myasthenia Gravis Treatment by End-Use - Percentage Breakdown of Value Sales for Hospitals, Clinics and Other End-Uses for the Years 2014, 2024 & 2030
- IRAN
- TABLE 173: Iran Recent Past, Current & Future Analysis for Myasthenia Gravis Treatment by Treatment Type - Medication, Surgery and Other Treatment Types - Independent Analysis of Annual Sales in US$ Thousand for the Years 2023 through 2030 and % CAGR
- TABLE 174: Iran Historic Review for Myasthenia Gravis Treatment by Treatment Type - Medication, Surgery and Other Treatment Types Markets - Independent Analysis of Annual Sales in US$ Thousand for Years 2014 through 2022 and % CAGR
- TABLE 175: Iran 16-Year Perspective for Myasthenia Gravis Treatment by Treatment Type - Percentage Breakdown of Value Sales for Medication, Surgery and Other Treatment Types for the Years 2014, 2024 & 2030
- TABLE 176: Iran Recent Past, Current & Future Analysis for Myasthenia Gravis Treatment by End-Use - Hospitals, Clinics and Other End-Uses - Independent Analysis of Annual Sales in US$ Thousand for the Years 2023 through 2030 and % CAGR
- TABLE 177: Iran Historic Review for Myasthenia Gravis Treatment by End-Use - Hospitals, Clinics and Other End-Uses Markets - Independent Analysis of Annual Sales in US$ Thousand for Years 2014 through 2022 and % CAGR
- TABLE 178: Iran 16-Year Perspective for Myasthenia Gravis Treatment by End-Use - Percentage Breakdown of Value Sales for Hospitals, Clinics and Other End-Uses for the Years 2014, 2024 & 2030
- ISRAEL
- TABLE 179: Israel Recent Past, Current & Future Analysis for Myasthenia Gravis Treatment by Treatment Type - Medication, Surgery and Other Treatment Types - Independent Analysis of Annual Sales in US$ Thousand for the Years 2023 through 2030 and % CAGR
- TABLE 180: Israel Historic Review for Myasthenia Gravis Treatment by Treatment Type - Medication, Surgery and Other Treatment Types Markets - Independent Analysis of Annual Sales in US$ Thousand for Years 2014 through 2022 and % CAGR
- TABLE 181: Israel 16-Year Perspective for Myasthenia Gravis Treatment by Treatment Type - Percentage Breakdown of Value Sales for Medication, Surgery and Other Treatment Types for the Years 2014, 2024 & 2030
- TABLE 182: Israel Recent Past, Current & Future Analysis for Myasthenia Gravis Treatment by End-Use - Hospitals, Clinics and Other End-Uses - Independent Analysis of Annual Sales in US$ Thousand for the Years 2023 through 2030 and % CAGR
- TABLE 183: Israel Historic Review for Myasthenia Gravis Treatment by End-Use - Hospitals, Clinics and Other End-Uses Markets - Independent Analysis of Annual Sales in US$ Thousand for Years 2014 through 2022 and % CAGR
- TABLE 184: Israel 16-Year Perspective for Myasthenia Gravis Treatment by End-Use - Percentage Breakdown of Value Sales for Hospitals, Clinics and Other End-Uses for the Years 2014, 2024 & 2030
- SAUDI ARABIA
- TABLE 185: Saudi Arabia Recent Past, Current & Future Analysis for Myasthenia Gravis Treatment by Treatment Type - Medication, Surgery and Other Treatment Types - Independent Analysis of Annual Sales in US$ Thousand for the Years 2023 through 2030 and % CAGR
- TABLE 186: Saudi Arabia Historic Review for Myasthenia Gravis Treatment by Treatment Type - Medication, Surgery and Other Treatment Types Markets - Independent Analysis of Annual Sales in US$ Thousand for Years 2014 through 2022 and % CAGR
- TABLE 187: Saudi Arabia 16-Year Perspective for Myasthenia Gravis Treatment by Treatment Type - Percentage Breakdown of Value Sales for Medication, Surgery and Other Treatment Types for the Years 2014, 2024 & 2030
- TABLE 188: Saudi Arabia Recent Past, Current & Future Analysis for Myasthenia Gravis Treatment by End-Use - Hospitals, Clinics and Other End-Uses - Independent Analysis of Annual Sales in US$ Thousand for the Years 2023 through 2030 and % CAGR
- TABLE 189: Saudi Arabia Historic Review for Myasthenia Gravis Treatment by End-Use - Hospitals, Clinics and Other End-Uses Markets - Independent Analysis of Annual Sales in US$ Thousand for Years 2014 through 2022 and % CAGR
- TABLE 190: Saudi Arabia 16-Year Perspective for Myasthenia Gravis Treatment by End-Use - Percentage Breakdown of Value Sales for Hospitals, Clinics and Other End-Uses for the Years 2014, 2024 & 2030
- UNITED ARAB EMIRATES
- TABLE 191: UAE Recent Past, Current & Future Analysis for Myasthenia Gravis Treatment by Treatment Type - Medication, Surgery and Other Treatment Types - Independent Analysis of Annual Sales in US$ Thousand for the Years 2023 through 2030 and % CAGR
- TABLE 192: UAE Historic Review for Myasthenia Gravis Treatment by Treatment Type - Medication, Surgery and Other Treatment Types Markets - Independent Analysis of Annual Sales in US$ Thousand for Years 2014 through 2022 and % CAGR
- TABLE 193: UAE 16-Year Perspective for Myasthenia Gravis Treatment by Treatment Type - Percentage Breakdown of Value Sales for Medication, Surgery and Other Treatment Types for the Years 2014, 2024 & 2030
- TABLE 194: UAE Recent Past, Current & Future Analysis for Myasthenia Gravis Treatment by End-Use - Hospitals, Clinics and Other End-Uses - Independent Analysis of Annual Sales in US$ Thousand for the Years 2023 through 2030 and % CAGR
- TABLE 195: UAE Historic Review for Myasthenia Gravis Treatment by End-Use - Hospitals, Clinics and Other End-Uses Markets - Independent Analysis of Annual Sales in US$ Thousand for Years 2014 through 2022 and % CAGR
- TABLE 196: UAE 16-Year Perspective for Myasthenia Gravis Treatment by End-Use - Percentage Breakdown of Value Sales for Hospitals, Clinics and Other End-Uses for the Years 2014, 2024 & 2030
- REST OF MIDDLE EAST
- TABLE 197: Rest of Middle East Recent Past, Current & Future Analysis for Myasthenia Gravis Treatment by Treatment Type - Medication, Surgery and Other Treatment Types - Independent Analysis of Annual Sales in US$ Thousand for the Years 2023 through 2030 and % CAGR
- TABLE 198: Rest of Middle East Historic Review for Myasthenia Gravis Treatment by Treatment Type - Medication, Surgery and Other Treatment Types Markets - Independent Analysis of Annual Sales in US$ Thousand for Years 2014 through 2022 and % CAGR
- TABLE 199: Rest of Middle East 16-Year Perspective for Myasthenia Gravis Treatment by Treatment Type - Percentage Breakdown of Value Sales for Medication, Surgery and Other Treatment Types for the Years 2014, 2024 & 2030
- TABLE 200: Rest of Middle East Recent Past, Current & Future Analysis for Myasthenia Gravis Treatment by End-Use - Hospitals, Clinics and Other End-Uses - Independent Analysis of Annual Sales in US$ Thousand for the Years 2023 through 2030 and % CAGR
- TABLE 201: Rest of Middle East Historic Review for Myasthenia Gravis Treatment by End-Use - Hospitals, Clinics and Other End-Uses Markets - Independent Analysis of Annual Sales in US$ Thousand for Years 2014 through 2022 and % CAGR
- TABLE 202: Rest of Middle East 16-Year Perspective for Myasthenia Gravis Treatment by End-Use - Percentage Breakdown of Value Sales for Hospitals, Clinics and Other End-Uses for the Years 2014, 2024 & 2030
- AFRICA
- Myasthenia Gravis Treatment Market Presence - Strong/Active/Niche/Trivial - Key Competitors in Africa for 2024 (E)
- TABLE 203: Africa Recent Past, Current & Future Analysis for Myasthenia Gravis Treatment by Treatment Type - Medication, Surgery and Other Treatment Types - Independent Analysis of Annual Sales in US$ Thousand for the Years 2023 through 2030 and % CAGR
- TABLE 204: Africa Historic Review for Myasthenia Gravis Treatment by Treatment Type - Medication, Surgery and Other Treatment Types Markets - Independent Analysis of Annual Sales in US$ Thousand for Years 2014 through 2022 and % CAGR
- TABLE 205: Africa 16-Year Perspective for Myasthenia Gravis Treatment by Treatment Type - Percentage Breakdown of Value Sales for Medication, Surgery and Other Treatment Types for the Years 2014, 2024 & 2030
- TABLE 206: Africa Recent Past, Current & Future Analysis for Myasthenia Gravis Treatment by End-Use - Hospitals, Clinics and Other End-Uses - Independent Analysis of Annual Sales in US$ Thousand for the Years 2023 through 2030 and % CAGR
- TABLE 207: Africa Historic Review for Myasthenia Gravis Treatment by End-Use - Hospitals, Clinics and Other End-Uses Markets - Independent Analysis of Annual Sales in US$ Thousand for Years 2014 through 2022 and % CAGR
- TABLE 208: Africa 16-Year Perspective for Myasthenia Gravis Treatment by End-Use - Percentage Breakdown of Value Sales for Hospitals, Clinics and Other End-Uses for the Years 2014, 2024 & 2030
