|
|
市場調査レポート
商品コード
1768263
コンタクトレンズソリューションの世界市場Contact Lens Solutions |
||||||
|
|||||||
適宜更新あり
|
|||||||

| コンタクトレンズソリューションの世界市場 |
|
出版日: 2025年07月11日
発行: Market Glass, Inc. (Formerly Global Industry Analysts, Inc.)
ページ情報: 英文 367 Pages
納期: 即日から翌営業日
|

全表示
- 概要
- 目次
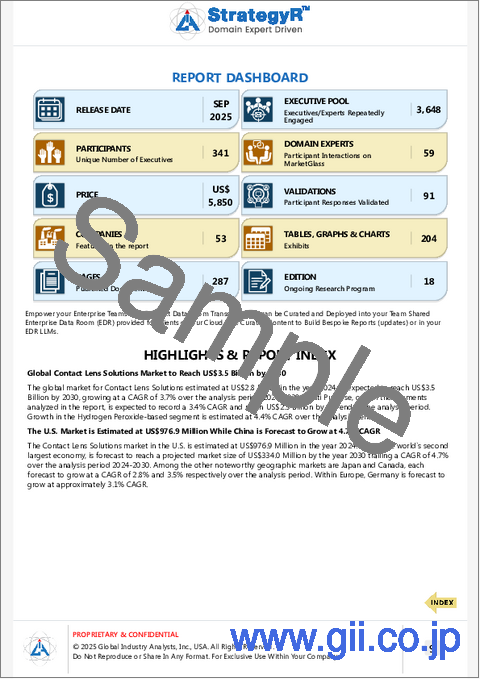
コンタクトレンズソリューションの世界市場は2030年までに35億米ドルに達する
2024年に28億米ドルと推定されるコンタクトレンズソリューションの世界市場は、2024年から2030年にかけてCAGR 3.7%で成長し、2030年には35億米ドルに達すると予測されます。本レポートで分析したセグメントの1つであるマルチパーパスは、CAGR 3.4%を記録し、分析期間終了時には25億米ドルに達すると予測されます。過酸化水素ベースのセグメントの成長率は、分析期間でCAGR 4.4%と推定されます。
米国市場は9億7,690万米ドルと推定、中国はCAGR4.7%で成長予測
米国のコンタクトレンズソリューション市場は、2024年に9億7,690万米ドルと推定されます。世界第2位の経済大国である中国は、2030年までに3億3,400万米ドルの市場規模に達すると予測され、分析期間2024-2030年のCAGRは4.7%です。その他の注目すべき地域別市場としては、日本とカナダがあり、分析期間中のCAGRはそれぞれ2.8%と3.5%と予測されています。欧州では、ドイツがCAGR 3.1%で成長すると予測されています。
世界のコンタクトレンズソリューション市場- 主要動向と促進要因のまとめ
コンタクトレンズソリューションとは何か、なぜレンズケアに不可欠なのか?
コンタクトレンズソリューションは、コンタクトレンズケアのルーチンに不可欠なコンポーネントであり、コンタクトレンズの清潔さ、消毒、快適さを確保するために不可欠です。これらの溶液は、コンタクトレンズの洗浄、すすぎ、消毒、保存を含む複数の機能を果たします。レンズから微生物や沈着物を除去するコンタクトレンズ溶液の効果は、眼感染症を予防し、レンズを安全で快適に装用するために非常に重要です。溶液にはいくつかの製品タイプがあり、1つの製品で複数の工程を行うことができる便利な多目的溶液や、強力な消毒能力で知られる過酸化水素ベースの溶液などがあります。これらの溶液を適切に使用することは、目の健康と装用者の視力を維持するために不可欠な、レンズの水分補給と完全性の維持に役立つため、非常に重要です。
製品処方の進歩により、コンタクトレンズケアはどのように向上しましたか?
コンタクトレンズソリューションの処方は、化学の進歩や眼生理学のより深い理解により、大きく進化しました。最新の溶液は、洗浄と消毒だけでなく、特に敏感な目の人や長時間レンズを装用する人のために、レンズの快適性を高めるように設計されています。革新的な技術には、レンズの保湿を助ける水和剤の配合が含まれ、快適性を向上させ、ドライアイの症状を軽減します。さらに、防腐剤フリーのソリューションの開発は、時に刺激や不快感を引き起こす可能性のある防腐剤に敏感なユーザーのニーズに対応し、大きな進歩を遂げました。このようなコンタクトレンズソリューションの改良は、より幅広い消費者のニーズに応えるものであり、業界が安全性と使用者の快適性を重視していることを強調するものです。
コンタクトレンズソリューション市場において、規制遵守はどのような役割を果たしていますか?
規制遵守はコンタクトレンズ液市場において重要な要素であり、製品の処方、表示、販売方法を規定しています。米国食品医薬品局(FDA)や欧州医薬品庁(EMA)などの規制機関は、コンタクトレンズソリューションの有効性と安全性を保証するために厳しい基準を設定しています。これらの規制は、消毒能力、保存安定性、生体適合性についての厳格な試験を要求しています。これらの基準を満たすことにより、消費者は製品が安全に使用でき、コンタクトレンズを清潔に保つのに効果的であることを保証されます。また、厳格な承認プロセスにより、メーカーはこれらの規制要件を満たし、または上回るよう、絶えず処方を革新・改善し、製品の安全性と性能を高めています。
コンタクトレンズソリューション市場の成長の原動力は?
コンタクトレンズソリューション市場の成長は、コンタクトレンズの使用を必要とする近視やその他の屈折異常の世界の有病率の増加など、いくつかの要因によって牽引されています。コンタクトレンズ装用者の増加に伴い、レンズケア製品の需要も増加しています。シリコーンハイドロゲルレンズの開発など、コンタクトレンズの素材やデザインにおける技術的進歩も市場の成長に寄与しています。これらのレンズは、その特殊な親水性を維持するために特定のタイプのケア溶液を必要とするため、専用製品の需要を刺激しています。さらに、消費者の行動はより便利で安全な製品へとシフトしており、快適性を高め、眼刺激のリスクを低減する多目的で防腐剤フリーのソリューションへの嗜好が高まっています。最後に、目の健康と適切なレンズケアに関する消費者の意識の高まりが、高品質なコンタクトレンズソリューションの需要をさらに高めています。消費者ニーズ、技術進歩、健康動向のダイナミックな相互作用を反映し、これらの要因が総体的にこの市場の堅調な拡大に寄与しています。
セグメント
セグメント(多目的、過酸化水素ベース)、流通チャネル(小売、アイケア専門家、オンライン)
調査対象企業の例
- Johnson & Johnson Services, Inc.
- Cardinal Health, Inc.
- Rohto Pharmaceutical Co., Ltd.
- Walgreens Boots Alliance, Inc.
- OCuSOFT, Inc.
- Boots UK Limited
- CooperVision, Inc.
- Ginko International Co., Ltd.
- Menicon Co., Ltd.
- Sensimed AG
- GrandVision
- Bausch Health Companies Inc.
- Lenskart Solutions Pvt. Ltd.
AI統合
Global Industry Analystsは、有効な専門家コンテンツとAIツールによって、市場情報と競合情報を変革しています。
Global Industry Analystsは、一般的なLLMや業界別SLMのクエリに従う代わりに、ビデオ記録、ブログ、検索エンジン調査、大量の企業、製品/サービス、市場データなど、世界中の専門家から収集したコンテンツのリポジトリを構築しました。
関税影響係数
Global Industry Analystsは、本社の国、製造拠点、輸出入(完成品とOEM)に基づく企業の競争力の変化を予測しています。この複雑で多面的な市場力学は、売上原価(COGS)の増加、収益性の低下、サプライチェーンの再構築など、ミクロおよびマクロの市場力学の中でも特に競合他社に影響を与える見込みです。
目次
第1章 調査手法
第2章 エグゼクティブサマリー
- 市場概要
- 主要企業
- 市場動向と促進要因
- 世界市場の見通し
第3章 市場分析
- 米国
- カナダ
- 日本
- 中国
- 欧州
- フランス
- ドイツ
- イタリア
- 英国
- スペイン
- ロシア
- その他欧州
- アジア太平洋
- オーストラリア
- インド
- 韓国
- その他アジア太平洋地域
- ラテンアメリカ
- アルゼンチン
- ブラジル
- メキシコ
- その他ラテンアメリカ
- 中東
- イラン
- イスラエル
- サウジアラビア
- アラブ首長国連邦
- その他中東
- アフリカ
第4章 競合
Global Contact Lens Solutions Market to Reach US$3.5 Billion by 2030
The global market for Contact Lens Solutions estimated at US$2.8 Billion in the year 2024, is expected to reach US$3.5 Billion by 2030, growing at a CAGR of 3.7% over the analysis period 2024-2030. Multi Purpose, one of the segments analyzed in the report, is expected to record a 3.4% CAGR and reach US$2.5 Billion by the end of the analysis period. Growth in the Hydrogen Peroxide-based segment is estimated at 4.4% CAGR over the analysis period.
The U.S. Market is Estimated at US$976.9 Million While China is Forecast to Grow at 4.7% CAGR
The Contact Lens Solutions market in the U.S. is estimated at US$976.9 Million in the year 2024. China, the world's second largest economy, is forecast to reach a projected market size of US$334.0 Million by the year 2030 trailing a CAGR of 4.7% over the analysis period 2024-2030. Among the other noteworthy geographic markets are Japan and Canada, each forecast to grow at a CAGR of 2.8% and 3.5% respectively over the analysis period. Within Europe, Germany is forecast to grow at approximately 3.1% CAGR.
Global Contact Lens Solutions Market - Key Trends & Drivers Summarized
What Are Contact Lens Solutions and Why Are They Integral to Lens Care?
Contact lens solutions are vital components in the routine of contact lens care, essential for ensuring the cleanliness, disinfection, and comfort of contact lenses. These solutions perform multiple functions including cleaning, rinsing, disinfecting, and storing contact lenses. The effectiveness of a contact lens solution in removing microorganisms and deposits from lenses is crucial for preventing eye infections and ensuring that the lenses are safe and comfortable to wear. There are several types of solutions available, including multipurpose solutions that offer convenience by combining several steps in one product, and hydrogen peroxide-based solutions known for their robust disinfection capabilities. Proper use of these solutions is critical, as it helps maintain the lens’ hydration and integrity, which are essential for preserving the eye’s health and the wearer's vision.
How Have Advances in Product Formulation Enhanced Contact Lens Care?
The formulation of contact lens solutions has evolved significantly, driven by advances in chemistry and a better understanding of ocular physiology. Modern solutions are designed not only to clean and disinfect but also to enhance lens comfort, particularly for individuals with sensitive eyes or those who wear their lenses for extended periods. Innovations include the incorporation of hydrating agents that help lenses retain moisture, thus improving comfort and reducing dry eye symptoms. Additionally, the development of preservative-free solutions marks a significant advancement, addressing the needs of users who are sensitive to preservatives, which can sometimes cause irritation and discomfort. These improvements in contact lens solutions help cater to a broader range of consumer needs, emphasizing the industry's focus on safety and user comfort.
What Role Does Regulatory Compliance Play in the Market for Contact Lens Solutions?
Regulatory compliance is a critical factor in the contact lens solution market, governing how these products are formulated, labeled, and marketed. Regulatory bodies such as the U.S. Food and Drug Administration (FDA) and the European Medicines Agency (EMA) set stringent standards to ensure the efficacy and safety of contact lens solutions. These regulations require rigorous testing for disinfection capabilities, shelf stability, and biocompatibility. Compliance with these standards assures consumers that the products are safe for use and effective in maintaining the cleanliness of their contact lenses. The rigorous approval process also drives manufacturers to continually innovate and improve their formulations to meet or exceed these regulatory requirements, thereby enhancing product safety and performance.
What Drives the Growth in the Contact Lens Solutions Market?
The growth in the contact lens solutions market is driven by several factors, including the increasing global prevalence of myopia and other refractive errors that necessitate the use of contact lenses. As the number of contact lens wearers grows, so does the demand for lens care products. Technological advancements in contact lens materials and design, such as the development of silicone hydrogel lenses, have also contributed to market growth. These lenses require specific types of care solutions to maintain their special hydrophilic properties, thereby stimulating demand for specialized products. Additionally, consumer behavior is shifting towards more convenient and safer products, with a growing preference for multipurpose and preservative-free solutions that offer enhanced comfort and reduced risk of eye irritation. Lastly, heightened awareness about eye health and proper lens care practices among consumers further fuels the demand for high-quality contact lens solutions. These factors collectively contribute to the robust expansion of this market, reflecting the dynamic interplay between consumer needs, technological progress, and health trends.
SCOPE OF STUDY:
The report analyzes the Contact Lens Solutions market in terms of units by the following Segments, and Geographic Regions/Countries:
Segments:
Segment (Multi Purpose, Hydrogen Peroxide-based); Distribution Channel (Retail, Eye-Care Professionals, Online)
Geographic Regions/Countries:
World; USA; Canada; Japan; China; Europe; France; Germany; Italy; UK; Spain; Russia; Rest of Europe; Asia-Pacific; Australia; India; South Korea; Rest of Asia-Pacific; Latin America; Argentina; Brazil; Mexico; Rest of Latin America; Middle East; Iran; Israel; Saudi Arabia; UAE; Rest of Middle East; Africa.
Select Competitors (Total 53 Featured) -
- Johnson & Johnson Services, Inc.
- Cardinal Health, Inc.
- Rohto Pharmaceutical Co., Ltd.
- Walgreens Boots Alliance, Inc.
- OCuSOFT, Inc.
- Boots UK Limited
- CooperVision, Inc.
- Ginko International Co., Ltd.
- Menicon Co., Ltd.
- Sensimed AG
- GrandVision
- Bausch Health Companies Inc.
- Lenskart Solutions Pvt. Ltd.
AI INTEGRATIONS
We're transforming market and competitive intelligence with validated expert content and AI tools.
Instead of following the general norm of querying LLMs and Industry-specific SLMs, we built repositories of content curated from domain experts worldwide including video transcripts, blogs, search engines research, and massive amounts of enterprise, product/service, and market data.
TARIFF IMPACT FACTOR
Our new release incorporates impact of tariffs on geographical markets as we predict a shift in competitiveness of companies based on HQ country, manufacturing base, exports and imports (finished goods and OEM). This intricate and multifaceted market reality will impact competitors by increasing the Cost of Goods Sold (COGS), reducing profitability, reconfiguring supply chains, amongst other micro and macro market dynamics.
TABLE OF CONTENTS
I. METHODOLOGY
II. EXECUTIVE SUMMARY
- 1. MARKET OVERVIEW
- Influencer Market Insights
- Tariff Impact on Global Supply Chain Patterns
- Contact Lens Solutions: An Introduction
- Market Outlook
- Multi-Purpose Solutions Account for Major Share, while Hydrogen Peroxide Solutions to Report Improved Growth
- Asia-Pacific to Contribute to Future Growth
- Increasing Adoption of Daily Disposable Contact Lenses Weaken Sales Momentum
- Summary of Major Lens Types
- Expanding Wearer Base for Contact Lenses to Augment Growth
- Breakdown of Contact Lens Users by Gender: 2024
- World Population by Age Group
- Recent Market Activity
- Competition
- Contact Lens Solutions - Global Key Competitors Percentage Market Share in 2025 (E)
- Competitive Market Presence - Strong/Active/Niche/Trivial for Players Worldwide in 2025 (E)
- 2. FOCUS ON SELECT PLAYERS
- 3. MARKET TRENDS & DRIVERS
- New Formulations to Drive Growth
- Companies Focus on New Solutions to Alleviate Contact Lens Discomfort
- New Preservatives and Solutions to Address Sensitivity Issues
- Select Contact Lens Solutions and Their Constituents
- Hydrogen Peroxide-based Solutions Gain Preference Owing to their Higher Disinfection Capability
- Rise in Myopic Population to Drive Growth
- Global World Population with Myopia and High Myopia (in Million): 2000, 2010, 2020, and 2030
- eCommerce and mCommerce Drive Growth Avenues for Contact Lens and Solution Companies
- Urbanization and Improved Middle Class Spending: Megatrends with Significant Implications for Contact Lenses and Solutions Market
- Total Population Worldwide by Urban and Rural Population in Thousands: 1950-2050
- Global Middle Class Population (in Millions) and as a Percentage of Total Population: 2005, 2015, 2025 & 2035
- 4. GLOBAL MARKET PERSPECTIVE
- TABLE 1: World Recent Past, Current & Future Analysis for Contact Lens Solutions by Geographic Region - USA, Canada, Japan, China, Europe, Asia-Pacific, Latin America, Middle East and Africa Markets - Independent Analysis of Annual Sales in US$ Thousand for Years 2024 through 2030 and % CAGR
- TABLE 2: World Historic Review for Contact Lens Solutions by Geographic Region - USA, Canada, Japan, China, Europe, Asia-Pacific, Latin America, Middle East and Africa Markets - Independent Analysis of Annual Sales in US$ Thousand for Years 2014 through 2023 and % CAGR
- TABLE 3: World 16-Year Perspective for Contact Lens Solutions by Geographic Region - Percentage Breakdown of Value Sales for USA, Canada, Japan, China, Europe, Asia-Pacific, Latin America, Middle East and Africa Markets for Years 2014, 2025 & 2030
- TABLE 4: World Recent Past, Current & Future Analysis for Multi Purpose by Geographic Region - USA, Canada, Japan, China, Europe, Asia-Pacific, Latin America, Middle East and Africa Markets - Independent Analysis of Annual Sales in US$ Thousand for Years 2024 through 2030 and % CAGR
- TABLE 5: World Historic Review for Multi Purpose by Geographic Region - USA, Canada, Japan, China, Europe, Asia-Pacific, Latin America, Middle East and Africa Markets - Independent Analysis of Annual Sales in US$ Thousand for Years 2014 through 2023 and % CAGR
- TABLE 6: World 16-Year Perspective for Multi Purpose by Geographic Region - Percentage Breakdown of Value Sales for USA, Canada, Japan, China, Europe, Asia-Pacific, Latin America, Middle East and Africa for Years 2014, 2025 & 2030
- TABLE 7: World Recent Past, Current & Future Analysis for Hydrogen Peroxide-based by Geographic Region - USA, Canada, Japan, China, Europe, Asia-Pacific, Latin America, Middle East and Africa Markets - Independent Analysis of Annual Sales in US$ Thousand for Years 2024 through 2030 and % CAGR
- TABLE 8: World Historic Review for Hydrogen Peroxide-based by Geographic Region - USA, Canada, Japan, China, Europe, Asia-Pacific, Latin America, Middle East and Africa Markets - Independent Analysis of Annual Sales in US$ Thousand for Years 2014 through 2023 and % CAGR
- TABLE 9: World 16-Year Perspective for Hydrogen Peroxide-based by Geographic Region - Percentage Breakdown of Value Sales for USA, Canada, Japan, China, Europe, Asia-Pacific, Latin America, Middle East and Africa for Years 2014, 2025 & 2030
- TABLE 10: World Recent Past, Current & Future Analysis for Retail by Geographic Region - USA, Canada, Japan, China, Europe, Asia-Pacific, Latin America, Middle East and Africa Markets - Independent Analysis of Annual Sales in US$ Thousand for Years 2024 through 2030 and % CAGR
- TABLE 11: World Historic Review for Retail by Geographic Region - USA, Canada, Japan, China, Europe, Asia-Pacific, Latin America, Middle East and Africa Markets - Independent Analysis of Annual Sales in US$ Thousand for Years 2014 through 2023 and % CAGR
- TABLE 12: World 16-Year Perspective for Retail by Geographic Region - Percentage Breakdown of Value Sales for USA, Canada, Japan, China, Europe, Asia-Pacific, Latin America, Middle East and Africa for Years 2014, 2025 & 2030
- TABLE 13: World Recent Past, Current & Future Analysis for Eye-Care Professionals by Geographic Region - USA, Canada, Japan, China, Europe, Asia-Pacific, Latin America, Middle East and Africa Markets - Independent Analysis of Annual Sales in US$ Thousand for Years 2024 through 2030 and % CAGR
- TABLE 14: World Historic Review for Eye-Care Professionals by Geographic Region - USA, Canada, Japan, China, Europe, Asia-Pacific, Latin America, Middle East and Africa Markets - Independent Analysis of Annual Sales in US$ Thousand for Years 2014 through 2023 and % CAGR
- TABLE 15: World 16-Year Perspective for Eye-Care Professionals by Geographic Region - Percentage Breakdown of Value Sales for USA, Canada, Japan, China, Europe, Asia-Pacific, Latin America, Middle East and Africa for Years 2014, 2025 & 2030
- TABLE 16: World Recent Past, Current & Future Analysis for Online by Geographic Region - USA, Canada, Japan, China, Europe, Asia-Pacific, Latin America, Middle East and Africa Markets - Independent Analysis of Annual Sales in US$ Thousand for Years 2024 through 2030 and % CAGR
- TABLE 17: World Historic Review for Online by Geographic Region - USA, Canada, Japan, China, Europe, Asia-Pacific, Latin America, Middle East and Africa Markets - Independent Analysis of Annual Sales in US$ Thousand for Years 2014 through 2023 and % CAGR
- TABLE 18: World 16-Year Perspective for Online by Geographic Region - Percentage Breakdown of Value Sales for USA, Canada, Japan, China, Europe, Asia-Pacific, Latin America, Middle East and Africa for Years 2014, 2025 & 2030
- TABLE 19: World Contact Lens Solutions Market Analysis of Annual Sales in US$ Thousand for Years 2014 through 2030
III. MARKET ANALYSIS
- UNITED STATES
- Contact Lens Solutions Market Presence - Strong/Active/Niche/Trivial - Key Competitors in the United States for 2025 (E)
- Market Analytics
- Market Overview
- Multi-purpose Solutions Dominate the Lens Care Market
- Daily-Contact Lenses Reports Strong Growth
- Rise in Adoption of Silicone Hydrogels
- Competition
- US Contact Lens Care Solutions Market for 2023: Percentage Breakdown of Sales by Company
- TABLE 20: USA Recent Past, Current & Future Analysis for Contact Lens Solutions by Segment - Multi Purpose and Hydrogen Peroxide-based - Independent Analysis of Annual Sales in US$ Thousand for the Years 2024 through 2030 and % CAGR
- TABLE 21: USA Historic Review for Contact Lens Solutions by Segment - Multi Purpose and Hydrogen Peroxide-based Markets - Independent Analysis of Annual Sales in US$ Thousand for Years 2014 through 2023 and % CAGR
- TABLE 22: USA 16-Year Perspective for Contact Lens Solutions by Segment - Percentage Breakdown of Value Sales for Multi Purpose and Hydrogen Peroxide-based for the Years 2014, 2025 & 2030
- TABLE 23: USA Recent Past, Current & Future Analysis for Contact Lens Solutions by Distribution Channel - Retail, Eye-Care Professionals and Online - Independent Analysis of Annual Sales in US$ Thousand for the Years 2024 through 2030 and % CAGR
- TABLE 24: USA Historic Review for Contact Lens Solutions by Distribution Channel - Retail, Eye-Care Professionals and Online Markets - Independent Analysis of Annual Sales in US$ Thousand for Years 2014 through 2023 and % CAGR
- TABLE 25: USA 16-Year Perspective for Contact Lens Solutions by Distribution Channel - Percentage Breakdown of Value Sales for Retail, Eye-Care Professionals and Online for the Years 2014, 2025 & 2030
- CANADA
- Market Overview
- TABLE 26: Canada Recent Past, Current & Future Analysis for Contact Lens Solutions by Segment - Multi Purpose and Hydrogen Peroxide-based - Independent Analysis of Annual Sales in US$ Thousand for the Years 2024 through 2030 and % CAGR
- TABLE 27: Canada Historic Review for Contact Lens Solutions by Segment - Multi Purpose and Hydrogen Peroxide-based Markets - Independent Analysis of Annual Sales in US$ Thousand for Years 2014 through 2023 and % CAGR
- TABLE 28: Canada 16-Year Perspective for Contact Lens Solutions by Segment - Percentage Breakdown of Value Sales for Multi Purpose and Hydrogen Peroxide-based for the Years 2014, 2025 & 2030
- TABLE 29: Canada Recent Past, Current & Future Analysis for Contact Lens Solutions by Distribution Channel - Retail, Eye-Care Professionals and Online - Independent Analysis of Annual Sales in US$ Thousand for the Years 2024 through 2030 and % CAGR
- TABLE 30: Canada Historic Review for Contact Lens Solutions by Distribution Channel - Retail, Eye-Care Professionals and Online Markets - Independent Analysis of Annual Sales in US$ Thousand for Years 2014 through 2023 and % CAGR
- TABLE 31: Canada 16-Year Perspective for Contact Lens Solutions by Distribution Channel - Percentage Breakdown of Value Sales for Retail, Eye-Care Professionals and Online for the Years 2014, 2025 & 2030
- JAPAN
- Contact Lens Solutions Market Presence - Strong/Active/Niche/Trivial - Key Competitors in Japan for 2025 (E)
- Market Overview
- Market Analytics
- TABLE 32: Japan Recent Past, Current & Future Analysis for Contact Lens Solutions by Segment - Multi Purpose and Hydrogen Peroxide-based - Independent Analysis of Annual Sales in US$ Thousand for the Years 2024 through 2030 and % CAGR
- TABLE 33: Japan Historic Review for Contact Lens Solutions by Segment - Multi Purpose and Hydrogen Peroxide-based Markets - Independent Analysis of Annual Sales in US$ Thousand for Years 2014 through 2023 and % CAGR
- TABLE 34: Japan 16-Year Perspective for Contact Lens Solutions by Segment - Percentage Breakdown of Value Sales for Multi Purpose and Hydrogen Peroxide-based for the Years 2014, 2025 & 2030
- TABLE 35: Japan Recent Past, Current & Future Analysis for Contact Lens Solutions by Distribution Channel - Retail, Eye-Care Professionals and Online - Independent Analysis of Annual Sales in US$ Thousand for the Years 2024 through 2030 and % CAGR
- TABLE 36: Japan Historic Review for Contact Lens Solutions by Distribution Channel - Retail, Eye-Care Professionals and Online Markets - Independent Analysis of Annual Sales in US$ Thousand for Years 2014 through 2023 and % CAGR
- TABLE 37: Japan 16-Year Perspective for Contact Lens Solutions by Distribution Channel - Percentage Breakdown of Value Sales for Retail, Eye-Care Professionals and Online for the Years 2014, 2025 & 2030
- CHINA
- Contact Lens Solutions Market Presence - Strong/Active/Niche/Trivial - Key Competitors in China for 2025 (E)
- Market Overview
- Market Analytics
- TABLE 38: China Recent Past, Current & Future Analysis for Contact Lens Solutions by Segment - Multi Purpose and Hydrogen Peroxide-based - Independent Analysis of Annual Sales in US$ Thousand for the Years 2024 through 2030 and % CAGR
- TABLE 39: China Historic Review for Contact Lens Solutions by Segment - Multi Purpose and Hydrogen Peroxide-based Markets - Independent Analysis of Annual Sales in US$ Thousand for Years 2014 through 2023 and % CAGR
- TABLE 40: China 16-Year Perspective for Contact Lens Solutions by Segment - Percentage Breakdown of Value Sales for Multi Purpose and Hydrogen Peroxide-based for the Years 2014, 2025 & 2030
- TABLE 41: China Recent Past, Current & Future Analysis for Contact Lens Solutions by Distribution Channel - Retail, Eye-Care Professionals and Online - Independent Analysis of Annual Sales in US$ Thousand for the Years 2024 through 2030 and % CAGR
- TABLE 42: China Historic Review for Contact Lens Solutions by Distribution Channel - Retail, Eye-Care Professionals and Online Markets - Independent Analysis of Annual Sales in US$ Thousand for Years 2014 through 2023 and % CAGR
- TABLE 43: China 16-Year Perspective for Contact Lens Solutions by Distribution Channel - Percentage Breakdown of Value Sales for Retail, Eye-Care Professionals and Online for the Years 2014, 2025 & 2030
- EUROPE
- Contact Lens Solutions Market Presence - Strong/Active/Niche/Trivial - Key Competitors in Europe for 2025 (E)
- Market Analytics
- Market Overview
- Contact Lens Wearer Base
- Contact Lens Market in Europe (2023): Percentage Penetration of Contact lens (as % of total population of 15 to 64 years of age) by Country
- TABLE 44: Europe Recent Past, Current & Future Analysis for Contact Lens Solutions by Geographic Region - France, Germany, Italy, UK, Spain, Russia and Rest of Europe Markets - Independent Analysis of Annual Sales in US$ Thousand for Years 2024 through 2030 and % CAGR
- TABLE 45: Europe Historic Review for Contact Lens Solutions by Geographic Region - France, Germany, Italy, UK, Spain, Russia and Rest of Europe Markets - Independent Analysis of Annual Sales in US$ Thousand for Years 2014 through 2023 and % CAGR
- TABLE 46: Europe 16-Year Perspective for Contact Lens Solutions by Geographic Region - Percentage Breakdown of Value Sales for France, Germany, Italy, UK, Spain, Russia and Rest of Europe Markets for Years 2014, 2025 & 2030
- TABLE 47: Europe Recent Past, Current & Future Analysis for Contact Lens Solutions by Segment - Multi Purpose and Hydrogen Peroxide-based - Independent Analysis of Annual Sales in US$ Thousand for the Years 2024 through 2030 and % CAGR
- TABLE 48: Europe Historic Review for Contact Lens Solutions by Segment - Multi Purpose and Hydrogen Peroxide-based Markets - Independent Analysis of Annual Sales in US$ Thousand for Years 2014 through 2023 and % CAGR
- TABLE 49: Europe 16-Year Perspective for Contact Lens Solutions by Segment - Percentage Breakdown of Value Sales for Multi Purpose and Hydrogen Peroxide-based for the Years 2014, 2025 & 2030
- TABLE 50: Europe Recent Past, Current & Future Analysis for Contact Lens Solutions by Distribution Channel - Retail, Eye-Care Professionals and Online - Independent Analysis of Annual Sales in US$ Thousand for the Years 2024 through 2030 and % CAGR
- TABLE 51: Europe Historic Review for Contact Lens Solutions by Distribution Channel - Retail, Eye-Care Professionals and Online Markets - Independent Analysis of Annual Sales in US$ Thousand for Years 2014 through 2023 and % CAGR
- TABLE 52: Europe 16-Year Perspective for Contact Lens Solutions by Distribution Channel - Percentage Breakdown of Value Sales for Retail, Eye-Care Professionals and Online for the Years 2014, 2025 & 2030
- FRANCE
- Contact Lens Solutions Market Presence - Strong/Active/Niche/Trivial - Key Competitors in France for 2025 (E)
- TABLE 53: France Recent Past, Current & Future Analysis for Contact Lens Solutions by Segment - Multi Purpose and Hydrogen Peroxide-based - Independent Analysis of Annual Sales in US$ Thousand for the Years 2024 through 2030 and % CAGR
- TABLE 54: France Historic Review for Contact Lens Solutions by Segment - Multi Purpose and Hydrogen Peroxide-based Markets - Independent Analysis of Annual Sales in US$ Thousand for Years 2014 through 2023 and % CAGR
- TABLE 55: France 16-Year Perspective for Contact Lens Solutions by Segment - Percentage Breakdown of Value Sales for Multi Purpose and Hydrogen Peroxide-based for the Years 2014, 2025 & 2030
- TABLE 56: France Recent Past, Current & Future Analysis for Contact Lens Solutions by Distribution Channel - Retail, Eye-Care Professionals and Online - Independent Analysis of Annual Sales in US$ Thousand for the Years 2024 through 2030 and % CAGR
- TABLE 57: France Historic Review for Contact Lens Solutions by Distribution Channel - Retail, Eye-Care Professionals and Online Markets - Independent Analysis of Annual Sales in US$ Thousand for Years 2014 through 2023 and % CAGR
- TABLE 58: France 16-Year Perspective for Contact Lens Solutions by Distribution Channel - Percentage Breakdown of Value Sales for Retail, Eye-Care Professionals and Online for the Years 2014, 2025 & 2030
- GERMANY
- Contact Lens Solutions Market Presence - Strong/Active/Niche/Trivial - Key Competitors in Germany for 2025 (E)
- TABLE 59: Germany Recent Past, Current & Future Analysis for Contact Lens Solutions by Segment - Multi Purpose and Hydrogen Peroxide-based - Independent Analysis of Annual Sales in US$ Thousand for the Years 2024 through 2030 and % CAGR
- TABLE 60: Germany Historic Review for Contact Lens Solutions by Segment - Multi Purpose and Hydrogen Peroxide-based Markets - Independent Analysis of Annual Sales in US$ Thousand for Years 2014 through 2023 and % CAGR
- TABLE 61: Germany 16-Year Perspective for Contact Lens Solutions by Segment - Percentage Breakdown of Value Sales for Multi Purpose and Hydrogen Peroxide-based for the Years 2014, 2025 & 2030
- TABLE 62: Germany Recent Past, Current & Future Analysis for Contact Lens Solutions by Distribution Channel - Retail, Eye-Care Professionals and Online - Independent Analysis of Annual Sales in US$ Thousand for the Years 2024 through 2030 and % CAGR
- TABLE 63: Germany Historic Review for Contact Lens Solutions by Distribution Channel - Retail, Eye-Care Professionals and Online Markets - Independent Analysis of Annual Sales in US$ Thousand for Years 2014 through 2023 and % CAGR
- TABLE 64: Germany 16-Year Perspective for Contact Lens Solutions by Distribution Channel - Percentage Breakdown of Value Sales for Retail, Eye-Care Professionals and Online for the Years 2014, 2025 & 2030
- ITALY
- TABLE 65: Italy Recent Past, Current & Future Analysis for Contact Lens Solutions by Segment - Multi Purpose and Hydrogen Peroxide-based - Independent Analysis of Annual Sales in US$ Thousand for the Years 2024 through 2030 and % CAGR
- TABLE 66: Italy Historic Review for Contact Lens Solutions by Segment - Multi Purpose and Hydrogen Peroxide-based Markets - Independent Analysis of Annual Sales in US$ Thousand for Years 2014 through 2023 and % CAGR
- TABLE 67: Italy 16-Year Perspective for Contact Lens Solutions by Segment - Percentage Breakdown of Value Sales for Multi Purpose and Hydrogen Peroxide-based for the Years 2014, 2025 & 2030
- TABLE 68: Italy Recent Past, Current & Future Analysis for Contact Lens Solutions by Distribution Channel - Retail, Eye-Care Professionals and Online - Independent Analysis of Annual Sales in US$ Thousand for the Years 2024 through 2030 and % CAGR
- TABLE 69: Italy Historic Review for Contact Lens Solutions by Distribution Channel - Retail, Eye-Care Professionals and Online Markets - Independent Analysis of Annual Sales in US$ Thousand for Years 2014 through 2023 and % CAGR
- TABLE 70: Italy 16-Year Perspective for Contact Lens Solutions by Distribution Channel - Percentage Breakdown of Value Sales for Retail, Eye-Care Professionals and Online for the Years 2014, 2025 & 2030
- UNITED KINGDOM
- Contact Lens Solutions Market Presence - Strong/Active/Niche/Trivial - Key Competitors in the United Kingdom for 2025 (E)
- TABLE 71: UK Recent Past, Current & Future Analysis for Contact Lens Solutions by Segment - Multi Purpose and Hydrogen Peroxide-based - Independent Analysis of Annual Sales in US$ Thousand for the Years 2024 through 2030 and % CAGR
- TABLE 72: UK Historic Review for Contact Lens Solutions by Segment - Multi Purpose and Hydrogen Peroxide-based Markets - Independent Analysis of Annual Sales in US$ Thousand for Years 2014 through 2023 and % CAGR
- TABLE 73: UK 16-Year Perspective for Contact Lens Solutions by Segment - Percentage Breakdown of Value Sales for Multi Purpose and Hydrogen Peroxide-based for the Years 2014, 2025 & 2030
- TABLE 74: UK Recent Past, Current & Future Analysis for Contact Lens Solutions by Distribution Channel - Retail, Eye-Care Professionals and Online - Independent Analysis of Annual Sales in US$ Thousand for the Years 2024 through 2030 and % CAGR
- TABLE 75: UK Historic Review for Contact Lens Solutions by Distribution Channel - Retail, Eye-Care Professionals and Online Markets - Independent Analysis of Annual Sales in US$ Thousand for Years 2014 through 2023 and % CAGR
- TABLE 76: UK 16-Year Perspective for Contact Lens Solutions by Distribution Channel - Percentage Breakdown of Value Sales for Retail, Eye-Care Professionals and Online for the Years 2014, 2025 & 2030
- SPAIN
- TABLE 77: Spain Recent Past, Current & Future Analysis for Contact Lens Solutions by Segment - Multi Purpose and Hydrogen Peroxide-based - Independent Analysis of Annual Sales in US$ Thousand for the Years 2024 through 2030 and % CAGR
- TABLE 78: Spain Historic Review for Contact Lens Solutions by Segment - Multi Purpose and Hydrogen Peroxide-based Markets - Independent Analysis of Annual Sales in US$ Thousand for Years 2014 through 2023 and % CAGR
- TABLE 79: Spain 16-Year Perspective for Contact Lens Solutions by Segment - Percentage Breakdown of Value Sales for Multi Purpose and Hydrogen Peroxide-based for the Years 2014, 2025 & 2030
- TABLE 80: Spain Recent Past, Current & Future Analysis for Contact Lens Solutions by Distribution Channel - Retail, Eye-Care Professionals and Online - Independent Analysis of Annual Sales in US$ Thousand for the Years 2024 through 2030 and % CAGR
- TABLE 81: Spain Historic Review for Contact Lens Solutions by Distribution Channel - Retail, Eye-Care Professionals and Online Markets - Independent Analysis of Annual Sales in US$ Thousand for Years 2014 through 2023 and % CAGR
- TABLE 82: Spain 16-Year Perspective for Contact Lens Solutions by Distribution Channel - Percentage Breakdown of Value Sales for Retail, Eye-Care Professionals and Online for the Years 2014, 2025 & 2030
- RUSSIA
- TABLE 83: Russia Recent Past, Current & Future Analysis for Contact Lens Solutions by Segment - Multi Purpose and Hydrogen Peroxide-based - Independent Analysis of Annual Sales in US$ Thousand for the Years 2024 through 2030 and % CAGR
- TABLE 84: Russia Historic Review for Contact Lens Solutions by Segment - Multi Purpose and Hydrogen Peroxide-based Markets - Independent Analysis of Annual Sales in US$ Thousand for Years 2014 through 2023 and % CAGR
- TABLE 85: Russia 16-Year Perspective for Contact Lens Solutions by Segment - Percentage Breakdown of Value Sales for Multi Purpose and Hydrogen Peroxide-based for the Years 2014, 2025 & 2030
- TABLE 86: Russia Recent Past, Current & Future Analysis for Contact Lens Solutions by Distribution Channel - Retail, Eye-Care Professionals and Online - Independent Analysis of Annual Sales in US$ Thousand for the Years 2024 through 2030 and % CAGR
- TABLE 87: Russia Historic Review for Contact Lens Solutions by Distribution Channel - Retail, Eye-Care Professionals and Online Markets - Independent Analysis of Annual Sales in US$ Thousand for Years 2014 through 2023 and % CAGR
- TABLE 88: Russia 16-Year Perspective for Contact Lens Solutions by Distribution Channel - Percentage Breakdown of Value Sales for Retail, Eye-Care Professionals and Online for the Years 2014, 2025 & 2030
- REST OF EUROPE
- TABLE 89: Rest of Europe Recent Past, Current & Future Analysis for Contact Lens Solutions by Segment - Multi Purpose and Hydrogen Peroxide-based - Independent Analysis of Annual Sales in US$ Thousand for the Years 2024 through 2030 and % CAGR
- TABLE 90: Rest of Europe Historic Review for Contact Lens Solutions by Segment - Multi Purpose and Hydrogen Peroxide-based Markets - Independent Analysis of Annual Sales in US$ Thousand for Years 2014 through 2023 and % CAGR
- TABLE 91: Rest of Europe 16-Year Perspective for Contact Lens Solutions by Segment - Percentage Breakdown of Value Sales for Multi Purpose and Hydrogen Peroxide-based for the Years 2014, 2025 & 2030
- TABLE 92: Rest of Europe Recent Past, Current & Future Analysis for Contact Lens Solutions by Distribution Channel - Retail, Eye-Care Professionals and Online - Independent Analysis of Annual Sales in US$ Thousand for the Years 2024 through 2030 and % CAGR
- TABLE 93: Rest of Europe Historic Review for Contact Lens Solutions by Distribution Channel - Retail, Eye-Care Professionals and Online Markets - Independent Analysis of Annual Sales in US$ Thousand for Years 2014 through 2023 and % CAGR
- TABLE 94: Rest of Europe 16-Year Perspective for Contact Lens Solutions by Distribution Channel - Percentage Breakdown of Value Sales for Retail, Eye-Care Professionals and Online for the Years 2014, 2025 & 2030
- ASIA-PACIFIC
- Contact Lens Solutions Market Presence - Strong/Active/Niche/Trivial - Key Competitors in Asia-Pacific for 2025 (E)
- Market Overview
- TABLE 95: Asia-Pacific Recent Past, Current & Future Analysis for Contact Lens Solutions by Geographic Region - Australia, India, South Korea and Rest of Asia-Pacific Markets - Independent Analysis of Annual Sales in US$ Thousand for Years 2024 through 2030 and % CAGR
- TABLE 96: Asia-Pacific Historic Review for Contact Lens Solutions by Geographic Region - Australia, India, South Korea and Rest of Asia-Pacific Markets - Independent Analysis of Annual Sales in US$ Thousand for Years 2014 through 2023 and % CAGR
- TABLE 97: Asia-Pacific 16-Year Perspective for Contact Lens Solutions by Geographic Region - Percentage Breakdown of Value Sales for Australia, India, South Korea and Rest of Asia-Pacific Markets for Years 2014, 2025 & 2030
- TABLE 98: Asia-Pacific Recent Past, Current & Future Analysis for Contact Lens Solutions by Segment - Multi Purpose and Hydrogen Peroxide-based - Independent Analysis of Annual Sales in US$ Thousand for the Years 2024 through 2030 and % CAGR
- TABLE 99: Asia-Pacific Historic Review for Contact Lens Solutions by Segment - Multi Purpose and Hydrogen Peroxide-based Markets - Independent Analysis of Annual Sales in US$ Thousand for Years 2014 through 2023 and % CAGR
- TABLE 100: Asia-Pacific 16-Year Perspective for Contact Lens Solutions by Segment - Percentage Breakdown of Value Sales for Multi Purpose and Hydrogen Peroxide-based for the Years 2014, 2025 & 2030
- TABLE 101: Asia-Pacific Recent Past, Current & Future Analysis for Contact Lens Solutions by Distribution Channel - Retail, Eye-Care Professionals and Online - Independent Analysis of Annual Sales in US$ Thousand for the Years 2024 through 2030 and % CAGR
- TABLE 102: Asia-Pacific Historic Review for Contact Lens Solutions by Distribution Channel - Retail, Eye-Care Professionals and Online Markets - Independent Analysis of Annual Sales in US$ Thousand for Years 2014 through 2023 and % CAGR
- TABLE 103: Asia-Pacific 16-Year Perspective for Contact Lens Solutions by Distribution Channel - Percentage Breakdown of Value Sales for Retail, Eye-Care Professionals and Online for the Years 2014, 2025 & 2030
- AUSTRALIA
- Contact Lens Solutions Market Presence - Strong/Active/Niche/Trivial - Key Competitors in Australia for 2025 (E)
- TABLE 104: Australia Recent Past, Current & Future Analysis for Contact Lens Solutions by Segment - Multi Purpose and Hydrogen Peroxide-based - Independent Analysis of Annual Sales in US$ Thousand for the Years 2024 through 2030 and % CAGR
- TABLE 105: Australia Historic Review for Contact Lens Solutions by Segment - Multi Purpose and Hydrogen Peroxide-based Markets - Independent Analysis of Annual Sales in US$ Thousand for Years 2014 through 2023 and % CAGR
- TABLE 106: Australia 16-Year Perspective for Contact Lens Solutions by Segment - Percentage Breakdown of Value Sales for Multi Purpose and Hydrogen Peroxide-based for the Years 2014, 2025 & 2030
- TABLE 107: Australia Recent Past, Current & Future Analysis for Contact Lens Solutions by Distribution Channel - Retail, Eye-Care Professionals and Online - Independent Analysis of Annual Sales in US$ Thousand for the Years 2024 through 2030 and % CAGR
- TABLE 108: Australia Historic Review for Contact Lens Solutions by Distribution Channel - Retail, Eye-Care Professionals and Online Markets - Independent Analysis of Annual Sales in US$ Thousand for Years 2014 through 2023 and % CAGR
- TABLE 109: Australia 16-Year Perspective for Contact Lens Solutions by Distribution Channel - Percentage Breakdown of Value Sales for Retail, Eye-Care Professionals and Online for the Years 2014, 2025 & 2030
- INDIA
- Contact Lens Solutions Market Presence - Strong/Active/Niche/Trivial - Key Competitors in India for 2025 (E)
- Market Overview
- TABLE 110: India Recent Past, Current & Future Analysis for Contact Lens Solutions by Segment - Multi Purpose and Hydrogen Peroxide-based - Independent Analysis of Annual Sales in US$ Thousand for the Years 2024 through 2030 and % CAGR
- TABLE 111: India Historic Review for Contact Lens Solutions by Segment - Multi Purpose and Hydrogen Peroxide-based Markets - Independent Analysis of Annual Sales in US$ Thousand for Years 2014 through 2023 and % CAGR
- TABLE 112: India 16-Year Perspective for Contact Lens Solutions by Segment - Percentage Breakdown of Value Sales for Multi Purpose and Hydrogen Peroxide-based for the Years 2014, 2025 & 2030
- TABLE 113: India Recent Past, Current & Future Analysis for Contact Lens Solutions by Distribution Channel - Retail, Eye-Care Professionals and Online - Independent Analysis of Annual Sales in US$ Thousand for the Years 2024 through 2030 and % CAGR
- TABLE 114: India Historic Review for Contact Lens Solutions by Distribution Channel - Retail, Eye-Care Professionals and Online Markets - Independent Analysis of Annual Sales in US$ Thousand for Years 2014 through 2023 and % CAGR
- TABLE 115: India 16-Year Perspective for Contact Lens Solutions by Distribution Channel - Percentage Breakdown of Value Sales for Retail, Eye-Care Professionals and Online for the Years 2014, 2025 & 2030
- SOUTH KOREA
- TABLE 116: South Korea Recent Past, Current & Future Analysis for Contact Lens Solutions by Segment - Multi Purpose and Hydrogen Peroxide-based - Independent Analysis of Annual Sales in US$ Thousand for the Years 2024 through 2030 and % CAGR
- TABLE 117: South Korea Historic Review for Contact Lens Solutions by Segment - Multi Purpose and Hydrogen Peroxide-based Markets - Independent Analysis of Annual Sales in US$ Thousand for Years 2014 through 2023 and % CAGR
- TABLE 118: South Korea 16-Year Perspective for Contact Lens Solutions by Segment - Percentage Breakdown of Value Sales for Multi Purpose and Hydrogen Peroxide-based for the Years 2014, 2025 & 2030
- TABLE 119: South Korea Recent Past, Current & Future Analysis for Contact Lens Solutions by Distribution Channel - Retail, Eye-Care Professionals and Online - Independent Analysis of Annual Sales in US$ Thousand for the Years 2024 through 2030 and % CAGR
- TABLE 120: South Korea Historic Review for Contact Lens Solutions by Distribution Channel - Retail, Eye-Care Professionals and Online Markets - Independent Analysis of Annual Sales in US$ Thousand for Years 2014 through 2023 and % CAGR
- TABLE 121: South Korea 16-Year Perspective for Contact Lens Solutions by Distribution Channel - Percentage Breakdown of Value Sales for Retail, Eye-Care Professionals and Online for the Years 2014, 2025 & 2030
- REST OF ASIA-PACIFIC
- TABLE 122: Rest of Asia-Pacific Recent Past, Current & Future Analysis for Contact Lens Solutions by Segment - Multi Purpose and Hydrogen Peroxide-based - Independent Analysis of Annual Sales in US$ Thousand for the Years 2024 through 2030 and % CAGR
- TABLE 123: Rest of Asia-Pacific Historic Review for Contact Lens Solutions by Segment - Multi Purpose and Hydrogen Peroxide-based Markets - Independent Analysis of Annual Sales in US$ Thousand for Years 2014 through 2023 and % CAGR
- TABLE 124: Rest of Asia-Pacific 16-Year Perspective for Contact Lens Solutions by Segment - Percentage Breakdown of Value Sales for Multi Purpose and Hydrogen Peroxide-based for the Years 2014, 2025 & 2030
- TABLE 125: Rest of Asia-Pacific Recent Past, Current & Future Analysis for Contact Lens Solutions by Distribution Channel - Retail, Eye-Care Professionals and Online - Independent Analysis of Annual Sales in US$ Thousand for the Years 2024 through 2030 and % CAGR
- TABLE 126: Rest of Asia-Pacific Historic Review for Contact Lens Solutions by Distribution Channel - Retail, Eye-Care Professionals and Online Markets - Independent Analysis of Annual Sales in US$ Thousand for Years 2014 through 2023 and % CAGR
- TABLE 127: Rest of Asia-Pacific 16-Year Perspective for Contact Lens Solutions by Distribution Channel - Percentage Breakdown of Value Sales for Retail, Eye-Care Professionals and Online for the Years 2014, 2025 & 2030
- LATIN AMERICA
- Contact Lens Solutions Market Presence - Strong/Active/Niche/Trivial - Key Competitors in Latin America for 2025 (E)
- TABLE 128: Latin America Recent Past, Current & Future Analysis for Contact Lens Solutions by Geographic Region - Argentina, Brazil, Mexico and Rest of Latin America Markets - Independent Analysis of Annual Sales in US$ Thousand for Years 2024 through 2030 and % CAGR
- TABLE 129: Latin America Historic Review for Contact Lens Solutions by Geographic Region - Argentina, Brazil, Mexico and Rest of Latin America Markets - Independent Analysis of Annual Sales in US$ Thousand for Years 2014 through 2023 and % CAGR
- TABLE 130: Latin America 16-Year Perspective for Contact Lens Solutions by Geographic Region - Percentage Breakdown of Value Sales for Argentina, Brazil, Mexico and Rest of Latin America Markets for Years 2014, 2025 & 2030
- TABLE 131: Latin America Recent Past, Current & Future Analysis for Contact Lens Solutions by Segment - Multi Purpose and Hydrogen Peroxide-based - Independent Analysis of Annual Sales in US$ Thousand for the Years 2024 through 2030 and % CAGR
- TABLE 132: Latin America Historic Review for Contact Lens Solutions by Segment - Multi Purpose and Hydrogen Peroxide-based Markets - Independent Analysis of Annual Sales in US$ Thousand for Years 2014 through 2023 and % CAGR
- TABLE 133: Latin America 16-Year Perspective for Contact Lens Solutions by Segment - Percentage Breakdown of Value Sales for Multi Purpose and Hydrogen Peroxide-based for the Years 2014, 2025 & 2030
- TABLE 134: Latin America Recent Past, Current & Future Analysis for Contact Lens Solutions by Distribution Channel - Retail, Eye-Care Professionals and Online - Independent Analysis of Annual Sales in US$ Thousand for the Years 2024 through 2030 and % CAGR
- TABLE 135: Latin America Historic Review for Contact Lens Solutions by Distribution Channel - Retail, Eye-Care Professionals and Online Markets - Independent Analysis of Annual Sales in US$ Thousand for Years 2014 through 2023 and % CAGR
- TABLE 136: Latin America 16-Year Perspective for Contact Lens Solutions by Distribution Channel - Percentage Breakdown of Value Sales for Retail, Eye-Care Professionals and Online for the Years 2014, 2025 & 2030
- ARGENTINA
- TABLE 137: Argentina Recent Past, Current & Future Analysis for Contact Lens Solutions by Segment - Multi Purpose and Hydrogen Peroxide-based - Independent Analysis of Annual Sales in US$ Thousand for the Years 2024 through 2030 and % CAGR
- TABLE 138: Argentina Historic Review for Contact Lens Solutions by Segment - Multi Purpose and Hydrogen Peroxide-based Markets - Independent Analysis of Annual Sales in US$ Thousand for Years 2014 through 2023 and % CAGR
- TABLE 139: Argentina 16-Year Perspective for Contact Lens Solutions by Segment - Percentage Breakdown of Value Sales for Multi Purpose and Hydrogen Peroxide-based for the Years 2014, 2025 & 2030
- TABLE 140: Argentina Recent Past, Current & Future Analysis for Contact Lens Solutions by Distribution Channel - Retail, Eye-Care Professionals and Online - Independent Analysis of Annual Sales in US$ Thousand for the Years 2024 through 2030 and % CAGR
- TABLE 141: Argentina Historic Review for Contact Lens Solutions by Distribution Channel - Retail, Eye-Care Professionals and Online Markets - Independent Analysis of Annual Sales in US$ Thousand for Years 2014 through 2023 and % CAGR
- TABLE 142: Argentina 16-Year Perspective for Contact Lens Solutions by Distribution Channel - Percentage Breakdown of Value Sales for Retail, Eye-Care Professionals and Online for the Years 2014, 2025 & 2030
- BRAZIL
- TABLE 143: Brazil Recent Past, Current & Future Analysis for Contact Lens Solutions by Segment - Multi Purpose and Hydrogen Peroxide-based - Independent Analysis of Annual Sales in US$ Thousand for the Years 2024 through 2030 and % CAGR
- TABLE 144: Brazil Historic Review for Contact Lens Solutions by Segment - Multi Purpose and Hydrogen Peroxide-based Markets - Independent Analysis of Annual Sales in US$ Thousand for Years 2014 through 2023 and % CAGR
- TABLE 145: Brazil 16-Year Perspective for Contact Lens Solutions by Segment - Percentage Breakdown of Value Sales for Multi Purpose and Hydrogen Peroxide-based for the Years 2014, 2025 & 2030
- TABLE 146: Brazil Recent Past, Current & Future Analysis for Contact Lens Solutions by Distribution Channel - Retail, Eye-Care Professionals and Online - Independent Analysis of Annual Sales in US$ Thousand for the Years 2024 through 2030 and % CAGR
- TABLE 147: Brazil Historic Review for Contact Lens Solutions by Distribution Channel - Retail, Eye-Care Professionals and Online Markets - Independent Analysis of Annual Sales in US$ Thousand for Years 2014 through 2023 and % CAGR
- TABLE 148: Brazil 16-Year Perspective for Contact Lens Solutions by Distribution Channel - Percentage Breakdown of Value Sales for Retail, Eye-Care Professionals and Online for the Years 2014, 2025 & 2030
- MEXICO
- TABLE 149: Mexico Recent Past, Current & Future Analysis for Contact Lens Solutions by Segment - Multi Purpose and Hydrogen Peroxide-based - Independent Analysis of Annual Sales in US$ Thousand for the Years 2024 through 2030 and % CAGR
- TABLE 150: Mexico Historic Review for Contact Lens Solutions by Segment - Multi Purpose and Hydrogen Peroxide-based Markets - Independent Analysis of Annual Sales in US$ Thousand for Years 2014 through 2023 and % CAGR
- TABLE 151: Mexico 16-Year Perspective for Contact Lens Solutions by Segment - Percentage Breakdown of Value Sales for Multi Purpose and Hydrogen Peroxide-based for the Years 2014, 2025 & 2030
- TABLE 152: Mexico Recent Past, Current & Future Analysis for Contact Lens Solutions by Distribution Channel - Retail, Eye-Care Professionals and Online - Independent Analysis of Annual Sales in US$ Thousand for the Years 2024 through 2030 and % CAGR
- TABLE 153: Mexico Historic Review for Contact Lens Solutions by Distribution Channel - Retail, Eye-Care Professionals and Online Markets - Independent Analysis of Annual Sales in US$ Thousand for Years 2014 through 2023 and % CAGR
- TABLE 154: Mexico 16-Year Perspective for Contact Lens Solutions by Distribution Channel - Percentage Breakdown of Value Sales for Retail, Eye-Care Professionals and Online for the Years 2014, 2025 & 2030
- REST OF LATIN AMERICA
- TABLE 155: Rest of Latin America Recent Past, Current & Future Analysis for Contact Lens Solutions by Segment - Multi Purpose and Hydrogen Peroxide-based - Independent Analysis of Annual Sales in US$ Thousand for the Years 2024 through 2030 and % CAGR
- TABLE 156: Rest of Latin America Historic Review for Contact Lens Solutions by Segment - Multi Purpose and Hydrogen Peroxide-based Markets - Independent Analysis of Annual Sales in US$ Thousand for Years 2014 through 2023 and % CAGR
- TABLE 157: Rest of Latin America 16-Year Perspective for Contact Lens Solutions by Segment - Percentage Breakdown of Value Sales for Multi Purpose and Hydrogen Peroxide-based for the Years 2014, 2025 & 2030
- TABLE 158: Rest of Latin America Recent Past, Current & Future Analysis for Contact Lens Solutions by Distribution Channel - Retail, Eye-Care Professionals and Online - Independent Analysis of Annual Sales in US$ Thousand for the Years 2024 through 2030 and % CAGR
- TABLE 159: Rest of Latin America Historic Review for Contact Lens Solutions by Distribution Channel - Retail, Eye-Care Professionals and Online Markets - Independent Analysis of Annual Sales in US$ Thousand for Years 2014 through 2023 and % CAGR
- TABLE 160: Rest of Latin America 16-Year Perspective for Contact Lens Solutions by Distribution Channel - Percentage Breakdown of Value Sales for Retail, Eye-Care Professionals and Online for the Years 2014, 2025 & 2030
- MIDDLE EAST
- Contact Lens Solutions Market Presence - Strong/Active/Niche/Trivial - Key Competitors in Middle East for 2025 (E)
- TABLE 161: Middle East Recent Past, Current & Future Analysis for Contact Lens Solutions by Geographic Region - Iran, Israel, Saudi Arabia, UAE and Rest of Middle East Markets - Independent Analysis of Annual Sales in US$ Thousand for Years 2024 through 2030 and % CAGR
- TABLE 162: Middle East Historic Review for Contact Lens Solutions by Geographic Region - Iran, Israel, Saudi Arabia, UAE and Rest of Middle East Markets - Independent Analysis of Annual Sales in US$ Thousand for Years 2014 through 2023 and % CAGR
- TABLE 163: Middle East 16-Year Perspective for Contact Lens Solutions by Geographic Region - Percentage Breakdown of Value Sales for Iran, Israel, Saudi Arabia, UAE and Rest of Middle East Markets for Years 2014, 2025 & 2030
- TABLE 164: Middle East Recent Past, Current & Future Analysis for Contact Lens Solutions by Segment - Multi Purpose and Hydrogen Peroxide-based - Independent Analysis of Annual Sales in US$ Thousand for the Years 2024 through 2030 and % CAGR
- TABLE 165: Middle East Historic Review for Contact Lens Solutions by Segment - Multi Purpose and Hydrogen Peroxide-based Markets - Independent Analysis of Annual Sales in US$ Thousand for Years 2014 through 2023 and % CAGR
- TABLE 166: Middle East 16-Year Perspective for Contact Lens Solutions by Segment - Percentage Breakdown of Value Sales for Multi Purpose and Hydrogen Peroxide-based for the Years 2014, 2025 & 2030
- TABLE 167: Middle East Recent Past, Current & Future Analysis for Contact Lens Solutions by Distribution Channel - Retail, Eye-Care Professionals and Online - Independent Analysis of Annual Sales in US$ Thousand for the Years 2024 through 2030 and % CAGR
- TABLE 168: Middle East Historic Review for Contact Lens Solutions by Distribution Channel - Retail, Eye-Care Professionals and Online Markets - Independent Analysis of Annual Sales in US$ Thousand for Years 2014 through 2023 and % CAGR
- TABLE 169: Middle East 16-Year Perspective for Contact Lens Solutions by Distribution Channel - Percentage Breakdown of Value Sales for Retail, Eye-Care Professionals and Online for the Years 2014, 2025 & 2030
- IRAN
- TABLE 170: Iran Recent Past, Current & Future Analysis for Contact Lens Solutions by Segment - Multi Purpose and Hydrogen Peroxide-based - Independent Analysis of Annual Sales in US$ Thousand for the Years 2024 through 2030 and % CAGR
- TABLE 171: Iran Historic Review for Contact Lens Solutions by Segment - Multi Purpose and Hydrogen Peroxide-based Markets - Independent Analysis of Annual Sales in US$ Thousand for Years 2014 through 2023 and % CAGR
- TABLE 172: Iran 16-Year Perspective for Contact Lens Solutions by Segment - Percentage Breakdown of Value Sales for Multi Purpose and Hydrogen Peroxide-based for the Years 2014, 2025 & 2030
- TABLE 173: Iran Recent Past, Current & Future Analysis for Contact Lens Solutions by Distribution Channel - Retail, Eye-Care Professionals and Online - Independent Analysis of Annual Sales in US$ Thousand for the Years 2024 through 2030 and % CAGR
- TABLE 174: Iran Historic Review for Contact Lens Solutions by Distribution Channel - Retail, Eye-Care Professionals and Online Markets - Independent Analysis of Annual Sales in US$ Thousand for Years 2014 through 2023 and % CAGR
- TABLE 175: Iran 16-Year Perspective for Contact Lens Solutions by Distribution Channel - Percentage Breakdown of Value Sales for Retail, Eye-Care Professionals and Online for the Years 2014, 2025 & 2030
- ISRAEL
- TABLE 176: Israel Recent Past, Current & Future Analysis for Contact Lens Solutions by Segment - Multi Purpose and Hydrogen Peroxide-based - Independent Analysis of Annual Sales in US$ Thousand for the Years 2024 through 2030 and % CAGR
- TABLE 177: Israel Historic Review for Contact Lens Solutions by Segment - Multi Purpose and Hydrogen Peroxide-based Markets - Independent Analysis of Annual Sales in US$ Thousand for Years 2014 through 2023 and % CAGR
- TABLE 178: Israel 16-Year Perspective for Contact Lens Solutions by Segment - Percentage Breakdown of Value Sales for Multi Purpose and Hydrogen Peroxide-based for the Years 2014, 2025 & 2030
- TABLE 179: Israel Recent Past, Current & Future Analysis for Contact Lens Solutions by Distribution Channel - Retail, Eye-Care Professionals and Online - Independent Analysis of Annual Sales in US$ Thousand for the Years 2024 through 2030 and % CAGR
- TABLE 180: Israel Historic Review for Contact Lens Solutions by Distribution Channel - Retail, Eye-Care Professionals and Online Markets - Independent Analysis of Annual Sales in US$ Thousand for Years 2014 through 2023 and % CAGR
- TABLE 181: Israel 16-Year Perspective for Contact Lens Solutions by Distribution Channel - Percentage Breakdown of Value Sales for Retail, Eye-Care Professionals and Online for the Years 2014, 2025 & 2030
- SAUDI ARABIA
- TABLE 182: Saudi Arabia Recent Past, Current & Future Analysis for Contact Lens Solutions by Segment - Multi Purpose and Hydrogen Peroxide-based - Independent Analysis of Annual Sales in US$ Thousand for the Years 2024 through 2030 and % CAGR
- TABLE 183: Saudi Arabia Historic Review for Contact Lens Solutions by Segment - Multi Purpose and Hydrogen Peroxide-based Markets - Independent Analysis of Annual Sales in US$ Thousand for Years 2014 through 2023 and % CAGR
- TABLE 184: Saudi Arabia 16-Year Perspective for Contact Lens Solutions by Segment - Percentage Breakdown of Value Sales for Multi Purpose and Hydrogen Peroxide-based for the Years 2014, 2025 & 2030
- TABLE 185: Saudi Arabia Recent Past, Current & Future Analysis for Contact Lens Solutions by Distribution Channel - Retail, Eye-Care Professionals and Online - Independent Analysis of Annual Sales in US$ Thousand for the Years 2024 through 2030 and % CAGR
- TABLE 186: Saudi Arabia Historic Review for Contact Lens Solutions by Distribution Channel - Retail, Eye-Care Professionals and Online Markets - Independent Analysis of Annual Sales in US$ Thousand for Years 2014 through 2023 and % CAGR
- TABLE 187: Saudi Arabia 16-Year Perspective for Contact Lens Solutions by Distribution Channel - Percentage Breakdown of Value Sales for Retail, Eye-Care Professionals and Online for the Years 2014, 2025 & 2030
- UNITED ARAB EMIRATES
- TABLE 188: UAE Recent Past, Current & Future Analysis for Contact Lens Solutions by Segment - Multi Purpose and Hydrogen Peroxide-based - Independent Analysis of Annual Sales in US$ Thousand for the Years 2024 through 2030 and % CAGR
- TABLE 189: UAE Historic Review for Contact Lens Solutions by Segment - Multi Purpose and Hydrogen Peroxide-based Markets - Independent Analysis of Annual Sales in US$ Thousand for Years 2014 through 2023 and % CAGR
- TABLE 190: UAE 16-Year Perspective for Contact Lens Solutions by Segment - Percentage Breakdown of Value Sales for Multi Purpose and Hydrogen Peroxide-based for the Years 2014, 2025 & 2030
- TABLE 191: UAE Recent Past, Current & Future Analysis for Contact Lens Solutions by Distribution Channel - Retail, Eye-Care Professionals and Online - Independent Analysis of Annual Sales in US$ Thousand for the Years 2024 through 2030 and % CAGR
- TABLE 192: UAE Historic Review for Contact Lens Solutions by Distribution Channel - Retail, Eye-Care Professionals and Online Markets - Independent Analysis of Annual Sales in US$ Thousand for Years 2014 through 2023 and % CAGR
- TABLE 193: UAE 16-Year Perspective for Contact Lens Solutions by Distribution Channel - Percentage Breakdown of Value Sales for Retail, Eye-Care Professionals and Online for the Years 2014, 2025 & 2030
- REST OF MIDDLE EAST
- TABLE 194: Rest of Middle East Recent Past, Current & Future Analysis for Contact Lens Solutions by Segment - Multi Purpose and Hydrogen Peroxide-based - Independent Analysis of Annual Sales in US$ Thousand for the Years 2024 through 2030 and % CAGR
- TABLE 195: Rest of Middle East Historic Review for Contact Lens Solutions by Segment - Multi Purpose and Hydrogen Peroxide-based Markets - Independent Analysis of Annual Sales in US$ Thousand for Years 2014 through 2023 and % CAGR
- TABLE 196: Rest of Middle East 16-Year Perspective for Contact Lens Solutions by Segment - Percentage Breakdown of Value Sales for Multi Purpose and Hydrogen Peroxide-based for the Years 2014, 2025 & 2030
- TABLE 197: Rest of Middle East Recent Past, Current & Future Analysis for Contact Lens Solutions by Distribution Channel - Retail, Eye-Care Professionals and Online - Independent Analysis of Annual Sales in US$ Thousand for the Years 2024 through 2030 and % CAGR
- TABLE 198: Rest of Middle East Historic Review for Contact Lens Solutions by Distribution Channel - Retail, Eye-Care Professionals and Online Markets - Independent Analysis of Annual Sales in US$ Thousand for Years 2014 through 2023 and % CAGR
- TABLE 199: Rest of Middle East 16-Year Perspective for Contact Lens Solutions by Distribution Channel - Percentage Breakdown of Value Sales for Retail, Eye-Care Professionals and Online for the Years 2014, 2025 & 2030
- AFRICA
- Contact Lens Solutions Market Presence - Strong/Active/Niche/Trivial - Key Competitors in Africa for 2025 (E)
- TABLE 200: Africa Recent Past, Current & Future Analysis for Contact Lens Solutions by Segment - Multi Purpose and Hydrogen Peroxide-based - Independent Analysis of Annual Sales in US$ Thousand for the Years 2024 through 2030 and % CAGR
- TABLE 201: Africa Historic Review for Contact Lens Solutions by Segment - Multi Purpose and Hydrogen Peroxide-based Markets - Independent Analysis of Annual Sales in US$ Thousand for Years 2014 through 2023 and % CAGR
- TABLE 202: Africa 16-Year Perspective for Contact Lens Solutions by Segment - Percentage Breakdown of Value Sales for Multi Purpose and Hydrogen Peroxide-based for the Years 2014, 2025 & 2030
- TABLE 203: Africa Recent Past, Current & Future Analysis for Contact Lens Solutions by Distribution Channel - Retail, Eye-Care Professionals and Online - Independent Analysis of Annual Sales in US$ Thousand for the Years 2024 through 2030 and % CAGR
- TABLE 204: Africa Historic Review for Contact Lens Solutions by Distribution Channel - Retail, Eye-Care Professionals and Online Markets - Independent Analysis of Annual Sales in US$ Thousand for Years 2014 through 2023 and % CAGR
- TABLE 205: Africa 16-Year Perspective for Contact Lens Solutions by Distribution Channel - Percentage Breakdown of Value Sales for Retail, Eye-Care Professionals and Online for the Years 2014, 2025 & 2030
