
|
市場調査レポート
商品コード
1797861
UPS(無停電電源装置)市場の機会、成長促進要因、産業動向分析、2025年~2034年の予測Uninterruptible Power Supply (UPS) Market Opportunity, Growth Drivers, Industry Trend Analysis, and Forecast 2025 - 2034 |
||||||
カスタマイズ可能
|
|||||||
| UPS(無停電電源装置)市場の機会、成長促進要因、産業動向分析、2025年~2034年の予測 |
|
出版日: 2025年07月17日
発行: Global Market Insights Inc.
ページ情報: 英文 300 Pages
納期: 2~3営業日
|

全表示
- 概要
- 目次
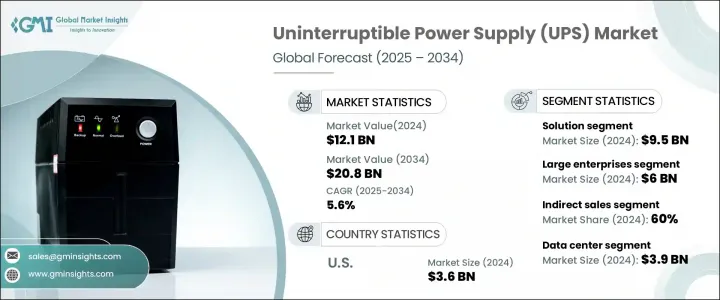
世界のUPS(無停電電源装置)市場は、2024年には121億米ドルとなり、CAGR 5.6%で成長し、2034年には208億米ドルに達すると推定されます。
成長の原動力となっているのは、世界のデジタルインフラの急速な拡大であり、そこでは電力の安定供給が不可欠です。クラウド・コンピューティング、人工知能、高度なデジタル・システムの採用が増加し、重要施設のエネルギー需要が大幅に高まっています。このような電力消費の急増は、中断のないオペレーションを保証できる堅牢で高性能なUPSソリューションに対する直接的なニーズを生み出しています。
産業界がよりテクノロジー主導のオペレーションに移行するにつれ、拡張性があり、エネルギー効率が高く、インテリジェントなUPSシステムに対する需要が急増すると予想されます。製造業者は、進化する性能と効率要件を満たすために、高度な監視システム、改良されたバッテリー技術、AI主導の診断の統合に注力しています。さらに、部門を問わず運用の回復力とエネルギーの最適化が重視されるようになっていることが、市場の着実な上昇軌道に影響を与えています。
| 市場範囲 | |
|---|---|
| 開始年 | 2024 |
| 予測年 | 2025-2034 |
| 開始金額 | 121億米ドル |
| 予測金額 | 208億米ドル |
| CAGR | 5.6% |
コンポーネント別に、市場はソリューションとサービスに分類されます。2024年にはソリューション部門が市場をリードし、総売上の80%以上、約95億米ドルを占める。このセグメントには、スタンバイ(オフライン)、ラインインタラクティブ、オンライン(二重変換)UPSシステムが含まれます。UPSの設置には資本集約的な性質があり、高度な電力保護システムに対する需要が高まっていることが、このセグメントの確固たる地位を支えています。企業が機密性の高い機器を障害から保護しようとする中、優れた信頼性と効率を提供するソリューションが大きな支持を集めています。
組織規模では、大企業が2024年に市場シェア全体の54%を占め、60億米ドル近い収益を上げます。これらの企業は通常、複雑なITインフラと複数のデータ施設を運用しており、高度な性能機能を備えた大容量UPSシステムの必要性を高めています。ミッションクリティカルなシステムへの依存が、UPS(無停電電源装置)を優先的な投資分野にしています。
販売チャネルに基づき、市場は直接販売と間接販売に区分されます。間接販売チャネルは2024年に市場の約60%を占め、2034年まで約5%のCAGRで拡大すると予測されています。全体としては間接販売チャネルのシェアが高いが、大規模な設置や高度にカスタマイズされたUPSプロジェクトでは直接販売が依然として好ましい選択肢です。直接契約により、プロバイダーはオーダーメイドのソリューションを提供し、顧客との緊密な関係を維持し、特定の技術要件に効率的に対処することができます。
アプリケーションの観点からは、市場はBFSI、データセンター、ヘルスケア、通信、産業アプリケーション、政府・防衛、その他を含むセクターをカバーしています。データセンターは2024年に39億米ドルを占め、2034年までのCAGRは約6.2%と予測されています。このセグメントは、デジタル作業負荷の増大と、運用継続性を確保するための信頼性の高いバックアップ電源システムの必要性により急速に拡大しています。
地域別では、米国が2024年に北米市場の75%以上を占め、36億米ドルの売上を計上しました。その強力なプレゼンスは、高度な技術インフラと大容量UPS導入への大規模投資によってもたらされました。デジタル・オペレーションの大規模化に伴い、同国では高効率でAI対応のUPSシステムに対する需要が高まり続けています。
世界のUPS業界で事業を展開する主要企業には、Vertiv、Schneider Electric、Legrand、Huawei、ABB、Socomec、Riello UPS、Eaton、Delta Electronics、Kstarなどがあります。競争は依然として激しく、メーカー各社は製品の効率、監視能力、統合の柔軟性を高めるため、研究開発に多額の投資を行っています。市場では、リチウムイオンバッテリー、AIベースの予測診断、クラウド対応モニタリングを組み込んで運用性能を向上させるソリューションへのシフトが見られます。インテリジェントで適応性が高く、エネルギーに配慮したUPSシステムの提供に注力するベンダーは、今後数年間で市場での地位を強化すると予想されます。
目次
第1章 調査手法
第2章 エグゼクティブサマリー
第3章 業界考察
- エコシステム分析
- サプライヤーの情勢
- 利益率
- コスト構造
- 各段階での付加価値
- バリューチェーンに影響を与える要因
- ディスラプション
- 業界への影響要因
- 促進要因
- データセンターの爆発的な成長とデジタル変革
- 電力品質の問題と停電による経済的影響の拡大
- 重要なインフラとヘルスケア分野の要件
- 5Gネットワークインフラと通信拡張
- 産業オートメーションと製造業の成長
- 業界の潜在的リスク&課題
- 総所有コストとメンテナンス負担の増大
- サプライチェーンの脆弱性と原材料依存
- 市場機会
- エネルギー統合とグリッド安定化ソリューション
- ハイパースケールデータセンターとクラウドコンピューティングインフラの爆発的な増加
- 通信および5Gインフラの導入加速
- 促進要因
- 成長可能性分析
- 規制情勢
- 北米
- 欧州
- アジア太平洋地域
- ラテンアメリカ
- 中東・アフリカ
- ポーター分析
- PESTEL分析
- テクノロジーとイノベーションの情勢
- 現在の技術動向
- 新興技術
- 価格動向
- 地域別
- 製品別
- 生産統計
- 生産拠点
- 消費拠点
- 輸出と輸入
- コスト内訳分析
- 特許分析
- 持続可能性と環境側面
- 持続可能な慣行
- 廃棄物削減戦略
- 生産におけるエネルギー効率
- 環境に優しい取り組み
- カーボンフットプリントの考慮
- UPSの故障分析とリスク評価
- 故障モード影響解析(FMEA)
- パワーエレクトロニクス部品の故障
- ソフトウェアおよび制御システムの障害
- 通信プロトコルの障害
- 包括的なケーススタディ分析
- 統計的故障解析
- UPSの種類とサイズ別の故障率データ
- 平均故障間隔(MTBF)分析
- 平均修復時間(MTTR)統計
- 可用性と信頼性の指標
- コスト影響分析
- リスク軽減戦略と対策
- 予防保守プロトコル
- 監視および診断システム
- 冗長設計の原則
- スタッフの研修と能力開発
- 業界のベストプラクティスと標準
- 温度管理
- バッテリー管理システム
- システムテストと検証
- 緊急対応と復旧
第4章 競合情勢
- イントロダクション
- 企業の市場シェア分析
- 北米
- 欧州
- アジア太平洋地域
- ラテンアメリカ
- 中東・アフリカ
- 主要市場企業の競合分析
- 競合ポジショニングマトリックス
- 戦略的展望マトリックス
- 主な発展
- 合併と買収
- パートナーシップとコラボレーション
- 新製品の発売
- 拡張計画と資金調達
第5章 市場推計・予測:コンポーネント別、2021年~2034年
- 主要動向
- ソリューション
- スタンバイ(オフライン)
- ラインインタラクティブ
- オンラインUPS
- サービス
- プロフェッショナル
- マネージド
第6章 市場推計・予測:組織規模別、2021年~2034年
- 主要動向
- 中小企業
- 大企業
第7章 市場推計・予測:容量別、2021年~2034年
- 主要動向
- 1kVA未満
- 1.1~5kVA
- 5.1~20kVA
- 20.1~50kVA
- 50.1~200kVA
- 200kVA以上
第8章 市場推計・予測:フェーズ別、2021年~2034年
- 主要動向
- 単相
- 三相
第9章 市場推計・予測:分類別、2021年~2034年
- 主要動向
- 集中化
- 分散型
第10章 市場推計・予測:流通チャネル別、2021年~2034年
- 主要動向
- 直接販売
- 間接販売
- 販売代理店
- 付加価値再販業者(VAR)
- eコマースプラットフォーム
第11章 市場推計・予測:最終用途別、2021年~2034年
- 主要動向
- BFSI
- データセンター
- ハイパースケールデータセンター
- コロケーション施設
- エンタープライズデータセンター
- エッジコンピューティング施設
- ヘルスケア
- 通信
- 産業用途
- 政府と防衛
- その他
第12章 市場推計・予測:地域別、2021年~2034年
- 主要動向
- 北米
- 米国
- カナダ
- メキシコ
- 欧州
- 英国
- ドイツ
- フランス
- イタリア
- スペイン
- ポーランド
- ロシア
- 北欧諸国
- アジア太平洋地域
- 中国
- インド
- 日本
- 韓国
- オーストラリア
- 東南アジア
- ラテンアメリカ
- ブラジル
- アルゼンチン
- チリ
- コロンビア
- 中東・アフリカ
- アラブ首長国連邦
- サウジアラビア
- 南アフリカ
第13章 企業プロファイル
- ABB
- Ablerex Electronics
- Arabian Power Electronics
- Delta Power Solutions
- Eaton
- Emerson Electric
- ENERSYS
- Huawei Technologies
- Kstar New Energy
- Legrand
- Microtek International
- Mitsubishi Electric
- Riello Elettronica
- Schneider Electric
- Siemens
- SOCOMEC Group
- SolarEdge Solution
- Techser Power Solutions
- Toshiba
- Vertiv
The Global Uninterruptible Power Supply Market was valued at USD 12.1 billion in 2024 and is estimated to grow at a CAGR of 5.6% to reach USD 20.8 billion by 2034. Growth is fueled by the rapid expansion of digital infrastructure worldwide, where constant power availability is essential. Increasing adoption of cloud computing, artificial intelligence, and advanced digital systems has significantly raised energy demand in critical facilities. This surge in electricity consumption is creating a direct need for robust, high-performance UPS solutions capable of ensuring uninterrupted operations.
As industries move toward more technology-driven operations, the demand for scalable, energy-efficient, and intelligent UPS systems is expected to rise sharply. Manufacturers are focusing on integrating advanced monitoring systems, improved battery technologies, and AI-driven diagnostics to meet evolving performance and efficiency requirements. Additionally, the increasing emphasis on operational resilience and energy optimization across sectors is influencing the market's steady upward trajectory.
| Market Scope | |
|---|---|
| Start Year | 2024 |
| Forecast Year | 2025-2034 |
| Start Value | $12.1 Billion |
| Forecast Value | $20.8 Billion |
| CAGR | 5.6% |
By component, the market is categorized into solution and service. The solution segment led the market in 2024, accounting for more than 80% of total revenue, approximately USD 9.5 billion. This segment includes standby (offline), line-interactive, and online (double conversion) UPS systems. Its strong position is supported by the capital-intensive nature of UPS installations and the growing demand for advanced power protection systems. As businesses seek to protect sensitive equipment from disruptions, solutions offering superior reliability and efficiency are gaining significant traction.
In terms of organization size, large enterprises dominated in 2024, securing 54% of the total market share and generating close to USD 6 billion in revenue. These organizations typically operate complex IT infrastructures and multiple data facilities, driving the need for high-capacity UPS systems with advanced performance features. Their reliance on mission-critical systems makes uninterrupted power supply a priority investment area.
Based on distribution channel, the market is segmented into direct sales and indirect sales. The indirect sales channel represented around 60% of the market in 2024 and is projected to expand at about 5% CAGR through 2034. While indirect channels capture a larger share overall, direct sales remain a preferred choice for large-scale installations and highly customized UPS projects. Direct engagement allows providers to deliver tailored solutions, maintain closer client relationships, and address specific technical requirements efficiently.
From an application perspective, the market covers sectors including BFSI, data centers, healthcare, telecommunications, industrial applications, government and defense, and others. Data centers accounted for USD 3.9 billion in 2024 and are forecast to grow at roughly 6.2% CAGR through 2034. This segment is expanding rapidly due to the increasing volume of digital workloads and the need for reliable backup power systems to ensure operational continuity.
Regionally, the U.S. held over 75% of the North American market in 2024, generating USD 3.6 billion in revenue. Its strong presence is driven by advanced technological infrastructure and significant investments in large-capacity UPS deployments. With the increasing scale of digital operations, demand for high-efficiency and AI-enabled UPS systems continues to rise in the country.
Key companies operating in the global UPS industry include Vertiv, Schneider Electric, Legrand, Huawei, ABB, Socomec, Riello UPS, Eaton, Delta Electronics, and Kstar. Competition remains intense, with manufacturers investing heavily in R&D to enhance product efficiency, monitoring capabilities, and integration flexibility. The market is seeing a shift toward solutions that incorporate lithium-ion batteries, AI-based predictive diagnostics, and cloud-enabled monitoring to improve operational performance. Vendors focusing on delivering intelligent, adaptable, and energy-conscious UPS systems are expected to strengthen their market position in the coming years.
Table of Contents
Chapter 1 Methodology
- 1.1 Market scope and definition
- 1.2 Research design
- 1.2.1 Research approach
- 1.2.2 Data collection methods
- 1.3 Data mining sources
- 1.3.1 Region
- 1.3.2 Country
- 1.4 Base estimates and calculations
- 1.4.1 Base year calculation
- 1.4.2 Key trends for market estimation
- 1.5 Primary research and validation
- 1.5.1 Primary sources
- 1.6 Forecast model
- 1.7 Research assumptions and limitations
Chapter 2 Executive Summary
- 2.1 Industry 3600 synopsis
- 2.2 Key market trends
- 2.2.1 Regional
- 2.2.2 Component
- 2.2.3 Organization size
- 2.2.4 Capacity
- 2.2.5 Phase
- 2.2.6 Topology
- 2.2.7 Distribution channel
- 2.2.8 End use
- 2.3 TAM Analysis, 2025-2034
- 2.4 CXO perspectives: Strategic imperatives
- 2.4.1 Executive decision points
- 2.4.2 Critical success factors
- 2.5 Future outlook and strategic recommendations
Chapter 3 Industry Insights
- 3.1 Industry ecosystem analysis
- 3.1.1 Supplier landscape
- 3.1.2 Profit margin
- 3.1.3 Cost structure
- 3.1.4 Value addition at each stage
- 3.1.5 Factor affecting the value chain
- 3.1.6 Disruptions
- 3.2 Industry impact forces
- 3.2.1 Growth drivers
- 3.2.1.1 Explosive data center growth and digital transformation
- 3.2.1.2 Escalating economic impact of power quality issues and outages
- 3.2.1.3 Critical infrastructure and healthcare sector requirements
- 3.2.1.4 5G network infrastructure and telecommunications expansion
- 3.2.1.5 Industrial automation and manufacturing sector growth
- 3.2.2 Industry pitfalls and challenges
- 3.2.2.1 Escalating total cost of ownership and maintenance burden
- 3.2.2.2 Supply chain vulnerabilities and raw material dependencies
- 3.2.3 Market opportunities
- 3.2.3.1 Energy integration and grid stabilization solutions
- 3.2.3.2 Hyperscale data centers and cloud computing infrastructure explosion
- 3.2.3.3 Telecommunications and 5G infrastructure deployment acceleration
- 3.2.1 Growth drivers
- 3.3 Growth potential analysis
- 3.4 Regulatory landscape
- 3.4.1 North America
- 3.4.2 Europe
- 3.4.3 Asia Pacific
- 3.4.4 Latin America
- 3.4.5 Middle East & Africa
- 3.5 Porter's analysis
- 3.6 PESTEL analysis
- 3.7 Technology and innovation landscape
- 3.7.1 Current technological trends
- 3.7.2 Emerging technologies
- 3.8 Price trends
- 3.8.1 By region
- 3.8.2 By product
- 3.9 Production statistics
- 3.9.1 Production hubs
- 3.9.2 Consumption hubs
- 3.9.3 Export and import
- 3.10 Cost breakdown analysis
- 3.11 Patent analysis
- 3.12 Sustainability and environmental aspects
- 3.12.1 Sustainable practices
- 3.12.2 Waste reduction strategies
- 3.12.3 Energy efficiency in production
- 3.12.4 Eco-friendly initiatives
- 3.12.5 Carbon footprint considerations
- 3.13 UPS failure analysis and risk assessment
- 3.13.1 Failure Mode and Effects Analysis (FMEA)
- 3.13.2 Power electronics component failures
- 3.13.3 Software and control system failures
- 3.13.4 Communication protocol failures
- 3.14 Comprehensive case study analysis
- 3.14.1 Internap NYC Multiple UPS Failures
- 3.14.1.1 Root cause: Failed electrical capacitors (7-year lifespan)
- 3.14.1.2 Impact: Multiple customer outages over 6 days
- 3.14.1.3 Lessons learned: Preventive replacement schedules
- 3.14.2 APC Smart UPS 2200 Recurring Problems
- 3.14.2.1 Root cause: Burnt resistors (R38 and R43) on main board
- 3.14.2.2 Solution: Higher wattage resistor replacements
- 3.14.2.3 Design flaw: Inadequate current handling capacity
- 3.14.3 Data Center Thermal Management Failures
- 3.14.3.1 UPS interaction with cooling systems
- 3.14.3.2 Temperature rise impact on IT equipment
- 3.14.3.3 320-second operational window after cooling failure
- 3.14.4 Industrial UPS Failures in Manufacturing
- 3.14.4.1 Process disruption and production losses
- 3.14.4.2 Safety system implications
- 3.14.4.3 Recovery time and restart procedures
- 3.14.5 Healthcare UPS Failures
- 3.14.5.1 Patient safety implications
- 3.14.5.2 Medical equipment protection requirements
- 3.14.5.3 Regulatory compliance and reporting
- 3.14.1 Internap NYC Multiple UPS Failures
- 3.15 Statistical failure analysis
- 3.15.1 Failure rate data by UPS type and size
- 3.15.2 Mean time between failures (MTBF) analysis
- 3.15.3 Mean time to repair (MTTR) statistics
- 3.15.4 Availability and reliability metrics
- 3.15.5 Cost impact analysis:
- 3.15.5.1 Average outage cost: $740,357 per incident
- 3.15.5.2 Downtime cost: $5,500 per minute
- 3.15.5.3 Replacement and repair costs
- 3.16 Risk mitigation strategies and countermeasures
- 3.16.1 Preventive maintenance protocols
- 3.16.2 Monitoring and diagnostic systems
- 3.16.3 Redundancy design principles
- 3.16.4 Staff training and competency development
- 3.17 Industry best practices and standards
- 3.17.1 Temperature management
- 3.17.2 Battery management systems
- 3.17.3 System Testing and validation
- 3.17.4 Emergency response and recovery
Chapter 4 Competitive Landscape, 2024
- 4.1 Introduction
- 4.2 Company market share analysis
- 4.2.1 North America
- 4.2.2 Europe
- 4.2.3 Asia Pacific
- 4.2.4 Latin America
- 4.2.5 Middle East & Africa
- 4.3 Competitive analysis of major market players
- 4.4 Competitive positioning matrix
- 4.5 Strategic outlook matrix
- 4.6 Key developments
- 4.6.1 Mergers & acquisitions
- 4.6.2 Partnerships & collaborations
- 4.6.3 New product launches
- 4.6.4 Expansion plans and funding
Chapter 5 Market Estimates & Forecast, By Component, 2021 - 2034 ($Mn, Units)
- 5.1 Key trends
- 5.2 Solution
- 5.2.1 Standby (Offline)
- 5.2.2 Line-interactive
- 5.2.3 Online UPS
- 5.3 Service
- 5.3.1 Professional
- 5.3.2 Managed
Chapter 6 Market Estimates & Forecast, By Organization Size, 2021 - 2034 ($Mn, Units)
- 6.1 Key trends
- 6.2 SME
- 6.3 Large enterprise
Chapter 7 Market Estimates & Forecast, By Capacity, 2021 - 2034 ($Mn, Units)
- 7.1 Key trends
- 7.2 Below 1 kVA
- 7.3 1.1 - 5 kVA
- 7.4 5.1 - 20 kVA
- 7.5 20.1 - 50 kVA
- 7.6 50.1 - 200 kVA
- 7.7 Above 200 kVA
Chapter 8 Market Estimates & Forecast, By Phase, 2021 - 2034 ($Mn, Units)
- 8.1 Key trends
- 8.2 Single phase
- 8.3 Three phase
Chapter 9 Market Estimates & Forecast, By Topology, 2021 - 2034 ($Mn, Units)
- 9.1 Key trends
- 9.2 Centralized
- 9.3 Decentralized
Chapter 10 Market Estimates & Forecast, By Distribution Channel, 2021 - 2034 ($Mn, Units)
- 10.1 Key trends
- 10.2 Direct sales
- 10.3 Indirect sales
- 10.3.1 Distributors
- 10.3.2 Value-Added Resellers (VARs)
- 10.3.3 E-commerce platforms
Chapter 11 Market Estimates & Forecast, By End Use, 2021 - 2034 ($Mn, Units)
- 11.1 Key trends
- 11.2 BFSI
- 11.3 Data center
- 11.3.1 Hyperscale data centers
- 11.3.2 Colocation facilities
- 11.3.3 Enterprise data centers
- 11.3.4 Edge computing facilities
- 11.4 Healthcare
- 11.5 Telecommunications
- 11.6 Industrial applications
- 11.7 Government & defense
- 11.8 Others
Chapter 12 Market Estimates & Forecast, By Region, 2021 - 2034 ($Bn, Units)
- 12.1 Key trends
- 12.2 North America
- 12.2.1 US
- 12.2.2 Canada
- 12.2.3 Mexico
- 12.3 Europe
- 12.3.1 UK
- 12.3.2 Germany
- 12.3.3 France
- 12.3.4 Italy
- 12.3.5 Spain
- 12.3.6 Poland
- 12.3.7 Russia
- 12.3.8 Nordics
- 12.4 Asia Pacific
- 12.4.1 China
- 12.4.2 India
- 12.4.3 Japan
- 12.4.4 South Korea
- 12.4.5 Australia
- 12.4.6 Southeast Asia
- 12.5 Latin America
- 12.5.1 Brazil
- 12.5.2 Argentina
- 12.5.3 Chile
- 12.5.4 Colombia
- 12.6 MEA
- 12.6.1 UAE
- 12.6.2 Saudi Arabia
- 12.6.3 South Africa
Chapter 13 Company Profiles
- 13.1 ABB
- 13.2 Ablerex Electronics
- 13.3 Arabian Power Electronics
- 13.4 Delta Power Solutions
- 13.5 Eaton
- 13.6 Emerson Electric
- 13.7 ENERSYS
- 13.8 Huawei Technologies
- 13.9 Kstar New Energy
- 13.10 Legrand
- 13.11 Microtek International
- 13.12 Mitsubishi Electric
- 13.13 Riello Elettronica
- 13.14 Schneider Electric
- 13.15 Siemens
- 13.16 SOCOMEC Group
- 13.17 SolarEdge Solution
- 13.18 Techser Power Solutions
- 13.19 Toshiba
- 13.20 Vertiv
