|
|
市場調査レポート
商品コード
1536018
手術台市場:製品別、デバイス別、材料別、最終用途別、世界予測、2024年~2032年Surgical Table Market - By Product, Device, Material, End-use, & Global Forecast 2024-2032 |
||||||
|
|||||||
カスタマイズ可能
|
|||||||

| 手術台市場:製品別、デバイス別、材料別、最終用途別、世界予測、2024年~2032年 |
|
出版日: 2024年06月21日
発行: Global Market Insights Inc.
ページ情報: 英文 130 Pages
納期: 2~3営業日
|

全表示
- 概要
- 目次
世界の手術台市場は2024年から2032年にかけて3.6%のCAGRを示す見込みで、外科手術技術の進歩と低侵襲手術の需要増が原動力となっています。
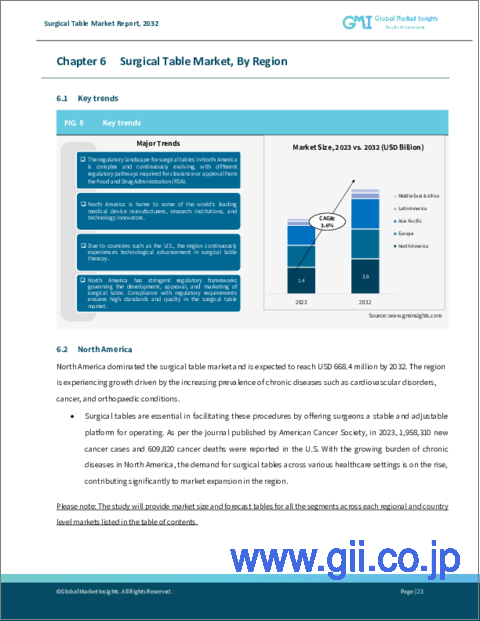
世界保健機関(WHO)によると、人口の高齢化と外科的介入を必要とする慢性疾患の増加により、世界的に外科手術の件数が増加すると予想されています。加えて、ヘルスケアインフラの改善と外科治療へのアクセス拡大が重視されるようになっていることも、市場の成長をさらに後押ししています。
外来手術センター(ASC)分野は、予測期間中に著しい成長を遂げると予測されています。ASCは、病院ベースの手術に代わる費用対効果に優れた効率的な選択肢を提供し、患者の滞在期間を短縮して質の高いケアを提供します。感染リスクが低く回復が早いことから外来患者による手術が好まれるようになり、ASCにおける高度な手術台の需要が高まっています。さらに、有利な政府政策と償還シナリオに後押しされたASCの世界の増加が、このセグメントの手術台市場の見通しを高めています。
小児用手術台セグメントは、2032年までに大きな市場シェアを獲得する見込みです。先天性疾患の有病率の上昇と小児手術件数の増加により、小児用に設計された特殊な手術台が必要とされています。小児用手術台は、調節可能な高さ、安全性の向上、人間工学に基づいた設計など、幼い患者特有のニーズに応える機能を備えています。医療技術の進歩や、小児外科手術の治療成績向上への注目の高まりが、こうした専用テーブルの採用を後押ししています。小児人口の拡大と小児ヘルスケアサービスへのアクセスの向上が、市場の成長をさらに後押ししています。
欧州の手術台市場は、2024年から2032年にかけて顕著な成長を遂げる見込みです。医療インフラが整備され、医学研究に多額の投資が行われ、慢性疾患の有病率が高いことが同地域の市場成長に寄与しています。強固な規制の枠組みが医療機器の品質と安全性を確保し、高度な手術台の信頼と普及を促進しています。さらに、ヘルスケア構想に対する政府の支援や大手医療機器メーカーの存在がイノベーションと生産を促進し、欧州の手術台市場の力強い成長に寄与しています。
目次
第1章 調査手法と調査範囲
第2章 エグゼクティブサマリー
第3章 業界洞察
- エコシステム分析
- 業界への影響要因
- 促進要因
- ヘルスケア支出の増加
- ライフスタイルの変化による手術件数の増加
- 老人人口の増加
- 病院および外来手術センターの増加
- 業界の潜在的リスク&課題
- 複合手術台の高コスト
- 未開発地域や発展途上地域における、高度な手術台を操作する熟練した専門家の不足
- 促進要因
- 成長可能性分析
- 規制状況
- ポーター分析
- PESTEL分析
第4章 競合情勢
- イントロダクション
- 企業マトリックス分析
- 競合ポジショニングマトリックス
- ベンダー・マトリックス分析
- 戦略ダッシュボード
第5章 市場推計・予測:製品タイプ別、2021年~2032年
- 主要動向
- 一般
- 専門分野
- 肥満治療
- 神経
- 泌尿器科
- 整形外科
- その他の専門手術台
- 小児用
- 放射線透過性
第6章 市場推計・予測:デバイスタイプ別、2021年~2032年
- 主要動向
- 動力
- 電動式
- 油圧式
- ハイブリッド
- 動力なし
第7章 市場推計・予測:材料別、2021年~2032年
- 主要動向
- 金属
- 複合材料
第8章 市場推計・予測:最終用途別、2021年~2032年
- 主要動向
- 病院および診療所
- 外来手術センター
- その他のエンドユーザー
第9章 市場推計・予測:地域別、2021年~2032年
- 主要動向
- 北米
- 米国
- カナダ
- 欧州
- ドイツ
- 英国
- フランス
- イタリア
- スペイン
- オランダ
- その他欧州
- アジア太平洋
- 中国
- 日本
- インド
- オーストラリア
- 韓国
- その他アジア太平洋地域
- ラテンアメリカ
- ブラジル
- メキシコ
- アルゼンチン
- その他ラテンアメリカ
- 中東・アフリカ
- サウジアラビア
- 南アフリカ
- アラブ首長国連邦
- その他中東とアフリカ
第10章 企業プロファイル
- ALVO Medical
- AMTAI Medical Equipment, Inc
- Baxter International, Inc.
- Getinge AB
- Mizuho Medical Co. Ltd.
- Narang Medical Limited
- SKYTRON, LLC
- STERIS plc
- Stille AB
- Stryker Corporation
Global Surgical Table Market will demonstrate 3.6% CAGR from 2024 to 2032, driven by advancements in surgical technology and increasing demand for minimally invasive procedures. According to the World Health Organization (WHO), the number of surgical procedures globally is expected to rise, fueled by an aging population and an increase in chronic diseases requiring surgical interventions. In addition, the growing emphasis on improving healthcare infrastructure and expanding access to surgical care further propels market growth.
The overall surgical table market is categorized based on product type, device type, material, end use, and region.
The ambulatory surgical centers (ASCs) segment is projected to experience remarkable growth over the forecast period. ASCs offer cost-effective and efficient alternatives to hospital-based surgeries, providing high-quality care with reduced patient stay duration's. The increasing preference for outpatient surgeries due to lower infection risks and faster recovery times boosts the demand for advanced surgical tables in ASCs. Furthermore, the rise in the number of ASCs globally, driven by favorable government policies and reimbursement scenarios, enhances the market prospects for surgical tables in this segment.
The pediatric surgical tables segment is expected to capture a significant market share by 2032. The rising prevalence of congenital disorders and the increasing number of pediatric surgeries necessitate specialized surgical tables designed for children. Pediatric surgical tables offer features such as adjustable height, enhanced safety, and ergonomic design to cater to the unique needs of young patients. Advances in medical technology and a growing focus on improving pediatric surgical outcomes drive the adoption of these specialized tables. The expanding pediatric population and improved access to pediatric healthcare services further support market growth.
Europe surgical table market is poised to achieve commendable gains throughout 2024-2032. A well-established healthcare infrastructure, significant investment in medical research, and a high prevalence of chronic diseases contribute to market growth in the region. Robust regulatory frameworks ensure the quality and safety of medical devices, fostering trust and widespread use of advanced surgical tables. Additionally, government support for healthcare initiatives and the presence of leading medical device manufacturers drive innovation and production, contributing to the strong growth of the surgical table market in Europe.
Table of Contents
Chapter 1 Methodology & Scope
- 1.1 Market scope & definitions
- 1.2 Research design
- 1.2.1 Research approach
- 1.2.2 Data collection methods
- 1.3 Base estimates & calculations
- 1.3.1 Base year calculation
- 1.3.2 Key trends for market estimation
- 1.4 Forecast model
- 1.5 Primary research and validation
- 1.5.1 Primary sources
- 1.5.2 Data mining sources
Chapter 2 Executive Summary
- 2.1 Industry 360° synopsis
Chapter 3 Industry Insights
- 3.1 Industry ecosystem analysis
- 3.2 Industry impact forces
- 3.2.1 Growth drivers
- 3.2.1.1 Growing healthcare expenditure
- 3.2.1.2 Rising number of surgeries due to changing lifestyle
- 3.2.1.3 Growing geriatric population
- 3.2.1.4 Increasing number of hospitals and ambulatory surgical centers
- 3.2.2 Industry pitfalls & challenges
- 3.2.2.1 High cost of composite surgical table
- 3.2.2.2 Lack of skilled professionals for operating sophisticated surgical tables in underdeveloped and developing regions
- 3.2.1 Growth drivers
- 3.3 Growth potential analysis
- 3.4 Regulatory landscape
- 3.5 Porter's analysis
- 3.6 PESTEL analysis
Chapter 4 Competitive Landscape, 2023
- 4.1 Introduction
- 4.2 Company matrix analysis
- 4.3 Competitive positioning matrix
- 4.4 Vendor matrix analysis
- 4.5 Strategy dashboard
Chapter 5 Market Estimates and Forecast, By Product Type, 2021 - 2032 ($ Mn)
- 5.1 Key trends
- 5.2 General
- 5.3 Specialty
- 5.3.1 Bariatric
- 5.3.2 Neurology
- 5.3.3 Urology
- 5.3.4 Orthopedic
- 5.3.5 Other specialty surgical tables
- 5.4 Pediatric
- 5.5 Radiolucent
Chapter 6 Market Estimates and Forecast, By Device Type, 2021 - 2032 ($ Mn)
- 6.1 Key trends
- 6.2 Powered
- 6.2.1 Electric
- 6.2.2 Hydraulic
- 6.2.3 Hybrid
- 6.3 Non-powered
Chapter 7 Market Estimates and Forecast, By Material, 2021 - 2032 ($ Mn)
- 7.1 Key trends
- 7.2 Metal
- 7.3 Composite
Chapter 8 Market Estimates and Forecast, By End-use, 2021 - 2032 ($ Mn)
- 8.1 Key trends
- 8.2 Hospitals and clinics
- 8.3 Ambulatory surgical centers
- 8.4 Other end-users
Chapter 9 Market Estimates and Forecast, By Region, 2021 - 2032 ($ Mn)
- 9.1 Key trends
- 9.2 North America
- 9.2.1 U.S.
- 9.2.2 Canada
- 9.3 Europe
- 9.3.1 Germany
- 9.3.2 UK
- 9.3.3 France
- 9.3.4 Italy
- 9.3.5 Spain
- 9.3.6 Netherlands
- 9.3.7 Rest of Europe
- 9.4 Asia Pacific
- 9.4.1 China
- 9.4.2 Japan
- 9.4.3 India
- 9.4.4 Australia
- 9.4.5 South Korea
- 9.4.6 Rest of Asia Pacific
- 9.5 Latin America
- 9.5.1 Brazil
- 9.5.2 Mexico
- 9.5.3 Argentina
- 9.5.4 Rest of Latin America
- 9.6 Middle East and Africa
- 9.6.1 Saudi Arabia
- 9.6.2 South Africa
- 9.6.3 UAE
- 9.6.4 Rest of Middle East and Africa
Chapter 10 Company Profiles
- 10.1 ALVO Medical
- 10.2 AMTAI Medical Equipment, Inc
- 10.3 Baxter International, Inc.
- 10.4 Getinge AB
- 10.5 Mizuho Medical Co. Ltd.
- 10.6 Narang Medical Limited
- 10.7 SKYTRON, LLC
- 10.8 STERIS plc
- 10.9 Stille AB
- 10.10 Stryker Corporation

