
|
市場調査レポート
商品コード
1801821
ホスピタリティ収益管理および価格分析市場の機会、成長促進要因、産業動向分析、2025年~2034年の予測Hospitality Revenue Management and Pricing Analytics Market Opportunity, Growth Drivers, Industry Trend Analysis, and Forecast 2025 - 2034 |
||||||
カスタマイズ可能
|
|||||||
| ホスピタリティ収益管理および価格分析市場の機会、成長促進要因、産業動向分析、2025年~2034年の予測 |
|
出版日: 2025年08月06日
発行: Global Market Insights Inc.
ページ情報: 英文 190 Pages
納期: 2~3営業日
|

全表示
- 概要
- 目次
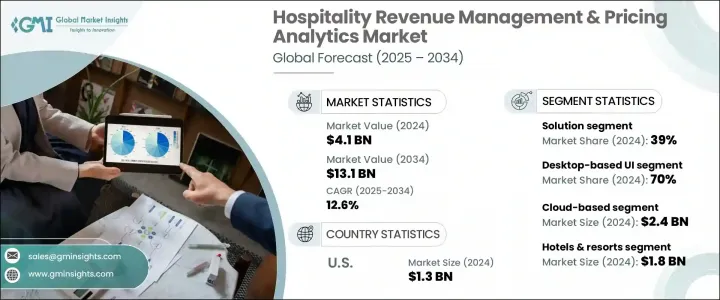
世界のホスピタリティ収益管理および価格分析市場の2024年の市場規模は41億米ドルで、CAGR 12.6%で成長し、2034年には131億米ドルに達すると推定されます。
機敏でデータ主導の価格設定モデルに対するニーズの高まりにより、ホスピタリティ事業の運営方法が再構築されつつあります。競争の激化とゲストの嗜好の変化により、標準的な価格設定方法は急速に時代遅れになりつつあります。その代わりに、業界は機械学習、人工知能、クラウドを活用した収益管理プラットフォームに支えられたダイナミックプライシングに傾倒しています。
これらのテクノロジーにより、ホテルは需要予測を改善し、競合価格を評価し、より賢い価格決定を行うことができるようになり、客室稼働率を向上させるだけでなく、利用可能客室1室あたりの売上(RevPAR)を増加させることができます。また、ゲストサービスやロイヤルティ追跡のためのモバイル・エンゲージメント・ツールと統合されたRMSソリューションを活用しているホテルは、エネルギー使用を最適化し、ゲストの体験を向上させています。このようなデジタルシフトは、予約システム、ローカルサービス、パーソナライズされたゲストとのコミュニケーションを結びつけることで、ゲストの利便性と収益の伸びの両方をサポートしています。
| 市場範囲 | |
|---|---|
| 開始年 | 2024 |
| 予測年 | 2025-2034 |
| 開始金額 | 41億米ドル |
| 予測金額 | 131億米ドル |
| CAGR | 12.6% |
クラウドベースのセグメントは、2024年に24億米ドルのシェアを生み出しました。これらのシステムはリアルタイムの分析と自動化された戦略調整を提供し、様々なロケーションのオペレーターに実用的な洞察を与えます。その柔軟性は、特に大規模なホテルグループや複数ブランドの運営に有益です。チャネル・マネージャー、セントラル・リザベーション・システム(CRS)、プロパティ・マネジメント・システム(PMS)などの他のコア・システムとの統合により、統一されたテクノロジー・エコシステムが構築され、シームレスなデータ共有と価格管理が可能になります。これらのプラットフォームはまた、直接予約チャネルと第三者予約チャネルの料金管理を強化し、利益率と運営の俊敏性の両方を向上させる。
ホテル・リゾート部門は、2024年に18億米ドルを創出しました。このセクターは積極的な競争に直面し、大量に運営されているため、客室稼働率と全体的な収益を最大化するための価格戦略の精度が求められます。ホテルは、宿泊施設からフードサービス、ウェルネスセンター、イベントスペースに至るまで、多様な収益の流れを管理しているため、すべての運営分野で同期化された価格設定と高度な需要予測が必要となります。1室あたりの収益と部門ごとの収益性を重視するため、高度なアナリティクスの活用が不可欠です。
米国のホスピタリティ収益管理および価格分析市場は、技術革新と最先端技術の採用により、2024年に大きな収益を上げました。米国の大手ホテルブランドは、予測分析、AI主導の意思決定ツール、リアルタイムの価格設定モデルに多額の投資を行っています。これらのシステムは、稼働パターン、顧客の予約行動、市場力学、競合レートを評価し、動的な価格設定モデルを生成します。米国を拠点とするホテルは、よりスマートなビジネス上の意思決定をサポートし、運営上のパフォーマンスを向上させるアナリティクスファーストの文化を作り上げています。
ホスピタリティ収益管理および価格分析市場のイノベーションを推進する主要企業には、SAP SE、Lybra、ファーウェイ、オラクル、Atomize RMS、FLYR Hospitality、BEONxなどがあります。これらの企業は、先進的な技術とインテリジェントな価格設定ツールで市場の展望を進化させるのに役立っています。ホスピタリティの収益管理と価格分析市場でより強力なプレゼンスを確立するため、主要企業はさまざまな戦略的取り組みを実施しています。主な焦点は、リアルタイムの意思決定とダイナミックな価格最適化を可能にするAI搭載プラットフォームの開発です。多くの企業がクラウドベースのRMSを強化し、拡張性、更新の迅速化、PMSやCRSといった既存のホテルシステムとの統合を図っています。
目次
第1章 調査手法と範囲
第2章 エグゼクティブサマリー
第3章 業界考察
- エコシステム分析
- サプライヤーの情勢
- テクノロジーベンダーと開発者
- システムインテグレーターとコンサルタント
- データプロバイダーと市場情報
- ホテル運営者および収益管理者
- 流通パートナーとチャネル
- コスト構造
- 利益率
- 各段階での付加価値
- サプライチェーンに影響を与える要因
- 破壊者
- サプライヤーの情勢
- 影響要因
- 促進要因
- ホスピタリティ業界のデジタル変革
- 競争圧力と利益の最適化
- ダイナミックプライシングに対するゲストの期待
- 流通チャネルの複雑性管理
- 業界の潜在的リスク&課題
- スタッフのトレーニングと管理
- 実装と保守のコストが高め
- 市場機会
- COVID後の回復と適応
- 持続可能性とESGの統合
- 促進要因
- 成長可能性分析
- ポーターの分析
- PESTEL分析
- テクノロジーとイノベーションの情勢
- 現在の技術
- 新興技術
- 特許分析
- 規制情勢
- 北米
- 欧州
- アジア太平洋地域
- ラテンアメリカ
- 中東・アフリカ
- 実装方法論
- 段階的な展開戦略
- パイロットプログラムのフレームワーク
- ビッグバン実装アプローチ
- ハイブリッド実装モデル
- リスク軽減戦略
- 変更管理フレームワーク
- ステークホルダーの関与と賛同
- トレーニングとスキル開発
- プロセスリエンジニアリングと最適化
- パフォーマンス測定
- 継続的な改善プロセス
- データの統合と移行
- 履歴データの分析とクレンジング
- リアルタイムデータフィード統合
- サードパーティのデータソース統合
- データ品質保証プロセス
- バックアップとリカバリの手順
- 成功要因とベストプラクティス
- エグゼクティブスポンサーシップとリーダーシップ
- 部門横断的なチームコラボレーション
- ベンダーパートナーシップとサポート
- ユーザーの採用とエンゲージメント
- パフォーマンスの監視と最適化
- 実装上の課題と解決策
- 技術的な統合の複雑さ
- データサイロと不整合
- スタッフの抵抗と研修のギャップ
- 予算の制約とROIのプレッシャー
- タイムラインとリソース管理
- 持続可能性分析
- 持続可能な慣行
- 廃棄物削減戦略
- 生産におけるエネルギー効率
- 環境に優しい取り組み
- カーボンフットプリントの考慮
第4章 競合情勢
- イントロダクション
- 企業の市場シェア分析
- 北米
- 欧州
- アジア太平洋地域
- ラテンアメリカ
- 中東・アフリカ
- 競合ポジショニングマトリックス
- 戦略的展望マトリックス
- 主な発展
- 合併と買収
- パートナーシップとコラボレーション
- 新製品の発売
- 拡張計画と資金調達
第5章 市場推計・予測:コンポーネント別、2021年~2034年
- 主要動向
- ソリューション
- 収益管理システム(RMS)
- 予測と需要モデリング
- 請求と支払い
- ビジネスインテリジェンスとレポート
- 価格分析プラットフォーム
- チャンネル管理
- その他
- サービス
- 専門サービス
- コンサルティングと戦略
- 展開と統合
- サポートとメンテナンス
- マネージドサービス
- 専門サービス
- ソリューション
第6章 市場推計・予測:プラットフォーム別、2021年~2034年
- 主要動向
- デスクトップベースのUI
- モバイル/タブレットRMSアプリ
第7章 市場推計・予測:展開モデル別、2021年~2034年
- 主要動向
- クラウドベース
- オンプレミス
- ハイブリッド
第8章 市場推計・予測:所有別、2021年~2034年
- 主要動向
- 独立
- チェーン店とフランチャイズ店
- リースおよび管理
第9章 市場推計・予測:用途別、2021年~2034年
- 主要動向
- 客室収益管理
- 食品・飲料の収益管理
- スパとウェルネスの収益管理
- イベントと会議の収益管理
- 付随収益管理
- 総収益管理
第10章 市場推計・予測:最終用途別、2021年~2034年
- 主要動向
- ホテル&リゾート
- レストランと食品サービス
- クルーズラインとカジノ
- 短期レンタル
- 長期滞在型ホテルとアパートメントホテル
第11章 市場推計・予測:地域別、2021年~2034年
- 北米
- 米国
- カナダ
- 欧州
- 英国
- ドイツ
- フランス
- イタリア
- スペイン
- ベルギー
- オランダ
- スウェーデン
- アジア太平洋地域
- 中国
- インド
- 日本
- オーストラリア
- シンガポール
- 韓国
- ベトナム
- タイ
- フィリピン
- インドネシア
- ラテンアメリカ
- ブラジル
- メキシコ
- アルゼンチン
- 中東・アフリカ
- 南アフリカ
- サウジアラビア
- アラブ首長国連邦
第12章 企業プロファイル
- Aiosell
- Mews
- BEONx
- Cendyn
- Cloudbeds
- Duetto
- eZee Mint
- FLYR Hospitality
- Hotellistat
- Huawei
- IDeaS Revenue Solutions
- Infor
- Lighthouse Intelligence
- Lybra
- Oracle
- PriceLabs
- Revnomix Solutions
- RevPar Guru
- RoomPriceGenie
- SAP SE
The Global Hospitality Revenue Management & Pricing Analytics Market was valued at USD 4.1 billion in 2024 and is estimated to grow at a CAGR of 12.6% to reach USD 13.1 billion by 2034. The increasing need for agile, data-driven pricing models is reshaping how hospitality businesses operate. Standard pricing methods are quickly becoming outdated due to rising competition and shifting guest preferences. Instead, the industry is gravitating toward dynamic pricing supported by machine learning, artificial intelligence, and cloud-powered revenue management platforms.
These technologies enable hotels to better forecast demand, evaluate competitive pricing, and make smarter pricing decisions that not only improve occupancy but also drive higher revenue per available room (RevPAR). Properties leveraging integrated RMS solutions with mobile engagement tools for guest services and loyalty tracking are also optimizing energy use and enhancing guest experiences. This digital shift supports both guest convenience and revenue growth by connecting reservation systems, local services, and personalized guest communication.
| Market Scope | |
|---|---|
| Start Year | 2024 |
| Forecast Year | 2025-2034 |
| Start Value | $4.1 Billion |
| Forecast Value | $13.1 Billion |
| CAGR | 12.6% |
The cloud-based segment generated USD 2.4 billion share in 2024. These systems offer real-time analytics and automated strategy adjustments, giving operators across various locations actionable insights. Their flexibility is particularly beneficial for larger hotel groups and multi-brand operations. Integration with other core systems like channel managers, central reservation systems (CRS), and property management systems (PMS) creates a unified technology ecosystem, allowing for seamless data sharing and pricing control. These platforms also enhance rate management across direct and third-party booking channels, improving both profit margins and operational agility.
The hotels and resorts segment generated USD 1.8 billion in 2024. This sector faces aggressive competition and operates at high volume, requiring precision in pricing strategies to maximize room occupancy and overall revenue. Hotels manage a diverse set of revenue streams-from accommodations to food services, wellness centers, and event spaces-which necessitate synchronized pricing and advanced demand prediction across all operational areas. The emphasis on revenue per room and profitability per department makes the use of advanced analytics indispensable.
United States Hospitality Revenue Management & Pricing Analytics Market generated significant revenues in 2024 driven by innovation and adopting cutting-edge technologies. Leading hotel brands across the US have heavily invested in predictive analytics, AI-driven decision-making tools, and real-time pricing models. These systems assess occupancy patterns, customer booking behaviors, market dynamics, and competitive rates to generate dynamic pricing models. US-based hotels have created an analytics-first culture that supports smarter business decisions and enhances operational performance.
Key players driving innovation in Hospitality Revenue Management & Pricing Analytics Market include SAP SE, Lybra, Huawei, Oracle, Atomize RMS, FLYR Hospitality, and BEONx. These companies are instrumental in evolving the market landscape with advanced technologies and intelligent pricing tools. To establish a stronger presence in the hospitality revenue management and pricing analytics market, major companies have embraced a variety of strategic initiatives. A primary focus is on developing AI-powered platforms that enable real-time decision-making and dynamic pricing optimization. Many firms are enhancing their cloud-based RMS offerings to ensure scalability, faster updates, and integration with existing hotel systems such as PMS and CRS.
Table of Contents
Chapter 1 Methodology & Scope
- 1.1 Research design
- 1.1.1 Research approach
- 1.1.2 Data collection methods
- 1.2 Data mining sources
- 1.2.1 Global
- 1.2.2 Regional/Country
- 1.3 Base estimates & calculations
- 1.3.1 Base year calculation
- 1.3.2 Key trends for market estimation
- 1.4 Forecast model
- 1.5 Primary research and validation
- 1.5.1 Primary sources
- 1.6 Research assumptions and limitations
Chapter 2 Executive Summary
- 2.1 Industry 360° synopsis
- 2.2 Key market trends
- 2.2.1 Regional
- 2.2.2 Offering
- 2.2.3 Platform
- 2.2.4 Deployment model
- 2.2.5 Ownership
- 2.2.6 Application
- 2.2.7 End use
- 2.3 TAM Analysis, 2025-2034
- 2.4 CXO perspectives: Strategic imperatives
- 2.4.1 Key decision points for industry executives
- 2.4.2 Critical success factors for market players
- 2.5 Future outlook and strategic recommendations
Chapter 3 Industry Insights
- 3.1 Industry ecosystem analysis
- 3.1.1 Supplier landscape
- 3.1.1.1 Technology vendors and developers
- 3.1.1.2 System integrators and consultants
- 3.1.1.3 Data providers and market intelligence
- 3.1.1.4 Hotel operators and revenue managers
- 3.1.1.5 Distribution partners and channels
- 3.1.2 Cost structure
- 3.1.3 Profit margin
- 3.1.4 Value addition at each stage
- 3.1.5 Factors impacting the supply chain
- 3.1.6 Disruptors
- 3.1.1 Supplier landscape
- 3.2 Impact on forces
- 3.2.1 Growth drivers
- 3.2.1.1 Digital transformation in hospitality
- 3.2.1.2 Competitive pressure and profit optimization
- 3.2.1.3 Guest expectations for dynamic pricing
- 3.2.1.4 Distribution channel complexity management
- 3.2.2 Industry pitfalls & challenges
- 3.2.2.1 Staff training and management
- 3.2.2.2 High implementation and maintenance costs
- 3.2.3 Market opportunities
- 3.2.3.1 Post-COVID recovery and adaptation
- 3.2.3.2 Sustainability and ESG integration
- 3.2.1 Growth drivers
- 3.3 Growth potential analysis
- 3.4 Porter’s analysis
- 3.5 PESTEL analysis
- 3.6 Technology & innovation landscape
- 3.6.1 Current technologies
- 3.6.2 Emerging technologies
- 3.7 Patent analysis
- 3.8 Regulatory landscape
- 3.8.1 North America
- 3.8.2 Europe
- 3.8.3 Asia Pacific
- 3.8.4 Latin America
- 3.8.5 Middle East & Africa
- 3.9 Implementation methodologies
- 3.9.1 Phased rollout strategies
- 3.9.2 Pilot program frameworks
- 3.9.3 Big bang implementation approaches
- 3.9.4 Hybrid implementation models
- 3.9.5 Risk mitigation strategies
- 3.10 Change management framework
- 3.10.1 Stakeholder engagement and buy-in
- 3.10.2 Training and skill development
- 3.10.3 Process reengineering and optimization
- 3.10.4 Performance measurement
- 3.10.5 Continuous improvement processes
- 3.11 Data integration and migration
- 3.11.1 Historical data analysis and cleansing
- 3.11.2 Real-time data feed integration
- 3.11.3 Third-party data source integration
- 3.11.4 Data quality assurance processes
- 3.11.5 Backup and recovery procedures
- 3.12 Success factors and best practices
- 3.12.1 Executive sponsorship and leadership
- 3.12.2 Cross-functional team collaboration
- 3.12.3 Vendor partnership and support
- 3.12.4 User adoption and engagement
- 3.12.5 Performance monitoring and optimization
- 3.13 Implementation challenges and solutions
- 3.13.1 Technical integration complexities
- 3.13.2 Data silos and inconsistencies
- 3.13.3 Staff resistance and training gaps
- 3.13.4 Budget constraints and ROI pressure
- 3.13.5 Timeline and resource management
- 3.14 Sustainability analysis
- 3.14.1 Sustainable practices
- 3.14.2 Waste reduction strategies
- 3.14.3 Energy efficiency in production
- 3.14.4 Eco-friendly initiatives
- 3.14.5 Carbon footprint considerations
Chapter 4 Competitive Landscape, 2024
- 4.1 Introduction
- 4.2 Company market share analysis
- 4.2.1 North America
- 4.2.2 Europe
- 4.2.3 Asia Pacific
- 4.2.4 Latin America
- 4.2.5 Middle East & Africa
- 4.3 Competitive positioning matrix
- 4.4 Strategic outlook matrix
- 4.5 Key developments
- 4.5.1 Mergers & acquisitions
- 4.5.2 Partnerships & collaborations
- 4.5.3 New Product Launches
- 4.6 Expansion Plans and funding
Chapter 5 Market Estimates & Forecast, By Component, 2021 - 2034 ($Bn)
- 5.1 Key trends
- 5.1.1 Solution
- 5.1.1.1 Revenue Management System (RMS)
- 5.1.1.2 Forecasting & demand modeling
- 5.1.1.3 Billing and payment
- 5.1.1.4 Business intelligence and reporting
- 5.1.1.5 Pricing analytics platforms
- 5.1.1.6 Channel management
- 5.1.1.7 Others
- 5.1.2 Services
- 5.1.2.1 Professional services
- 5.1.2.1.1 Consulting & strategy
- 5.1.2.1.2 Deployment & integration
- 5.1.2.1.3 Support & maintenance
- 5.1.2.2 Managed services
- 5.1.2.1 Professional services
- 5.1.1 Solution
Chapter 6 Market Estimates & Forecast, By Platform, 2021 - 2034 ($Bn)
- 6.1 Key trends
- 6.2 Desktop-based UI
- 6.3 Mobile/Tablet RMS Apps
Chapter 7 Market Estimates & Forecast, By Deployment Model, 2021 - 2034 ($Bn)
- 7.1 Key trends
- 7.2 Cloud-based
- 7.3 On-premises
- 7.4 Hybrid
Chapter 8 Market Estimates & Forecast, By Ownership, 2021 - 2034 ($Bn)
- 8.1 Key trends
- 8.2 Independent
- 8.3 Chain and franchises
- 8.4 Leased and managed
Chapter 9 Market Estimates & Forecast, By Application, 2021 - 2034 ($Bn)
- 9.1 Key trends
- 9.2 Room revenue management
- 9.3 Food and beverage revenue management
- 9.4 Spa and wellness revenue management
- 9.5 Event and meeting revenue management
- 9.6 Ancillary revenue management
- 9.7 Total revenue management
Chapter 10 Market Estimates & Forecast, By End Use, 2021 - 2034 ($Bn)
- 10.1 Key trends
- 10.2 Hotels & resorts
- 10.3 Restaurants & food services
- 10.4 Cruise lines & casinos
- 10.5 Short-term rentals
- 10.6 Extended stay and apartment hotels
Chapter 11 Market Estimates & Forecast, By Region, 2021 - 2034 ($Bn)
- 11.1 North America
- 11.1.1 U.S.
- 11.1.2 Canada
- 11.2 Europe
- 11.2.1 UK
- 11.2.2 Germany
- 11.2.3 France
- 11.2.4 Italy
- 11.2.5 Spain
- 11.2.6 Belgium
- 11.2.7 Netherlands
- 11.2.8 Sweden
- 11.3 Asia Pacific
- 11.3.1 China
- 11.3.2 India
- 11.3.3 Japan
- 11.3.4 Australia
- 11.3.5 Singapore
- 11.3.6 South Korea
- 11.3.7 Vietnam
- 11.3.8 Thailand
- 11.3.9 Philippines
- 11.3.10 Indonesia
- 11.4 Latin America
- 11.4.1 Brazil
- 11.4.2 Mexico
- 11.4.3 Argentina
- 11.5 MEA
- 11.5.1 South Africa
- 11.5.2 Saudi Arabia
- 11.5.3 UAE
Chapter 12 Company Profiles
- 12.1 Aiosell
- 12.2 Mews
- 12.3 BEONx
- 12.4 Cendyn
- 12.5 Cloudbeds
- 12.6 Duetto
- 12.7 eZee Mint
- 12.8 FLYR Hospitality
- 12.9 Hotellistat
- 12.10 Huawei
- 12.11 IDeaS Revenue Solutions
- 12.12 Infor
- 12.13 Lighthouse Intelligence
- 12.14 Lybra
- 12.15 Oracle
- 12.16 PriceLabs
- 12.17 Revnomix Solutions
- 12.18 RevPar Guru
- 12.19 RoomPriceGenie
- 12.20 SAP SE
