
バスバートランキングシステム市場の機会、成長促進要因、産業動向分析、2025年~2034年の予測
Busbar Trunking System Market Opportunity, Growth Drivers, Industry Trend Analysis, and Forecast 2025 - 2034- 発行日
- ページ情報
- 英文 143 Pages
- 納期
- 2~3営業日
- 商品コード
- 1797882
- カスタマイズ可能 お客様のご希望に応じて、既存データの加工や未掲載情報(例:国別セグメント)の追加などの対応が可能です。詳細はお問い合わせください。
- 翻訳ツール提供対象 PDF対応AI翻訳ツールの無料貸し出しサービスのご利用が可能です
概要
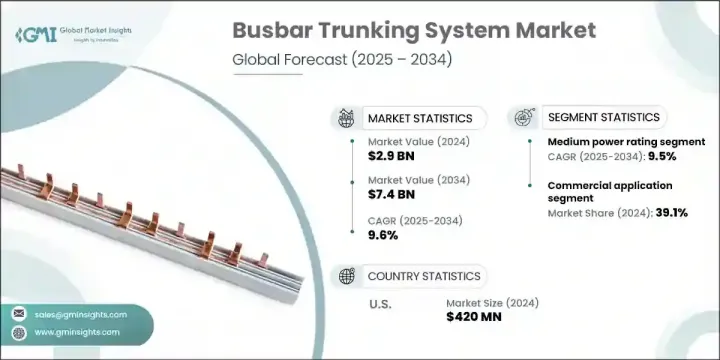
バスバートランキングシステムの世界市場規模は、2024年に29億米ドルとなり、CAGR 9.6%で成長し、2034年には74億米ドルに達すると予測されています。
産業や商業施設では、スペースを最適化し、エネルギー損失を最小限に抑える方法を模索しているため、効率的な配電ソリューションに対する需要が急速に高まっています。バスバートランキングシステムは、モジュラー設計、設置の容易さ、拡張性により、従来のケーブル配線よりも大きな利点を提供し、最新のインフラプロジェクトに理想的なソリューションとなっています。リアルタイムの監視、自動化、エネルギーの最適化を重視するスマートシティやインテリジェントビルの台頭は、こうした配電システムの必要性をさらに高めています。
さらに、持続可能性の動向の高まりと素材の革新が、配電の将来を形成しています。メーカーは、リサイクル・ナイロン・ベースの部品であるTECHNYL 4EARTHのような材料の導入により、世界の環境基準を満たすため、より環境に優しい材料や生産プロセスへとシフトしています。持続可能性が重視されるようになるにつれ、環境に優しいソリューションを採用する企業は競争上の優位性を獲得し、投資を呼び込み、バスバートランキングシステムの市場需要を押し上げています。
| 市場範囲 | |
|---|---|
| 開始年 | 2024 |
| 予測年 | 2025-2034 |
| 開始金額 | 29億米ドル |
| 予測金額 | 74億米ドル |
| CAGR | 9.6% |
中電力定格バスバートランキングシステム分野は、2024年に29%のシェアを占め、2034年までCAGR 9.5%で成長すると予想されます。一般的に800Aから2500Aの定格を持つこれらのシステムは、安全で効率的な配電を保証するため、産業やインフラ分野で需要が高まっています。サンドイッチ絶縁やリアルタイム監視機能などの高度な機能を備えたバスバートランキングシステムは、デジタルインフラが世界的に成長するにつれて普及しつつあります。
産業用アプリケーション分野は、2034年までCAGR 9.5%で成長すると予測されています。この急成長の主な要因は、製造工場、自動車工場、物流ハブなどの重要な産業環境において、信頼性が高く大容量の配電システムに対する需要が増加していることです。これらの施設は、特に重機械、複雑な自動化システム、高エネルギー要件を扱う場合、円滑な操業を維持するために無停電電源に大きく依存しています。産業が拡大し進化し続ける中、より効率的で拡張性の高い電源ソリューションが急務となっています。
米国バスバートランキングシステム市場は71%のシェアを占め、2024年には4億2,000万米ドルを生み出します。米国市場の着実な成長の原動力は、老朽化した電気インフラの近代化とスマートビルディング技術の採用拡大です。同地域では、エネルギー効率、火災安全性、モジュール建築が重視されており、従来のケーブル配線システムからより高度なバスバートランキングソリューションへの移行が加速しています。
バスバートランキングシステム市場の主要企業は、シュナイダーエレクトリック、シーメンス、ABB、イートンコーポレーション、ルグランなどです。バスバートランキングシステム業界の各社は、市場での地位を強化するため、特にエネルギー効率、拡張性、スマートインフラとの統合といった点で、製品の技術革新を進めることに注力しています。また、規制の圧力と消費者の要求の両方に対応するため、多くの企業が環境に優しい素材やプロセスへとシフトしており、持続可能性を優先しています。戦略的パートナーシップ、合併、買収は、特にスマートで持続可能なソリューションへの需要が増加し続ける中、市場範囲と能力を拡大するために用いられる主要な戦術です。さらに、各社はバスバーシステムの性能を強化し、全体的な顧客体験を向上させるための研究開発に投資しており、その製品が進化する業界のニーズに合致するようにしています。
目次
第1章 調査手法と範囲
第2章 エグゼクティブサマリー
第3章 業界考察
- エコシステム分析
- テクノロジートレンド
- スマートグリッドの統合とデジタル化
- 再生可能エネルギーの統合
- 規制情勢
- 業界への影響要因
- 成長可能性分析
- ポーター分析
- PESTEL分析
- 新たな機会と動向
- デジタル化とIoTの統合
- 新興市場への浸透
第4章 競合情勢
- イントロダクション
- 企業の市場シェア分析:地域別
- 北米
- 欧州
- アジア太平洋地域
- 中東・アフリカ
- ラテンアメリカ
- 戦略的取り組み
- 競合ベンチマーキング
- 戦略的ダッシュボード
- イノベーションとテクノロジーの情勢
第5章 市場規模・予測:断熱材別、2021年~2034年
- 主要動向
- サンドイッチ
- 空気断熱
第6章 市場規模・予測:出力別、2021年~2034年
- 主要動向
- ライティング
- 低
- 中
- 高
第7章 市場規模・予測:コンダクター別、2021年~2034年
- 主要動向
- 銅
- アルミニウム
第8章 市場規模・予測:用途別、2021年~2034年
- 主要動向
- 産業
- 電力
- 石油・ガス
- プロセス
- 輸送機関
- 製造業
- 商業用
- ユーティリティ
第9章 市場規模・予測:地域別、2021年~2034年
- 主要動向
- 北米
- 米国
- カナダ
- メキシコ
- 欧州
- 英国
- ドイツ
- イタリア
- スペイン
- フランス
- スウェーデン
- アジア太平洋地域
- 中国
- インド
- 日本
- オーストラリア
- 韓国
- インドネシア
- 中東・アフリカ
- サウジアラビア
- アラブ首長国連邦
- 南アフリカ
- ラテンアメリカ
- ブラジル
- アルゼンチン
- チリ
第10章 企業プロファイル
- ABB
- Anord Mardix
- Bticino
- C&S Electric Limited
- DBTS Industries Sdn Bhd
- EAE
- Eaton
- Effibar
- Entraco Bks Busducts Pvt. Ltd.
- Gersan Elektrik A.S
- Godrej
- Lauritz Knudsen Electrical &Automation
- Legrand
- MEGABARRE EUROPE SRL
- Naxso S.r.l.
- NOVA Electrical Co.
- Power Plug Busduct Sdn. Bhd.
- Schneider Electric
- Siemens
- Terasaki Electric Co., Ltd.
目次
The Global Busbar Trunking System Market was valued at USD 2.9 billion in 2024 and is estimated to grow at a CAGR of 9.6% to reach USD 7.4 billion by 2034. The demand for efficient power distribution solutions is rapidly increasing, as industries and commercial facilities seek ways to optimize space and minimize energy losses. Busbar trunking systems offer a significant advantage over traditional cabling, with their modular design, ease of installation, and scalability making them an ideal solution for modern infrastructure projects. The rise of smart cities and intelligent buildings, which emphasize real-time monitoring, automation, and energy optimization, is further driving the need for these electrical distribution systems.
Furthermore, growing sustainability trends and innovations in materials are shaping the future of electrical distribution. Manufacturers are shifting towards more eco-friendly materials and production processes to meet global environmental standards, with the introduction of materials like TECHNYL 4EARTH, a recycled nylon-based component. As sustainability becomes a greater focus, companies adopting greener solutions are gaining competitive advantage, attracting investment, and boosting market demand for busbar trunking systems.
| Market Scope | |
|---|---|
| Start Year | 2024 |
| Forecast Year | 2025-2034 |
| Start Value | $2.9 Billion |
| Forecast Value | $7.4 Billion |
| CAGR | 9.6% |
The medium power rating busbar trunking systems segment held a 29% share in 2024 and is expected to grow at a CAGR of 9.5% through 2034. These systems, typically rated between 800A and 2500A, are increasingly sought after in industrial and infrastructure sectors, as they ensure safe and efficient power distribution. Busbar trunking systems with advanced features, such as sandwich insulation and real-time monitoring capabilities, are becoming more prevalent as digital infrastructure grows globally.
The industrial application segment is projected to grow at a CAGR of 9.5% through 2034. This surge is primarily driven by the increasing demand for reliable, high-capacity power distribution systems in critical industrial environments like manufacturing plants, automotive factories, and logistics hubs. These facilities rely heavily on uninterrupted power to maintain smooth operations, especially when dealing with heavy machinery, complex automation systems, and high-energy requirements. As industries continue to expand and evolve, there is a pressing need for more efficient and scalable power solutions, which busbar trunking systems are uniquely positioned to offer.
U.S. Busbar Trunking System Market held 71% share, generating USD 420 million in 2024. The steady growth of the market in the U.S. is driven by the modernization of aging electrical infrastructure and the increased adoption of smart building technologies. The region's emphasis on energy efficiency, fire safety, and modular construction is accelerating the shift from traditional cabling systems to more advanced busbar trunking solutions.
The top players in the Busbar Trunking System Market include Schneider Electric, Siemens, ABB, Eaton Corporation, and Legrand. To strengthen their market position, companies in the busbar trunking system industry focus on advancing product innovation, particularly in terms of energy efficiency, scalability, and integration with smart infrastructure. They also prioritize sustainability, with many shifting toward eco-friendly materials and processes in response to both regulatory pressures and consumer demand. Strategic partnerships, mergers, and acquisitions are key tactics used to expand market reach and capabilities, especially as demand for smart and sustainable solutions continues to rise. Additionally, companies are investing in research and development to enhance the performance of busbar systems and improve the overall customer experience, ensuring that their products align with evolving industry needs.
Table of Contents
Chapter 1 Methodology & Scope
- 1.1 Market scope & definitions
- 1.2 Market estimates & forecast parameters
- 1.3 Forecast calculation
- 1.4 Data sources
- 1.4.1 Primary
- 1.4.2 Secondary
- 1.4.2.1 Paid
- 1.4.2.2 Public
Chapter 2 Executive Summary
- 2.1 Industry synopsis, 2021 - 2034
- 2.1.1 Business trends
- 2.1.2 Insulation trends
- 2.1.3 Power rating trends
- 2.1.4 Conductor trends
- 2.1.5 Application trends
- 2.1.6 Regional trends
Chapter 3 Industry Insights
- 3.1 Industry ecosystem analysis
- 3.2 Technology trend
- 3.2.1 Smart grid integration and digitalization
- 3.2.2 Renewable energy integration
- 3.3 Regulatory landscape
- 3.4 Industry impact forces
- 3.5 Growth potential analysis
- 3.6 Porter's analysis
- 3.6.1 Bargaining power of suppliers
- 3.6.2 Bargaining power of buyers
- 3.6.3 Threat of new entrants
- 3.6.4 Threat of substitutes
- 3.7 PESTEL analysis
- 3.7.1 Political factors
- 3.7.2 Economic factors
- 3.7.3 Social factors
- 3.7.4 Technological factors
- 3.7.5 Environmental factors
- 3.7.6 Legal factors
- 3.8 Emerging opportunities & trends
- 3.8.1 Digitalization & IoT integration
- 3.8.2 Emerging market penetration
Chapter 4 Competitive landscape, 2025
- 4.1 Introduction
- 4.2 Company market share analysis, by region, 2024
- 4.2.1 North America
- 4.2.2 Europe
- 4.2.3 Asia Pacific
- 4.2.4 Middle East & Africa
- 4.2.5 Latin America
- 4.3 Strategic initiative
- 4.4 Competitive benchmarking
- 4.5 Strategic dashboard
- 4.6 Innovation & technology landscape
Chapter 5 Market Size and Forecast, By Insulation, 2021 - 2034 (USD Billion)
- 5.1 Key trends
- 5.2 Sandwich
- 5.3 Air insulated
Chapter 6 Market Size and Forecast, By Power Rating, 2021 - 2034 (USD Billion)
- 6.1 Key trends
- 6.2 Lighting
- 6.3 Low
- 6.4 Medium
- 6.5 High
Chapter 7 Market Size and Forecast, By Conductor, 2021 - 2034 (USD Billion)
- 7.1 Key trends
- 7.2 Copper
- 7.3 Aluminum
Chapter 8 Market Size and Forecast, By Application, 2021 - 2034 (USD Billion)
- 8.1 Key trends
- 8.2 Industrial
- 8.2.1 Power
- 8.2.2 Oil & gas
- 8.2.3 Process
- 8.2.4 Transportation
- 8.2.5 Manufacturing
- 8.3 Commercial
- 8.4 Utility
Chapter 9 Market Size and Forecast, By Region, 2021 - 2034 (USD Billion)
- 9.1 Key trends
- 9.2 North America
- 9.2.1 U.S.
- 9.2.2 Canada
- 9.2.3 Mexico
- 9.3 Europe
- 9.3.1 UK
- 9.3.2 Germany
- 9.3.3 Italy
- 9.3.4 Spain
- 9.3.5 France
- 9.3.6 Sweden
- 9.4 Asia Pacific
- 9.4.1 China
- 9.4.2 India
- 9.4.3 Japan
- 9.4.4 Australia
- 9.4.5 South Korea
- 9.4.6 Indonesia
- 9.5 Middle East & Africa
- 9.5.1 Saudi Arabia
- 9.5.2 UAE
- 9.5.3 South Africa
- 9.6 Latin America
- 9.6.1 Brazil
- 9.6.2 Argentina
- 9.6.3 Chile
Chapter 10 Company Profiles
- 10.1 ABB
- 10.2 Anord Mardix
- 10.3 Bticino
- 10.4 C&S Electric Limited
- 10.5 DBTS Industries Sdn Bhd
- 10.6 EAE
- 10.7 Eaton
- 10.8 Effibar
- 10.9 Entraco Bks Busducts Pvt. Ltd.
- 10.10 Gersan Elektrik A.S
- 10.11 Godrej
- 10.12 Lauritz Knudsen Electrical & Automation
- 10.13 Legrand
- 10.14 MEGABARRE EUROPE SRL
- 10.15 Naxso S.r.l.
- 10.16 NOVA Electrical Co.
- 10.17 Power Plug Busduct Sdn. Bhd.
- 10.18 Schneider Electric
- 10.19 Siemens
- 10.20 Terasaki Electric Co., Ltd.
- 発行日
- 発行
- Global Market Insights Inc.
- ページ情報
- 英文 143 Pages
- 納期
- 2~3営業日


