
電子機器修理サービス市場:市場機会、成長促進要因、産業動向分析、将来予測(2025~2034年)
Electronic Equipment Repair Services Market Opportunity, Growth Drivers, Industry Trend Analysis, and Forecast 2025 - 2034- 発行日
- ページ情報
- 英文 180 Pages
- 納期
- 2~3営業日
- 商品コード
- 1797770
- カスタマイズ可能 お客様のご希望に応じて、既存データの加工や未掲載情報(例:国別セグメント)の追加などの対応が可能です。詳細はお問い合わせください。
- 翻訳ツール提供対象 PDF対応AI翻訳ツールの無料貸し出しサービスのご利用が可能です
概要
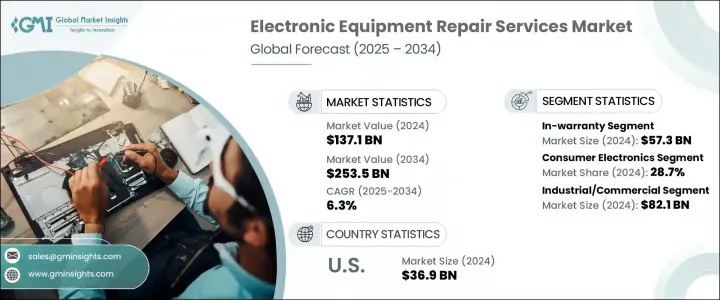
世界の電子機器修理サービスの市場規模は、2024年に1,371億米ドルとなり、CAGR 6.3%で成長し、2034年には2,535億米ドルに達すると予測されています。
この市場成長の原動力は、持続可能性と電子廃棄物をめぐる懸念、新しい電子機器のコスト上昇、産業用および医療用機器の使用の増加です。電子機器廃棄物は、その中に含まれる有害物質やリサイクルシステムの非効率性により、環境への関心が高まっており、修理サービスは重要なソリューションとなっています。さらに、機器の買い替えコストが上昇を続ける中、消費者も企業も、新製品購入に代わる費用対効果の高い選択肢として修理サービスを求めています。スマートフォン、ノートパソコン、産業用電子機器などのハイエンド・デバイスには高額な値札が付いていることが多く、修理はこれらの製品の寿命を延ばすための、より現実的で経済的な選択肢となっています。
民生用電子機器の普及が進み、産業用機器や医療用機器の使用が拡大するのに伴い、修理サービスの需要も伸びています。消費者はまた、環境の持続可能性を重視するようになり、交換ではなく修理が好まれる一因となっています。このような情勢の変化の中で、企業は顧客基盤を維持し、持続可能性の目標を達成するために、信頼性が高く、手頃な価格で効率的な修理サービスを提供することで、顧客ニーズに適応しています。
| 市場範囲 | |
|---|---|
| 開始年 | 2024年 |
| 予測期間 | 2025~2034年 |
| 当初の市場規模 | 1,371億米ドル |
| 市場規模予測 | 2,535億米ドル |
| CAGR | 6.3% |
サービスの種類別に見ると、市場は保証期間内サービスと保証期間外サービスに分けられます。2024年の市場規模が573億米ドルであった保証期間内サービス分野は、メーカーが保証する修理によって需要が予測でき、消費者の自己負担額が少ないというメリットがあります。メーカーは通常、素材や製造上の欠陥をカバーするために12~24カ月の保証を提供しており、これがこのセグメントにおける相手先ブランド製造業者(OEM)の優位性を支えています。保証期間内サービスに対する需要の高まりに対応するため、修理プロバイダーは、承認されたサービス契約を取得し、技術主導の診断を活用して修理時間を最短化し、サービス提供を改善することに注力しなければなりません。
民生用電子機器分野は2024年に28.7%のシェアを占めました。スマートフォン、ノートパソコン、その他の個人用機器の急速な普及が、修理サービスの需要を促進しています。消費者が費用対効果の高い選択肢を重視するようになるにつれ、特に急速に進化する電子機器市場の性質を考えると、修理サービスは機器交換に代わる選択肢として人気が高まっています。
米国の電子機器修理サービス市場の2024年の市場規模は369億米ドルで、強力な産業インフラと高い家電普及率の恩恵を受けています。消費者技術協会(Consumer Technology Association)によると、米国の消費者の45%以上が買い替えではなく修理を選ぶなど、米国の消費者行動は変化しています。消費者が機器の価格上昇に直面し、環境への意識が高まるにつれ、この動向は続くと予想されます。米国での市場シェア獲得を目指すサービスプロバイダーは、認定サービス・センター・ネットワークの拡大、診断能力の向上、環境に配慮した業務のサポートに注力する必要があります。
世界の電子機器修理サービス市場における主要企業には、Rockwell Automation Inc.、Koninklijke Philips N.V.、Curtiss-Wright Corporation、Encompass Supply Chain Solutions、Forth Corporation Public Company Limitedなどがあります。電子機器修理サービス市場での地位を強化するため、主要企業はサービスネットワークの拡大とサービス提供の強化に注力しています。主な戦略としては、OEMとのパートナーシップを深め、保証に基づく修理に不可欠な認定修理サービスや認定資格を確保することが挙げられます。さらに、修理プロセスを合理化し、ダウンタイムを最小化するため、先進的な診断ツールや技術に投資し、顧客への迅速な対応を実現しています。企業はまた、環境に優しい材料の使用や電子廃棄物の削減など、環境に優しい慣行を取り入れることで、持続可能性にも注力しています。もうひとつの重要な戦略は、顧客が修理サービスに簡単にアクセスできるデジタル・プラットフォームの開発で、利便性と顧客満足度をさらに高めています。最後に、サービス・プロバイダーは、特にパーソナライズされた修理ソリューションへの需要が高まる中、顧客の具体的なニーズに基づいてカスタマイズされたサービスを提供することで差別化を図ろうとしています。
目次
第1章 分析手法と範囲
第2章 エグゼクティブサマリー
第3章 業界考察
- エコシステム分析
- サプライヤーの情勢
- 利益率
- コスト構造
- 各段階での付加価値
- バリューチェーンに影響を与える要因
- ディスラプション
- 影響要因
- 促進要因
- 新しい電子機器の価格上昇
- 持続可能性と電子廃棄物に関する懸念
- 家電製品の拡大
- 産業機器および医療機器の使用の増加
- サードパーティ修理業者の成長
- 業界の潜在的リスクと課題
- 急速な技術陳腐化
- OEM部品・ツールへのアクセス制限
- 促進要因
- 成長可能性分析
- 規制情勢
- 北米
- 欧州
- アジア太平洋
- ラテンアメリカ
- 中東・アフリカ
- ポーター分析
- PESTEL分析
- テクノロジーとイノベーションの情勢
- 現在の技術動向
- 新興技術
- 新たなビジネスモデル
- コンプライアンス要件
- 消費者感情の分析
- 特許・知的財産の分析
- 地政学と貿易のダイナミクス
第4章 競合情勢
- イントロダクション
- 企業の市場シェア分析
- 地域別
- 市場集中分析
- 主要企業の競合ベンチマーキング
- 財務実績の比較
- 収益
- 利益率
- 研究開発
- 製品ポートフォリオの比較
- 製品ラインナップの広さ
- テクノロジー
- 革新
- 地理的プレゼンスの比較
- 世界フットプリント分析
- サービスネットワークの範囲
- 地域別の市場浸透率
- 競合ポジショニングマトリックス
- リーダー
- チャレンジャー
- フォロワー
- ニッチプレイヤー
- 戦略的展望マトリックス
- 財務実績の比較
- 主な動向(2021~2034年)
- 企業合併・買収 (M&A)
- 事業提携・協力
- 技術進歩
- 拡大と投資戦略
- デジタル変革イニシアチブ
- 新興企業/スタートアップ企業の競合情勢
第5章 市場推計・予測:サービスの種類別(2021~2034年)
- 主要動向
- 保証期間内
- 保証期間外
第6章 市場推計・予測:製品種類別(2021~2034年)
- 主要動向
- 民生用電子機器
- スマートフォン・携帯電話
- テレビ
- ノートパソコン
- タブレット
- その他
- 家電製品
- 冷蔵庫
- エアコン
- 電子レンジ
- 洗濯機
- その他
- 医療機器
- 医療モニター
- 実験器具
- 歯科機器
- 人工呼吸器
- CTスキャナー
- その他
- 産業機器
- モーター・発電機
- 電圧計
- プログラマブルロジックコントローラ(PLC)
- レーザー機器
- その他
- その他
第7章 市場推計・予測:販売チャネル別(2021~2034年)
- 主要動向
- 認定サービスセンター
- サードパーティ修理店
- その他
第8章 市場推計・予測:最終用途別(2021~2034年)
- 主要動向
- 産業用/商業用
- 家庭用
第9章 市場推計・予測:地域別(2021~2034年)
- 主要動向
- 北米
- 米国
- カナダ
- 欧州
- 英国
- ドイツ
- フランス
- イタリア
- スペイン
- オランダ
- アジア太平洋
- 中国
- インド
- 日本
- 韓国
- オーストラリア
- ラテンアメリカ
- ブラジル
- メキシコ
- アルゼンチン
- 中東・アフリカ
- 南アフリカ
- サウジアラビア
- アラブ首長国連邦
第10章 企業プロファイル
- 世界の主要企業
- Koninklijke Philips N.V.
- Rockwell Automation Inc.
- Curtiss-Wright Corporation
- Bose Corporation
- Quest International, Inc.
- 地域の主要企業
- 北米
- PSI Repair Services, Inc.
- Altra Service Professionals
- Encompass Supply Chain Solutions
- ASAP electronic repairs
- 欧州
- AML Instruments Limited
- Greasley Electronics LTD
- IER Industrial Electronic Repairs LTD
- Multicare Electronics Ltd.
- Real Electronics 2 Ltd.
- Repair World Direct
- Screamer Electronic Services
- JTD Electronics Ltd
- アジア太平洋地域
- Urtronics India
- INDufit MACHINEs
- 北米
- ディスラプター/ニッチ企業
- iCracked, Inc.
- Forth Electronics
目次
The Global Electronic Equipment Repair Services Market was valued at USD 137.1 billion in 2024 and is estimated to grow at a CAGR of 6.3% to reach USD 253.5 billion by 2034. This market growth is driven by concerns surrounding sustainability and e-waste, rising costs of new electronics, and the growing use of industrial and medical devices. With electronic waste becoming an increasing environmental concern due to the harmful substances it contains and the inefficiency of recycling systems, repair services have become a critical solution. Additionally, as the cost of replacing devices continues to rise, consumers and businesses alike are seeking repair services as a cost-effective alternative to purchasing new products. High-end devices like smartphones, laptops, and industrial electronics often come with a hefty price tag, making repairs a more viable and economical option for extending the life of these products.
The demand for repair services is growing in line with the increasing penetration of consumer electronics and the expanding use of industrial and medical devices. Consumers are also becoming more focused on environmental sustainability, contributing to the preference for repairs instead of replacements. In this changing landscape, businesses are adapting to customer needs by offering reliable, affordable, and efficient repair services to maintain their customer base and meet sustainability goals.
| Market Scope | |
|---|---|
| Start Year | 2024 |
| Forecast Year | 2025-2034 |
| Start Value | $137.1 Billion |
| Forecast Value | $253.5 Billion |
| CAGR | 6.3% |
In terms of service types, the market is divided into in-warranty and out-of-warranty services. The in-warranty segment, which was valued at USD 57.3 billion in 2024, benefits from manufacturer-backed repairs that offer predictable demand and lower out-of-pocket costs for consumers. Manufacturers typically offer warranties of 12 to 24 months to cover defects in materials and workmanship, which supports the dominance of original equipment manufacturers (OEMs) in this segment. To tap into the growing demand for in-warranty services, repair providers must focus on obtaining approved service agreements and leveraging technology-driven diagnostics to minimize repair times and improve service delivery.
The consumer electronics segment accounted for a 28.7% share in 2024. The rapid growth in the use of smartphones, laptops, and other personal devices is driving the demand for repair services. As consumers become more focused on cost-effective options, repair services are becoming an increasingly popular alternative to device replacement, especially given the rapidly evolving nature of the electronics market.
U.S. Electronic Equipment Repair Services Market generated USD 36.9 billion in 2024, benefiting from a strong industrial infrastructure and high consumer electronics penetration. Consumer behavior in the U.S. is shifting, with more than 45% of U.S. consumers opting for repairs rather than replacements, according to the Consumer Technology Association. This trend is expected to continue as consumers face rising device prices and become more environmentally conscious. Service providers aiming to capture market share in the U.S. need to focus on expanding their authorized service center networks, improving diagnostic capabilities, and supporting environmentally friendly practices.
The top players in the Global Electronic Equipment Repair Services Market include companies like Rockwell Automation Inc., Koninklijke Philips N.V., Curtiss-Wright Corporation, Encompass Supply Chain Solutions, and Forth Corporation Public Company Limited. To strengthen their position in the electronic equipment repair services market, leading companies are focusing on expanding their service networks and enhancing their service offerings. A key strategy involves deepening partnerships with OEMs to ensure authorized repair services and certifications, which are essential for warranty-backed repairs. Additionally, businesses are investing in advanced diagnostic tools and technologies to streamline repair processes and minimize downtime, ensuring a faster turnaround for customers. Companies are also focusing on sustainability by incorporating environmentally friendly practices such as using eco-friendly materials and reducing e-waste. Another important strategy is the development of digital platforms that enable easy customer access to repair services, further enhancing convenience and customer satisfaction. Lastly, service providers are looking to differentiate themselves by offering customized services, based on the specific needs of the customers, especially as the demand for personalized repair solutions increases.
Table of Contents
Chapter 1 Methodology & Scope
- 1.1 Market scope and definition
- 1.2 Research design
- 1.2.1 Research approach
- 1.2.2 Data collection methods
- 1.3 Data mining sources
- 1.3.1 Global
- 1.3.2 Regional/Country
- 1.4 Base estimates and calculations
- 1.4.1 Base year calculation
- 1.4.2 Key trends for market estimation
- 1.5 Primary research and validation
- 1.5.1 Primary sources
- 1.6 Forecast model
- 1.7 Research assumptions and limitations
Chapter 2 Executive Summary
- 2.1 Industry 360° synopsis
- 2.2 Key market trends
- 2.2.1 Product type trends
- 2.2.2 Service type trends
- 2.2.3 Product type trends
- 2.2.4 Sales channel trends
- 2.2.5 End use trends
- 2.2.6 Regional trends
- 2.3 TAM Analysis, 2025-2034 (USD Billion)
- 2.4 CXO perspectives: Strategic imperatives
- 2.4.1 Executive decision points
- 2.4.2 Critical success factors
- 2.5 Future Outlook and strategic recommendations
Chapter 3 Industry Insights
- 3.1 Industry ecosystem analysis
- 3.1.1 Supplier landscape
- 3.1.2 Profit margin
- 3.1.3 Cost structure
- 3.1.4 Value addition at each stage
- 3.1.5 Factor affecting the value chain
- 3.1.6 Disruptions
- 3.2 Impact forces
- 3.2.1 Growth drivers
- 3.2.1.1 Rising cost of new electronics
- 3.2.1.2 Sustainability and e-waste concerns
- 3.2.1.3 Expansion of consumer electronics
- 3.2.1.4 Increasing industrial and medical device usage
- 3.2.1.5 Growth of third-party repair providers
- 3.2.2 Industry pitfalls & challenges
- 3.2.2.1 Rapid technological obsolescence
- 3.2.2.2 Limited access to OEM parts and tools
- 3.2.1 Growth drivers
- 3.3 Growth potential analysis
- 3.4 Regulatory landscape
- 3.4.1 North America
- 3.4.2 Europe
- 3.4.3 Asia Pacific
- 3.4.4 Latin America
- 3.4.5 Middle East & Africa
- 3.5 Porter's analysis
- 3.6 PESTEL analysis
- 3.7 Technology and innovation landscape
- 3.7.1 Current technological trends
- 3.7.2 Emerging technologies
- 3.8 Emerging business models
- 3.9 Compliance requirements
- 3.10 Consumer sentiment analysis
- 3.11 Patent and IP analysis
- 3.12 Geopolitical and trade dynamics
Chapter 4 Competitive Landscape, 2024
- 4.1 Introduction
- 4.2 Company market share analysis
- 4.2.1 By region
- 4.2.1.1 North America
- 4.2.1.2 Europe
- 4.2.1.3 Asia Pacific
- 4.2.1.4 Latin America
- 4.2.1.5 MEA
- 4.2.2 Market concentration analysis
- 4.2.1 By region
- 4.3 Competitive benchmarking of key players
- 4.3.1 Financial performance comparison
- 4.3.1.1 Revenue
- 4.3.1.2 Profit margin
- 4.3.1.3 R&D
- 4.3.2 Product portfolio comparison
- 4.3.2.1 Product range breadth
- 4.3.2.2 Technology
- 4.3.2.3 Innovation
- 4.3.3 Geographic presence comparison
- 4.3.3.1 Global footprint analysis
- 4.3.3.2 Service network coverage
- 4.3.3.3 Market penetration by region
- 4.3.4 Competitive positioning matrix
- 4.3.4.1 Leaders
- 4.3.4.2 Challengers
- 4.3.4.3 Followers
- 4.3.4.4 Niche players
- 4.3.5 Strategic outlook matrix
- 4.3.1 Financial performance comparison
- 4.4 Key developments, 2021-2024
- 4.4.1 Mergers and acquisitions
- 4.4.2 Partnerships and collaborations
- 4.4.3 Technological advancements
- 4.4.4 Expansion and investment strategies
- 4.4.5 Digital Transformation Initiatives
- 4.5 Emerging/ Startup Competitors Landscape
Chapter 5 Market Estimates & Forecast, By Service Type, 2021-2034 (USD Million)
- 5.1 Key trends
- 5.2 In-warranty
- 5.3 Out-of-warranty
Chapter 6 Market Estimates & Forecast, By Product Type, 2021-2034 (USD Million)
- 6.1 Key trends
- 6.2 Consumer electronics
- 6.2.1 Smartphones & mobile phones
- 6.2.2 Televisions
- 6.2.3 Notebooks & laptops
- 6.2.4 Tablets
- 6.2.5 Others
- 6.3 Home Appliances
- 6.3.1 Refrigerators
- 6.3.2 Air conditioners
- 6.3.3 Microwaves
- 6.3.4 Washing machines
- 6.3.5 Others
- 6.4 Medical equipment
- 6.4.1 Medical monitors
- 6.4.2 Lab equipment
- 6.4.3 Dental clinic equipment
- 6.4.4 Ventilators
- 6.4.5 CT scanners
- 6.4.6 Others
- 6.5 Industrial equipment
- 6.5.1 Motors & generators
- 6.5.2 Voltmeters
- 6.5.3 Programmable Logic Controllers (PLC)
- 6.5.4 Laser equipment
- 6.5.5 Others
- 6.6 Others
Chapter 7 Market Estimates & Forecast, By Sales Channel, 2021-2034 (USD Million)
- 7.1 Key trends
- 7.2 Authorized service centers
- 7.3 Third-party repair shops
- 7.4 Others
Chapter 8 Market Estimates & Forecast, By End Use, 2021-2034 (USD Million)
- 8.1 Key trends
- 8.2 Industrial/Commercial
- 8.3 Residential
Chapter 9 Market Estimates & Forecast, By Region, 2021-2034 (USD Million)
- 9.1 Key trends
- 9.2 North America
- 9.2.1 U.S.
- 9.2.2 Canada
- 9.3 Europe
- 9.3.1 UK
- 9.3.2 Germany
- 9.3.3 France
- 9.3.4 Italy
- 9.3.5 Spain
- 9.3.6 Netherlands
- 9.4 Asia Pacific
- 9.4.1 China
- 9.4.2 India
- 9.4.3 Japan
- 9.4.4 South Korea
- 9.4.5 Australia
- 9.5 Latin America
- 9.5.1 Brazil
- 9.5.2 Mexico
- 9.5.3 Argentina
- 9.6 MEA
- 9.6.1 South Africa
- 9.6.2 Saudi Arabia
- 9.6.3 UAE
Chapter 10 Company Profiles
- 10.1 Global Key Players
- 10.1.1 Koninklijke Philips N.V.
- 10.1.2 Rockwell Automation Inc.
- 10.1.3 Curtiss-Wright Corporation
- 10.1.4 Bose Corporation
- 10.1.5 Quest International, Inc.
- 10.2 Regional Key Players
- 10.2.1 North America
- 10.2.1.1 PSI Repair Services, Inc.
- 10.2.1.2 Altra Service Professionals
- 10.2.1.3 Encompass Supply Chain Solutions
- 10.2.1.4 ASAP electronic repairs
- 10.2.2 Europe
- 10.2.2.1 AML Instruments Limited
- 10.2.2.2 Greasley Electronics LTD
- 10.2.2.3 IER Industrial Electronic Repairs LTD
- 10.2.2.4 Multicare Electronics Ltd.
- 10.2.2.5 Real Electronics 2 Ltd.
- 10.2.2.6 Repair World Direct
- 10.2.2.7 Screamer Electronic Services
- 10.2.2.8 JTD Electronics Ltd
- 10.2.3 Asia Pacific
- 10.2.3.1 Urtronics India
- 10.2.3.2 INDufit MACHINEs
- 10.2.1 North America
- 10.3 Disruptors / Niche Players
- 10.3.1 iCracked, Inc.
- 10.3.2 Forth Electronics
- 発行日
- 発行
- Global Market Insights Inc.
- ページ情報
- 英文 180 Pages
- 納期
- 2~3営業日


