
炭酸化と窒素化システムの市場機会、成長促進要因、産業動向分析、2025年~2034年予測
Carbonation and Nitrogenation Systems Market Opportunity, Growth Drivers, Industry Trend Analysis, and Forecast 2025 - 2034- 発行日
- ページ情報
- 英文 170 Pages
- 納期
- 2~3営業日
- 商品コード
- 1782112
- カスタマイズ可能 お客様のご希望に応じて、既存データの加工や未掲載情報(例:国別セグメント)の追加などの対応が可能です。詳細はお問い合わせください。
- 翻訳ツール提供対象 PDF対応AI翻訳ツールの無料貸し出しサービスのご利用が可能です
概要
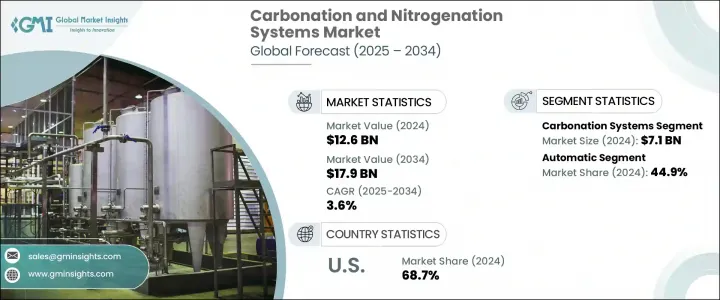
炭酸化と窒素化システムの世界市場は、2024年には126億米ドルとなり、CAGR 3.6%で成長し、2034年には179億米ドルに達すると推定されています。
この市場は、スパークリング、炭酸、窒素入り飲料の需要が加速し続けている飲食品製造エコシステムにおいて重要な役割を果たしています。消費者はユニークな感覚を提供する飲料にますます惹かれており、ガス注入システムはそのような品質を提供する中核となっています。これらのシステムは、日常的な清涼飲料から特殊なウェルネス飲料まで、幅広い飲料カテゴリーで使用されており、テクスチャー、味、保存安定性を向上させています。さらに、気液混合を必要とするプロセスをサポートするこれらのシステムは、医薬品製造やその他の産業用途においても、その有用性が拡大しています。
この市場の主な成長促進要因のひとつは、より健康的でプレミアムな飲料を求める消費者の傾向の変化であり、新興市場における都市化と可処分所得の増加という大きなトレンドでもあります。その結果、メーカーは迅速な技術革新と嗜好の変化への対応を迫られており、特に人口密度の高い地域では、すぐに飲める飲料や外出先での飲料の需要が急増しています。こうした期待に応えるために、テクノロジーは変革的な役割を果たしています。
| 市場範囲 | |
|---|---|
| 開始年 | 2024 |
| 予測年 | 2025-2034 |
| 開始金額 | 126億米ドル |
| 予測金額 | 179億米ドル |
| CAGR | 3.6% |
最新の炭酸化と窒素化装置は、もはや基本的な機能に限定されるものではないです。今日のシステムは自動化が進み、エネルギー効率の高い性能、運用コストの削減、高い拡張性を提供しています。デジタル制御システムとの統合が強化されたことで、生産者はガス注入レベルを微調整できるようになり、その結果、品質と一貫性が向上しています。飲料の技術革新が進化を続ける中、より滑らかな口当たりと鮮度の向上を実現したガス注入製剤が新たな製品の可能性を広げ、こうした先進システムの採用に拍車をかけています。
機器のタイプ別では、市場は炭酸化と窒素化システムに分けられます。炭酸化システム部門は、インライン炭酸化技術とバッチ式炭酸化技術を含み、2024年に最大のシェアを占め、71億米ドルの売上を計上しました。この分野は、炭酸飲料に対する世界の需要が続いているため、広く使用されています。スパークリングウォーターであれ、フレーバー付き健康飲料であれ、その他の炭酸飲料であれ、炭酸飲料の魅力は依然として強いです。これらのシステムは、液体に炭酸ガスを導入することで機能します。このプロセスは、ガスロスの削減、省エネルギーの強化、高速生産ラインへのシームレスな統合を可能にする技術改良により、ますます洗練されてきています。
注入、パージ、充填装置で構成される窒素化システムも、特にテクスチャーと製品の差別化が重要な製剤において支持を集めています。しかし、炭酸化システムは、その応用範囲の広さから、引き続きリードしています。
自動化レベル別に分類すると、市場は手動、半自動、自動システムに分類されます。2024年には、自動システムが世界市場シェアの44.9%、金額にして57億米ドルを占め、支配的なカテゴリーに浮上しました。これらのシステムは、複雑なガス注入作業を最小限の人的監視で行うように設計されています。プログラマブルロジックコントローラー、高度なセンサー、ユーザーフレンドリーなデジタルインターフェースを特徴とする自動ソリューションにより、投与量と圧力レベルを正確に制御することができます。これにより、製品の品質だけでなく、作業効率も向上し、手作業による調整の必要性が減り、人件費が削減されます。これらの特徴により、自動システムは、柔軟性とラインでの迅速な製品切り替えを求める新興の新興企業や既存の飲料メーカーにとって、特に魅力的なものとなっています。
これらのシステムの拡張性により、メーカーは、特に窒素入り飲料が人気を集めているプレミアム飲料セグメントにおいて、市場動向に迅速に対応することができます。さらに、持続可能性を求める動きから、装置メーカーは消費エネルギーが少なく、廃棄物の発生が少なく、環境に配慮した生産ワークフローに容易に統合できる装置を開発するようになりました。
地域別では、米国が2024年の北米市場の大部分を占め、地域別シェアの68.7%を占めています。この好調は、飲料加工インフラへの多額の投資と急速な技術導入に関連しています。米国の施設では自動化ソリューションが標準になりつつあり、効率性、製品の一貫性、適応性が消費者の期待に応えるために極めて重要です。さらに、ニッチな飲料セグメントの出現により、口当たりを良くしたり、炭酸や窒素のプロファイルをカスタマイズしたりできるシステムへの需要が高まり続けています。
炭酸化と窒素化システム分野の主要企業は、市場でのプレゼンスを拡大し、製品ラインナップを多様化するために、M&Aや戦略的提携を積極的に進めています。この業界は競争が激しく、大手メーカー、中堅メーカー、専門性の高い新興企業が、イノベーション、カスタマイズ、持続可能な製品開発を通じて市場シェアを争っています。世界企業がハイテク統合システムを市場に投入する一方で、多くの地域プロバイダーは、特定の生産ニーズに対応するコスト効率の高い、地域適合ソリューションに重点を置いています。
目次
第1章 調査手法と範囲
第2章 エグゼクティブサマリー
第3章 業界考察
- エコシステム分析
- サプライヤーの情勢
- 利益率
- 各段階での付加価値
- バリューチェーンに影響を与える要因
- 業界への影響要因
- 促進要因
- 炭酸飲料と窒素飲料の需要増加
- 産業および医薬品用途での採用増加
- 技術的進歩
- 業界の潜在的リスク&課題
- 高い資本コストと運用コスト
- 技術的な複雑さ
- 機会
- 促進要因
- 成長可能性分析
- 将来の市場動向
- テクノロジーとイノベーションの情勢
- 現在の技術動向
- 新興技術
- 価格動向
- 地域別
- タイプ別
- 規制情勢
- 標準とコンプライアンス要件
- 地域規制枠組み
- 認証基準
- ポーターの分析
- PESTEL分析
第4章 競合情勢
- イントロダクション
- 企業の市場シェア分析
- 地域別
- 企業マトリックス分析
- 主要市場企業の競合分析
- 競合ポジショニングマトリックス
- 主な発展
- 合併と買収
- パートナーシップとコラボレーション
- 新製品の発売
- 拡張計画
第5章 市場推計・予測:デバイスタイプ別、2021年~2034年
- 主要動向
- 炭酸化システム
- インライン炭酸化システム
- バッチ炭酸化システム
- 窒素化システム
- 輸液システム
- 充填システム
- パージシステム
- その他
第6章 市場推計・予測:自動化レベル別、2021年~2034年
- 主要動向
- 手動
- 半自動
- 自動
第7章 市場推計・予測:用途別、2021年~2034年
- 主要動向
- 食品
- 飲料
- 医薬品
- 化学薬品
- その他
第8章 市場推計・予測:流通チャネル別、2021年~2034年
- 主要動向
- 直接
- 間接
第9章 市場推計・予測:地域別、2021年~2034年
- 主要動向
- 北米
- 米国
- カナダ
- 欧州
- ドイツ
- 英国
- フランス
- スペイン
- イタリア
- アジア太平洋地域
- 中国
- 日本
- インド
- オーストラリア
- 韓国
- ラテンアメリカ
- ブラジル
- メキシコ
- アルゼンチン
- 中東・アフリカ
- 南アフリカ
- サウジアラビア
- アラブ首長国連邦
第10章 企業プロファイル
- APV
- Arol S.p.A.
- Feldmeier Equipment Inc.
- GEA Group
- KHS GmbH
- Krones AG
- Linde Engineering
- MBE Technology
- NDC Technologies
- Procomac
- Schaefer Technologies Inc.
- Sidel Group
- Tenco Equipment Inc.
- Tetra Pak
- Zhejiang Shenghui Machinery Co., Ltd.
目次
The Global Carbonation and Nitrogenation Systems Market was valued at USD 12.6 billion in 2024 and is estimated to grow at a CAGR of 3.6% to reach USD 17.9 billion by 2034. This market plays a crucial role in the food and beverage manufacturing ecosystem, where the demand for sparkling, carbonated, and nitrogen-infused beverages continues to accelerate. Consumers are increasingly drawn to drinks that offer unique sensory experiences, and gas infusion systems are at the core of delivering such quality. These systems are used across a broad spectrum of beverage categories-from everyday soft drinks to specialized wellness drinks-enhancing texture, taste, and shelf stability. Additionally, these systems are finding expanding utility across pharmaceutical manufacturing and other industrial applications, supporting processes that require gas-liquid mixing.
One of the key growth drivers behind this market is the shifting consumer inclination toward healthier and more premium beverage options, as well as the broader trend of urbanization and rising disposable incomes in emerging markets. As a result, manufacturers are under pressure to innovate rapidly and adapt to changing preferences, especially in densely populated regions where demand for ready-to-drink and on-the-go beverages is surging. Technology is playing a transformative role in meeting these expectations.
| Market Scope | |
|---|---|
| Start Year | 2024 |
| Forecast Year | 2025-2034 |
| Start Value | $12.6 Billion |
| Forecast Value | $17.9 Billion |
| CAGR | 3.6% |
Modern carbonation and nitrogenation equipment is no longer limited to basic functionality. Today's systems are increasingly automated, offering energy-efficient performance, reduced operational costs, and high scalability. Enhanced integration with digital control systems is further enabling producers to fine-tune gas infusion levels, resulting in better quality and consistency. As beverage innovation continues to evolve, gas-infused formulations with smoother mouthfeel and improved freshness are opening up new product possibilities, spurring the adoption of these advanced systems.
In terms of equipment type, the market is divided into carbonation and nitrogenation systems. The carbonation systems segment-which includes inline and batch carbonation technologies-held the largest share in 2024, generating USD 7.1 billion in revenue. This segment is seeing widespread use due to the continued global demand for carbonated beverages. Whether it's sparkling water, flavored health drinks, or other fizzy refreshments, the appeal of carbonated options remains strong. These systems function by introducing carbon dioxide into liquids, a process that has become increasingly refined with technological improvements that reduce gas loss, enhance energy conservation, and enable seamless integration into high-speed production lines.
Nitrogenation systems-comprising infusion, purging, and filling equipment-are also gaining traction, especially in formulations where texture and product differentiation are critical. However, carbonation systems continue to lead due to their broader application scope.
When segmented by automation level, the market is categorized into manual, semi-automatic, and automatic systems. In 2024, automatic systems emerged as the dominant category, accounting for 44.9% of the global market share with a value of USD 5.7 billion. These systems are engineered to perform complex gas infusion tasks with minimal human oversight. Featuring programmable logic controllers, advanced sensors, and user-friendly digital interfaces, automatic solutions allow precise control over dosing and pressure levels. This enhances not just product quality but also operational efficiency, reducing the need for manual adjustments and lowering labor costs. These features make automatic systems particularly attractive for both emerging startups and established beverage producers who seek flexibility and rapid product switching on their lines.
The scalability of these systems enables manufacturers to respond swiftly to market trends, especially in the premium beverage segment, where nitrogen-infused drinks are gaining popularity. Additionally, the drive for sustainability has prompted equipment makers to develop machines that consume less energy, produce less waste, and integrate easily into environmentally conscious production workflows.
Regionally, the United States accounted for a major portion of the North American market in 2024, contributing 68.7% of the regional share. This strong performance can be linked to significant investments in beverage processing infrastructure and rapid technological adoption. Automated solutions are becoming standard in U.S. facilities, where efficiency, product consistency, and adaptability are crucial to meeting consumer expectations. Furthermore, the emergence of niche beverage segments continues to fuel demand for systems capable of delivering enhanced mouthfeel and customized carbonation or nitrogenation profiles.
Leading companies in the carbonation and nitrogenation systems space are actively pursuing mergers, acquisitions, and strategic collaborations to expand their market presence and diversify product offerings. The industry is marked by intense competition, with major players, mid-sized manufacturers, and specialized startups all vying for market share through innovation, customization, and sustainable product development. While global firms bring high-tech integrated systems to the market, many regional providers focus on cost-effective, locally adapted solutions that meet specific production needs.
Table of Contents
Chapter 1 Methodology and Scope
- 1.1 Market scope and definition
- 1.2 Research design
- 1.2.1 Research approach
- 1.2.2 Data collection methods
- 1.3 Data mining sources
- 1.3.1 Global
- 1.3.2 Regional/Country
- 1.4 Base estimates and calculations
- 1.4.1 Base year calculation
- 1.4.2 Key trends for market estimation
- 1.5 Primary research and validation
- 1.5.1 Primary sources
- 1.6 Forecast model
- 1.7 Research assumptions and limitations
Chapter 2 Executive Summary
- 2.1 Industry 3600 synopsis
- 2.2 Key market trends
- 2.2.1 Regional
- 2.2.2 Equipment type
- 2.2.3 Automation level
- 2.2.4 Application
- 2.2.5 Distribution channel
- 2.3 CXO perspectives: Strategic imperatives
- 2.3.1 Key decision points for industry executives
- 2.3.2 Critical success factors for market players
- 2.4 Future outlook and strategic recommendations
Chapter 3 Industry Insights
- 3.1 Industry ecosystem analysis
- 3.1.1 Supplier landscape
- 3.1.2 Profit margin
- 3.1.3 Value addition at each stage
- 3.1.4 Factor affecting the value chain
- 3.2 Industry impact forces
- 3.2.1 Growth drivers
- 3.2.1.1 Growing demand for carbonated and nitrogenated beverages
- 3.2.1.2 Rising adoption in industrial and pharmaceutical applications
- 3.2.1.3 Technological advancements
- 3.2.2 Industry pitfalls & challenges
- 3.2.2.1 High capital and operating costs
- 3.2.2.2 Technological complexity
- 3.2.3 Opportunities
- 3.2.1 Growth drivers
- 3.3 Growth potential analysis
- 3.4 Future market trends
- 3.5 Technology and innovation landscape
- 3.5.1 Current technological trends
- 3.5.2 Emerging technologies
- 3.6 Price trends
- 3.6.1 By region
- 3.6.2 By type
- 3.7 Regulatory landscape
- 3.7.1 Standards and compliance requirements
- 3.7.2 Regional regulatory frameworks
- 3.7.3 Certification standards
- 3.8 Porter’s analysis
- 3.9 PESTEL analysis
Chapter 4 Competitive Landscape, 2024
- 4.1 Introduction
- 4.2 Company market share analysis
- 4.2.1 By region
- 4.2.1.1 North America
- 4.2.1.2 Europe
- 4.2.1.3 Asia Pacific
- 4.2.1.4 Latin America
- 4.2.1.5 MEA
- 4.2.1 By region
- 4.3 Company matrix analysis
- 4.4 Competitive analysis of major market players
- 4.5 Competitive positioning matrix
- 4.6 Key developments
- 4.6.1 Mergers & acquisitions
- 4.6.2 Partnerships & collaborations
- 4.6.3 New product launches
- 4.6.4 Expansion plans
Chapter 5 Market Estimates and Forecast, By Equipment Type, 2021 - 2034 (USD Billion) (Thousand Units)
- 5.1 Key trends
- 5.2 Carbonation systems
- 5.2.1 Inline carbonation systems
- 5.2.2 Batch carbonation systems
- 5.3 Nitrogenation systems
- 5.3.1 Infusion systems
- 5.3.2 Filling systems
- 5.3.3 Purging systems
- 5.3.4 Others
Chapter 6 Market Estimates and Forecast, By Automation Level, 2021 - 2034 (USD Billion) (Thousand Units)
- 6.1 Key trends
- 6.2 Manual
- 6.3 Semi-automatic
- 6.4 Automatic
Chapter 7 Market Estimates and Forecast, By Application, 2021 - 2034 (USD Billion) (Thousand Units)
- 7.1 Key trends
- 7.2 Food
- 7.3 Beverages
- 7.4 Pharmaceuticals
- 7.5 Chemicals
- 7.6 Others
Chapter 8 Market Estimates and Forecast, By Distribution Channel, 2021 - 2034 (USD Billion) (Thousand Units)
- 8.1 Key trends
- 8.2 Direct
- 8.3 Indirect
Chapter 9 Market Estimates and Forecast, By Region, 2021 - 2034 (USD Billion) (Thousand Units)
- 9.1 Key trends
- 9.2 North America
- 9.2.1 U.S.
- 9.2.2 Canada
- 9.3 Europe
- 9.3.1 Germany
- 9.3.2 UK
- 9.3.3 France
- 9.3.4 Spain
- 9.3.5 Italy
- 9.4 Asia Pacific
- 9.4.1 China
- 9.4.2 Japan
- 9.4.3 India
- 9.4.4 Australia
- 9.4.5 South Korea
- 9.5 Latin America
- 9.5.1 Brazil
- 9.5.2 Mexico
- 9.5.3 Argentina
- 9.6 Middle East and Africa
- 9.6.1 South Africa
- 9.6.2 Saudi Arabia
- 9.6.3 UAE
Chapter 10 Company Profiles
- 10.1 APV
- 10.2 Arol S.p.A.
- 10.3 Feldmeier Equipment Inc.
- 10.4 GEA Group
- 10.5 KHS GmbH
- 10.6 Krones AG
- 10.7 Linde Engineering
- 10.8 MBE Technology
- 10.9 NDC Technologies
- 10.10 Procomac
- 10.11 Schaefer Technologies Inc.
- 10.12 Sidel Group
- 10.13 Tenco Equipment Inc.
- 10.14 Tetra Pak
- 10.15 Zhejiang Shenghui Machinery Co., Ltd.
- 発行日
- 発行
- Global Market Insights Inc.
- ページ情報
- 英文 170 Pages
- 納期
- 2~3営業日
