
イメージインテンシファイア市場の機会、成長促進要因、産業動向分析、2025年~2034年の予測
Image Intensifier Market Opportunity, Growth Drivers, Industry Trend Analysis, and Forecast 2025 - 2034- 発行日
- ページ情報
- 英文 185 Pages
- 納期
- 2~3営業日
- 商品コード
- 1773418
- カスタマイズ可能 お客様のご希望に応じて、既存データの加工や未掲載情報(例:国別セグメント)の追加などの対応が可能です。詳細はお問い合わせください。
- 翻訳ツール提供対象 PDF対応AI翻訳ツールの無料貸し出しサービスのご利用が可能です
概要
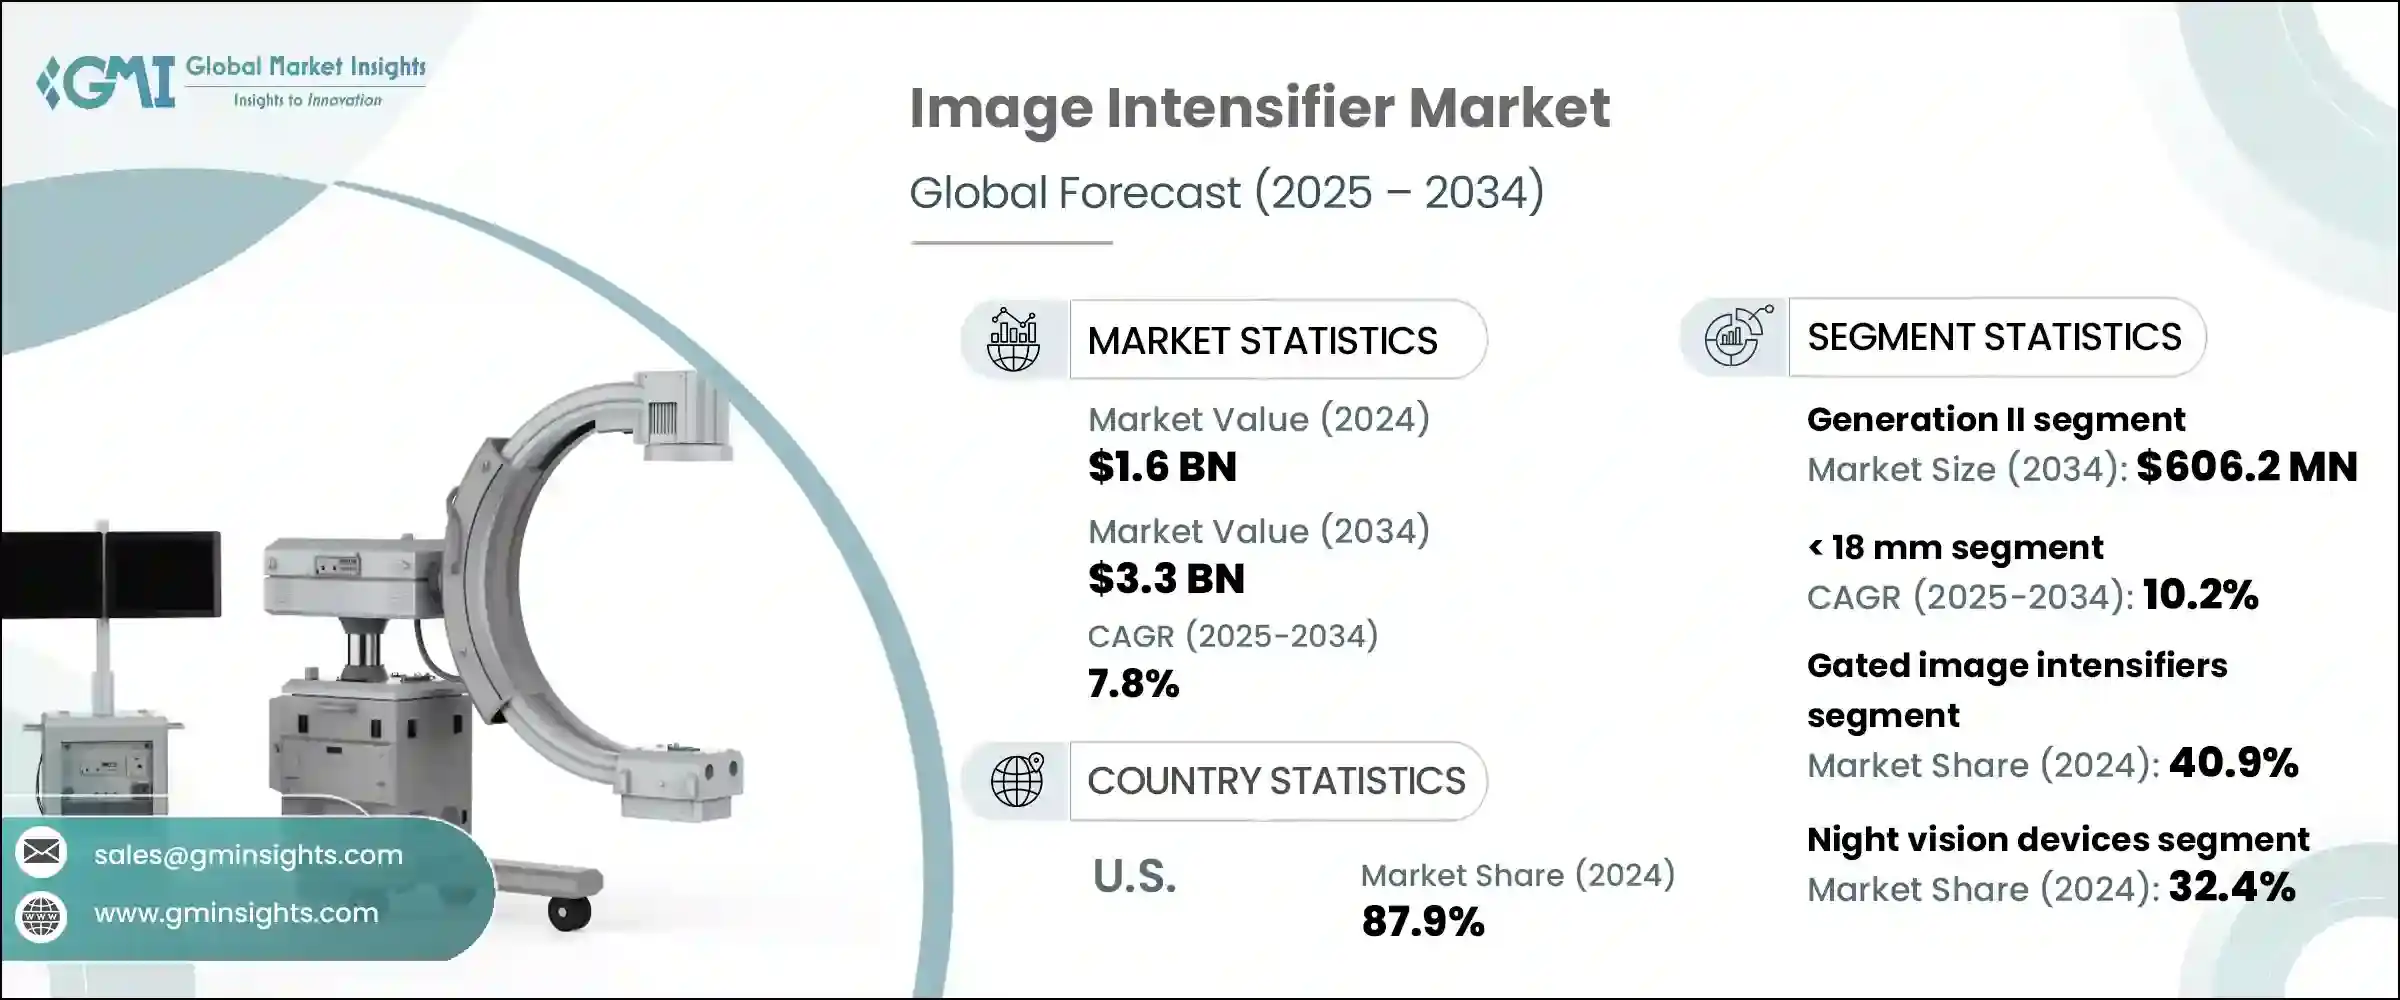
イメージインテンシファイアの世界市場規模は、2024年に16億米ドルとなり、CAGR 7.8%で成長し、2034年には33億米ドルに達すると予測されています。
この分野の成長は、主に医療イメージングと防衛関連アプリケーションの両方で採用が拡大していることが背景にあります。イメージインテンシファイアは強力なリアルタイムイメージング機能、優れた感度、コスト効率を提供するため、透視装置、インターベンショナルラジオロジーツール、Cアームなどの医療システムが引き続き需要を牽引しています。ヘルスケアプロバイダーが高品質な画像処理と手頃な価格を優先しているため、需要は一貫して高いままです。一方、主要地域の軍事・治安部隊は、監視、偵察、目標捕捉作業における低照度での運用信頼性から、イメージインテンシファイアに大きな信頼を寄せています。
これらのデバイスは、低照度下での確実な視認性が不可欠な国境監視や夜間作戦において、引き続き重要な役割を果たしています。地政学的な緊張が高まり、各国が防衛能力の近代化を優先させる中、最先端技術による戦術インフラの強化が急務となっています。イメージインテンシファイアは、24時間体制で脅威の検知、偵察、状況認識の維持を可能にし、作戦の即応性と安全性を確保します。厳しい環境下で鮮明なリアルタイム画像を提供できるため、国境や重要な資産を保護し、進化する紛争シナリオで戦略的優位性を維持することを目指す軍や安全保障機関にとって不可欠なものとなっています。
| 市場範囲 | |
|---|---|
| 開始年 | 2024 |
| 予測年 | 2025-2034 |
| 開始金額 | 16億米ドル |
| 予測金額 | 33億米ドル |
| CAGR | 7.8% |
ジェネレーションIIIイメージインテンシファイア分野は、2034年にCAGR 8.7%で成長する見込みです。高度な感度と鮮明な画像で知られるこの世代は、防衛やヘルスケア環境で広く使用されています。複雑で視認性の低いシナリオでの信頼性の高い性能は、画像の鮮明さとスピードが譲れない重要な任務での魅力を高め続けています。
18mmカテゴリーは、2034年までのCAGRが10.2%と最も高い成長が見込まれています。コンパクトかつ軽量に設計されたこれらのイメージインテンシファイアは、ゴーグル、ハンドヘルド光学機器、ヘルメットマウント機器など、ウェアラブルでポータブルなシステムに最適です。小型でパワフルな性能により、戦術的な場面でも臨床的な場面でも、迅速な対応タスクに非常に適しています。
中国イメージインテンシファイア市場は2034年までCAGR 9.8%で成長すると予測されています。この急成長の背景には、セキュリティ技術とヘルスケアインフラの両方に対する政府投資の増加があります。画像処理システムの国内生産は、輸入への依存を減らすことを奨励する国の政策に後押しされ、力強い勢いを増しています。軍事調達と病院のアップグレードの両方からの需要が、この地域の市場を引き続き強化すると思われます。
イメージインテンシファイア市場を形成する主な業界プレーヤーには、キヤノン、L3Harris、Elbit Systems、浜松ホトニクス、Argus、Dantec Dynamics、Harder Digitalなどがあります。市場ポジションを強化するため、イメージインテンシファイア業界の主なプレーヤーは、高解像度、長寿命、低照度性能を備えた先進世代技術を開発するため、研究開発に多額の投資を行っています。各社は、長期的な供給契約を確保するために、軍事契約やヘルスケア機器メーカーとの戦略的パートナーシップを追求しています。さらに、需要の増加に対応し、サプライチェーンの混乱を回避するため、特にアジア太平洋地域における製造拠点の拡大に注力しています。製品の小型化とウェアラブルシステムへの統合は、進化する防衛・医療用途に対応するために優先されています。
目次
第1章 調査手法と範囲
第2章 エグゼクティブサマリー
第3章 業界考察
- エコシステム分析
- サプライヤーの情勢
- 利益率
- コスト構造
- 各段階での付加価値
- バリューチェーンに影響を与える要因
- ディスラプション
- 業界への影響要因
- 促進要因
- 防衛・セキュリティ分野における持続的な需要
- 医療画像アプリケーションの成長
- 産業および自動車試験の拡大
- CMOSおよびCCDセンサーとの統合
- デジタル画像への技術移行
- 業界の潜在的リスク&課題
- 高度なイメージインテンシファイアデバイスの高コスト
- 固体撮像技術との競合の激化
- 市場機会
- 促進要因
- 成長可能性分析
- 規制情勢
- 北米
- 欧州
- アジア太平洋地域
- ラテンアメリカ
- 中東・アフリカ
- ポーター分析
- PESTEL分析
- テクノロジーとイノベーションの情勢
- 現在の技術動向
- 新興技術
- 価格動向
- 過去の価格分析(2021-2024)
- 価格動向の要因
- 地域による価格差
- 価格予測(2025-2034)
- 価格戦略
- 新たなビジネスモデル
- コンプライアンス要件
- 持続可能性対策
- 持続可能な材料の評価
- カーボンフットプリント分析
- 循環型経済の実現
- 持続可能性の認証と基準
- 持続可能性ROI分析
- 世界の消費者感情分析
- 特許分析
第4章 競合情勢
- イントロダクション
- 企業の市場シェア分析
- 地域別
- 北米
- 欧州
- アジア太平洋地域
- 市場集中分析
- 地域別
- 主要プレーヤーの競合ベンチマーキング
- 財務実績の比較
- 収益
- 利益率
- 研究開発
- 製品ポートフォリオの比較
- 製品ラインナップの広さ
- テクノロジー
- 革新
- 地理的プレゼンスの比較
- 世界フットプリント分析
- サービスネットワークの範囲
- 地域別の市場浸透率
- 競合ポジショニングマトリックス
- リーダーたち
- 課題者たち
- フォロワー
- ニッチプレイヤー
- 戦略的展望マトリックス
- 財務実績の比較
- 主な発展, 2021-2024
- 合併と買収
- パートナーシップとコラボレーション
- 技術的進歩
- 拡大と投資戦略
- 持続可能性への取り組み
- デジタル変革の取り組み
- 新興企業/スタートアップ企業の競合情勢
第5章 市場推計・予測:世代別、2021年~2034年
- 主要動向
- 第1世代
- 第2世代
- 第3世代
第6章 市場推計・予測:タイプ別、2021年~2034年
- 主要動向
- ゲート画像増強管
- 非ゲート型イメージインテンシファイア
- 自動ゲート画像増強装置
第7章 市場推計・予測:直径別、2021年~2034年
- 主要動向
- 18mm未満
- 18 mm~25 mm未満
- 25 mm~37 mm未満
- 37 mm以上
第8章 市場推計・予測:用途別、2021年~2034年
- 主要動向
- 暗視装置
- ゴーグル
- 双眼鏡
- 単眼鏡
- カメラシステム
- 科学的画像
- X線画像
- その他
第9章 市場推計・予測:最終用途産業別、2021年~2034年
- 主要動向
- 防衛とセキュリティ
- 産業
- 医療
- その他
第10章 市場推計・予測:地域別、2021年~2034年
- 主要動向
- 北米
- 米国
- カナダ
- 欧州
- ドイツ
- 英国
- フランス
- スペイン
- イタリア
- オランダ
- アジア太平洋地域
- 中国
- インド
- 日本
- オーストラリア
- 韓国
- ラテンアメリカ
- ブラジル
- メキシコ
- アルゼンチン
- 中東・アフリカ
- サウジアラビア
- 南アフリカ
- アラブ首長国連邦
第11章 企業プロファイル
- Argus
- Aselsan
- Canon
- Dantec Dynamics
- Elbit Systems
- Hamamatsu Photonics
- Harder Digital
- Katod
- L3Harris Technologies
- Lambert Instruments
- Photek
- Photonis Technologies
- Siemens
目次
The Global Image Intensifier Market was valued at USD 1.6 billion in 2024 and is estimated to grow at a CAGR of 7.8% to reach USD 3.3 billion by 2034. Growth in this sector is primarily fueled by expanding adoption in both medical imaging and defense-related applications. Medical systems such as fluoroscopy units, interventional radiology tools, and C-arms continue to drive demand for these devices, as image intensifiers provide strong real-time imaging capabilities, excellent sensitivity, and cost efficiency. As healthcare providers prioritize high-quality imaging with affordability, demand remains consistently high. Meanwhile, military and security forces across key regions rely heavily on image intensifiers for their low-light operational reliability in surveillance, reconnaissance, and target acquisition tasks.
These devices continue to play a critical role in border surveillance and night-time operations, where reliable visibility in low-light conditions is vital. As geopolitical tensions rise and countries prioritize the modernization of their defense capabilities, there is an increased urgency to enhance tactical infrastructure with cutting-edge technologies. Image intensifiers enable forces to detect threats, conduct reconnaissance, and maintain situational awareness around the clock, ensuring operational readiness and security. Their ability to deliver clear, real-time imagery in challenging environments makes them indispensable for military and security agencies aiming to protect borders, and critical assets, and maintain strategic advantages in evolving conflict scenarios.
| Market Scope | |
|---|---|
| Start Year | 2024 |
| Forecast Year | 2025-2034 |
| Start Value | $1.6 Billion |
| Forecast Value | $3.3 Billion |
| CAGR | 7.8% |
Generation III image intensifiers segment is expected to grow at a CAGR of 8.7% during 2034. Known for their advanced sensitivity and sharper imaging, this generation is widely used in defense and healthcare environments. Their dependable performance in complex and low-visibility scenarios continues to boost their appeal for critical missions where image clarity and speed are non-negotiable.
The 18 mm category segment is expected to see the highest growth at a CAGR of 10.2% through 2034. Designed to be compact and lightweight, these image intensifiers are ideal for wearable and portable systems including goggles, handheld optics, and helmet-mounted gear. Their small size and powerful performance make them extremely suitable for fast-response tasks in both tactical and clinical settings.
China Image Intensifier Market is projected to grow at a CAGR of 9.8% throughout 2034. This rapid rise is due to increased government investments in both security technologies and healthcare infrastructure. Domestic production of imaging systems is gaining strong momentum, backed by national policies encouraging reduced reliance on imports. Demand from both military procurement and hospital upgrades will continue to strengthen the market in this region.
Major industry players shaping the Image Intensifier Market include Canon, L3Harris, Elbit Systems, Hamamatsu Photonics, Argus, Dantec Dynamics, and Harder Digital. To enhance their market position, key players in the image intensifier industry are heavily investing in R&D to develop advanced generation technologies with higher resolution, longer lifespan, and better low-light performance. Companies are pursuing military contracts and strategic partnerships with healthcare equipment manufacturers to secure long-term supply deals. Additionally, they are focusing on expanding regional manufacturing hubs, especially in Asia-Pacific, to meet growing demand and avoid supply chain disruptions. Product miniaturization and integration into wearable systems are being prioritized to cater to evolving defense and medical applications.
Table of Contents
Chapter 1 Methodology and scope
- 1.1 Market scope and definition
- 1.2 Research design
- 1.2.1 Research approach
- 1.2.2 Data collection methods
- 1.3 Data mining sources
- 1.3.1 Global
- 1.3.2 Regional/Country
- 1.4 Base estimates and calculations
- 1.4.1 Base year calculation
- 1.4.2 Key trends for market estimation
- 1.5 Primary research and validation
- 1.5.1 Primary sources
- 1.6 Forecast model
- 1.7 Research assumptions and limitations
Chapter 2 Executive summary
- 2.1 Industry 360° synopsis
- 2.2 Key market trends
- 2.2.1 Product type
- 2.2.2 Wood type
- 2.2.3 Entry type
- 2.2.4 End use industry
- 2.2.5 Regional
- 2.3 TAM Analysis, 2025-2034 (USD Billion)
- 2.4 CXO perspectives: Strategic imperatives
- 2.4.1 Executive decision points
- 2.4.2 Critical success factors
- 2.5 Future outlook and strategic recommendations
Chapter 3 Industry insights
- 3.1 Industry ecosystem analysis
- 3.1.1 Supplier landscape
- 3.1.2 Profit margin
- 3.1.3 Cost structure
- 3.1.4 Value addition at each stage
- 3.1.5 Factor affecting the value chain
- 3.1.6 Disruptions
- 3.2 Industry impact forces
- 3.2.1 Growth drivers
- 3.2.1.1 Sustained demand in defense and security applications
- 3.2.1.2 Growth in medical imaging applications
- 3.2.1.3 Expansion in industrial and automotive testing
- 3.2.1.4 Integration with CMOS and CCD sensors
- 3.2.1.5 Technological shift toward digital imaging
- 3.2.2 Industry pitfalls and challenges
- 3.2.2.1 High cost of advanced image intensifier devices
- 3.2.2.2 Growing competition from solid-state imaging technologies
- 3.2.3 Market opportunities
- 3.2.1 Growth drivers
- 3.3 Growth potential analysis
- 3.4 Regulatory landscape
- 3.4.1 North America
- 3.4.2 Europe
- 3.4.3 Asia Pacific
- 3.4.4 Latin America
- 3.4.5 Middle East & Africa
- 3.5 Porter's analysis
- 3.6 PESTEL analysis
- 3.7 Technology and Innovation landscape
- 3.7.1 Current technological trends
- 3.7.2 Emerging technologies
- 3.8 Price trends
- 3.8.1 Historical price analysis (2021-2024)
- 3.8.2 Price trend drivers
- 3.8.3 Regional price variations
- 3.8.4 Price forecast (2025-2034)
- 3.9 Pricing strategies
- 3.10 Emerging business models
- 3.11 Compliance requirements
- 3.12 Sustainability measures
- 3.12.1 Sustainable materials assessment
- 3.12.2 Carbon footprint analysis
- 3.12.3 Circular economy implementation
- 3.12.4 Sustainability certifications and standards
- 3.12.5 Sustainability ROI analysis
- 3.13 Global consumer sentiment analysis
- 3.14 Patent analysis
Chapter 4 Competitive landscape, 2024
- 4.1 Introduction
- 4.2 Company market share analysis
- 4.2.1 By region
- 4.2.1.1 North America
- 4.2.1.2 Europe
- 4.2.1.3 Asia Pacific
- 4.2.2 Market concentration analysis
- 4.2.1 By region
- 4.3 Competitive benchmarking of key players
- 4.3.1 Financial performance comparison
- 4.3.1.1 Revenue
- 4.3.1.2 Profit margin
- 4.3.1.3 R&d
- 4.3.2 Product portfolio comparison
- 4.3.2.1 Product range breadth
- 4.3.2.2 Technology
- 4.3.2.3 Innovation
- 4.3.3 Geographic presence comparison
- 4.3.3.1 Global footprint analysis
- 4.3.3.2 Service network coverage
- 4.3.3.3 Market penetration by region
- 4.3.4 Competitive positioning matrix
- 4.3.4.1 Leaders
- 4.3.4.2 Challengers
- 4.3.4.3 Followers
- 4.3.4.4 Niche players
- 4.3.5 Strategic outlook matrix
- 4.3.1 Financial performance comparison
- 4.4 Key developments, 2021-2024
- 4.4.1 Mergers and acquisitions
- 4.4.2 Partnerships and collaborations
- 4.4.3 Technological advancements
- 4.4.4 Expansion and investment strategies
- 4.4.5 Sustainability initiatives
- 4.4.6 Digital transformation initiatives
- 4.5 Emerging/ startup competitors landscape
Chapter 5 Market Estimates & Forecast, By Generation,2021-2034 (USD Million & Thousand Units)
- 5.1 Key trends
- 5.2 Generation I
- 5.3 Generation II
- 5.4 Generation III
Chapter 6 Market Estimates & Forecast, By Type, 2021-2034 (USD Million & Thousand Units)
- 6.1 Key trends
- 6.2 Gated image intensifiers
- 6.3 Non-gated image intensifiers
- 6.4 Auto-gated image intensifiers
Chapter 7 Market Estimates & Forecast, By Diameter, 2021-2034 (USD Million & Thousand Units)
- 7.1 Key trends
- 7.2 < 18 mm
- 7.3 18 mm to <25 mm
- 7.4 25 mm to <37 mm
- 7.5 ≥ 37 mm
Chapter 8 Market Estimates & Forecast, By Application, 2021-2034 (USD Million & Thousand Units)
- 8.1 Key trends
- 8.2 Night vision devices
- 8.3 Goggles
- 8.4 Binoculars
- 8.5 Monoculars
- 8.6 Camera systems
- 8.7 Scientific imaging
- 8.8 X-ray imaging
- 8.9 Others
Chapter 9 Market Estimates & Forecast, By End Use Industry, 2021-2034 (USD Million & Thousand Units)
- 9.1 Key trends
- 9.2 Defense & security
- 9.3 Industrial
- 9.4 Medical
- 9.5 Others
Chapter 10 Market Estimates and Forecast, By Region, 2021 – 2034 (USD Million & Thousand Units)
- 10.1 Key trends
- 10.2 North America
- 10.2.1 U.S.
- 10.2.2 Canada
- 10.3 Europe
- 10.3.1 Germany
- 10.3.2 UK
- 10.3.3 France
- 10.3.4 Spain
- 10.3.5 Italy
- 10.3.6 Netherlands
- 10.4 Asia Pacific
- 10.4.1 China
- 10.4.2 India
- 10.4.3 Japan
- 10.4.4 Australia
- 10.4.5 South Korea
- 10.5 Latin America
- 10.5.1 Brazil
- 10.5.2 Mexico
- 10.5.3 Argentina
- 10.6 Middle East and Africa
- 10.6.1 Saudi Arabia
- 10.6.2 South Africa
- 10.6.3 UAE
Chapter 11 Company Profiles
- 11.1 Argus
- 11.2 Aselsan
- 11.3 Canon
- 11.4 Dantec Dynamics
- 11.5 Elbit Systems
- 11.6 Hamamatsu Photonics
- 11.7 Harder Digital
- 11.8 Katod
- 11.9 L3Harris Technologies
- 11.10 Lambert Instruments
- 11.11 Photek
- 11.12 Photonis Technologies
- 11.13 Siemens
- 発行日
- 発行
- Global Market Insights Inc.
- ページ情報
- 英文 185 Pages
- 納期
- 2~3営業日